Transcription
Available online at www.sciencedirect.comJournal ofElectroanalyticalChemistryJournal of Electroanalytical Chemistry 621 (2008) 286–296www.elsevier.com/locate/jelechemCyclic voltammetry studies of Cd2 and Zn2 complexationwith hydroxyl-terminated polyamidoamine generation2 dendrimer at a mercury microelectrodeAlexander B. Nepomnyashchii, Mario A. Alpuche-Aviles, Shanlin Pan, Dongping Zhan,Fu-Ren F. Fan, Allen J. Bard *Department of Chemistry and Biochemistry and Center for Electrochemistry, The University of Texas at Austin, 1 University Station A5300,Austin, TX 78712-0165, United StatesReceived 26 November 2007; received in revised form 28 January 2008; accepted 30 January 2008Available online 8 February 2008This paper is dedicated to Israel Rubinstein on his 60th birthday.AbstractCyclic voltammetry was used to determine the stability constants for the complexation of cadmium and zinc ions with hydroxyl-terminated polyamidoamine generation 2 dendrimers with an ethylenediamine core (PAMAM G2-OH) at a mercury ultramicroelectrode.Cadmium and zinc ions were found to form poly-metal complexes through the interactions with interior amino groups rather thanhydroxyl groups and the maximum number of metal ions per dendrimer or stoichiometry was 4. Complexation is accompanied by a significant decrease in the limiting current and by measuring the changes in the magnitude of cathodic current with the analytical dendrimer:metal ion ratio and fitting the resulting curves, the four cumulative consecutive complexation constants were determined:1.3 105 M 1, 1.6 109 M 2, 3.3 1012 M 3 and 4.6 1014 M 4 for Cd2 and 1.0 106 M 1, 1.6 109 M 2, 4.6 1014 M 3 and2.6 1017 M 4 for Zn2 . The stronger interaction of zinc ions with PAMAM G2-OH compared to cadmium was accompanied witha sharper decrease of the cathodic current with the addition of dendrimer and a larger half-wave potential shift than cadmium. Thiswas rationalized by evaluating the changes of the diffusion coefficients for these two different systems by electrochemical means.Ó 2008 Elsevier B.V. All rights reserved.Keywords: Cyclic voltammetry; Mercury microelectrode; Complexation constant; Dendrimer1. IntroductionDendrimers are highly ordered branched macromolecules with repeating fragments. PAMAM dendrimers werefirst synthesized two decades ago by Tomalia et al. [1,2]and have since become well-characterized and widely studied systems. The highly branched dendritic structure hasadvantages over other macromolecular systems and canbe potentially used for drug delivery [3], catalysis [4,5],and, extraction of aqueous waste [6–9] under optimal conditions. Recent studies have shown that PAMAM dendri*Corresponding author. Tel.: 1 512 471 3761; fax: 1 512 471 0088.E-mail address: ajbard@mail.utexas.edu (A.J. Bard).0022-0728/ - see front matter Ó 2008 Elsevier B.V. All rights reserved.doi:10.1016/j.jelechem.2008.01.025mers can interact with metal ions through their interioror exterior complexing groups, and can serve as precursorsin the preparation of metal nanoparticles. For example, Pt[4], PtPd [5] and Au [10] nanoparticles have been synthesized with PAMAM. However, the thermodynamics anddetailed mechanism of the complexation process of dendrimers with metals and metal ions is still not clear.Absorption spectroscopy, filtration, polarography,potentiometry and other electrochemical methods can beused to study the complexation process of dendrimers withmetals [11,12]. Cyclic voltammetry (CV) is especially usefulin probing the nature of the metal–dendrimer complexationprocess. For example, CV has been used to characterize theinteraction of silver ions with dendrimers at an inlaid
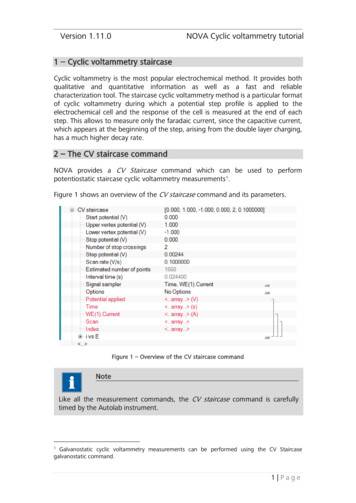
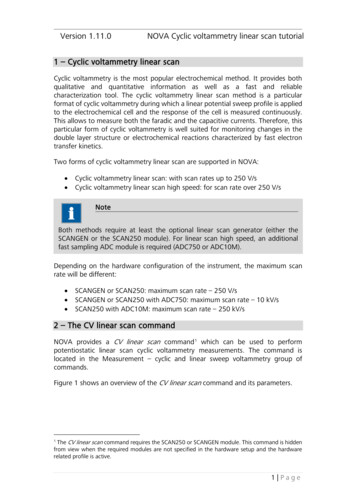
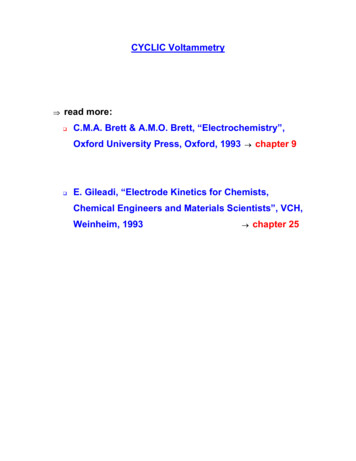
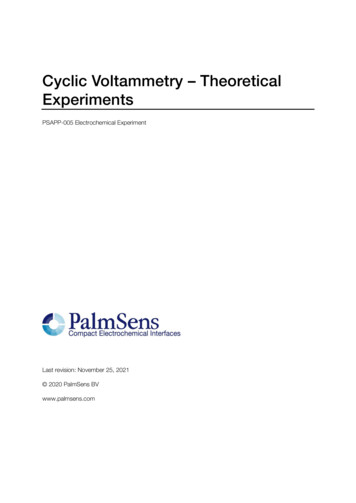
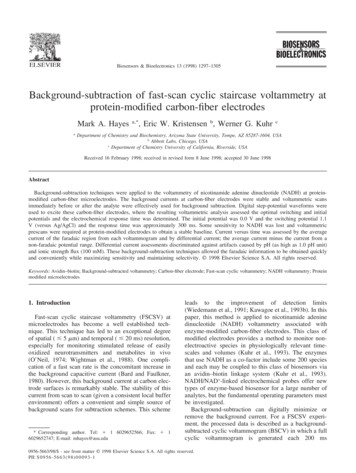
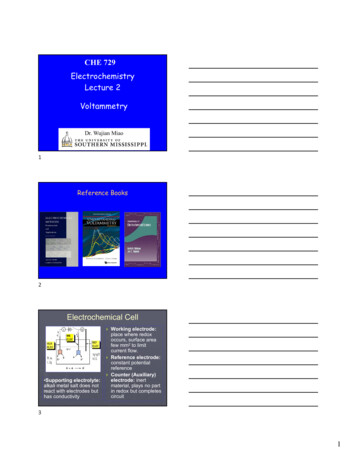
A.B. Nepomnyashchii et al. / Journal of Electroanalytical Chemistry 621 (2008) 286–296287Cd(NO3)2, citric acid, Na2HPO4 were purchased fromAldrich Chemical Co. (Milwaukee, WI); KNO3, NaNO3and agar was from Fisher Sci. Co. (Fair Lawn, NJ); hexamineruthenium (III) chloride was obtained from StremChemicals (Newbury Port, MA). All the compounds wereused without further purification. High-purity water (resistivity q 18 MX cm) (Milli-Q, Millipore Corp., Billerica,MA) was used in all experiments, and all solutions weredeaerated with argon for 30 min.2.2. Apparatus and methodsFig. 1. Chemical structure of PAMAM G2-OH dendrimer.macro gold or platinum disk electrode [13] and to studyredox labeled dendrimer systems [14,15]. One of the disadvantages of studying metal-ion complexation by CV is thefrequent occurrence of non-nernstian behavior of metalions at a solid metal electrode surface [16,17]. Mercuryhas a defect-free and renewable surface and reversible electrochemical behavior is frequently found for metal ionswhen amalgam formation occurs. For example, it has beenwidely used in polarography to measure the stability constants (KL, where L is the number of ligands per centralmetal) [17].In this report, we used a mercury ultramicroelectrode(UME) to study the complexation characteristics of zincand cadmium ions with generation 2 PAMAM (G2-OH)dendrimer (Fig. 1). The UME is also useful in measuringboth steady-state limiting currents and, with fast scan rates,in studying short-lived intermediates [18,19]. Cadmium andzinc have long been known to show good behavior at themercury electrode [20] and stable and reproducible cyclicvoltammograms were obtained with G2-OH. Our resultsindicate that cadmium and zinc can form poly-metal complexes through the interactions with interior amino groupsand the maximum coordination number of metal ions perPAMAM G2-OH is 4. The stability constants Kq (whereq 1–4, represents the number of metal ions per dendrimer) were determined by fitting the experimental results,and a stronger interaction of Zn2 compared to Cd2 withPAMAM G2-OH was observed.The mercury UME was prepared by following the procedure of Wehmeyer and Wightman [18]. Briefly, a 10 lmdiameter Pt disk microelectrode was polished with 0.3 lmalumina (Buehler, Lake Bluff, IL) and further sonicatedin 95% solution of ethanol. A solution of 5.7 mM mercurous ion was used for Hg deposition and 0.5% concentratednitric acid in 1 M KNO3 was added to prevent hydrolysisof the mercurous ions. Mercury was deposited on the PtUME, recording the current transient at a potential of0.1 V vs SCE for 333 s. Fig. 2 shows a schematic drawingof the mercury UME formed in this manner. The radiusof the mercury UME produced was determined as 7 lmfrom steady-state voltammograms of cadmium nitratesolutions at several concentrations. The mercury could bestripped off of the platinum surface by applying a positivepotential of 0.5 V (vs SCE) at the end of the experiment toavoid contamination of the Pt electrode. A fresh Hg UMEwas prepared for every set of experiments. A three compartment electrochemical cell, with working electrode, platinum wire auxiliary electrode and SCE reference electrode,was used for electrochemical experiments involving titration of metal ion with dendrimer. A 2% solution of the agargel in 0.2 M NaNO3 aqueous solution was used as a saltbridge to the SCE to avoid any possible contaminationof the test solution by chloride and mercury ions. PAMAMG2-OH (MW 3272 g/mol) was used as the titrant forboth Cd2 and Zn2 . As PAMAM G2-OH is added tothe metal ion solution, the viscosity increases and thisaffects the measured limiting current. A viscosity correctionwas made using 0.6 mM RuðNH3 Þ3þ6 at pH 3 in a buffercomposed of 0.2 M Na2HPO4 and 0.1 M citric acid. Allsolutions were purged with argon for 30 min prior to every2. Experimental section2.1. ChemicalsGeneration 2 hydroxyl-terminated PAMAM dendrimerwith an ethylenediamine core, Hg2(NO3)2 Zn(NO3)2,Fig. 2. Schematic drawing of a mercury hemispherical electrode fabricated on a platinum microelectrode by electrochemical deposition.
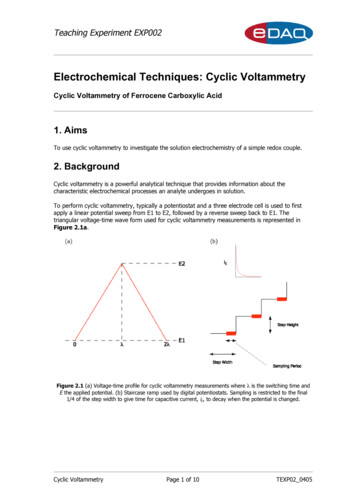
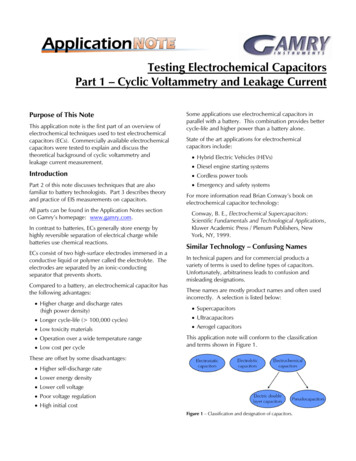
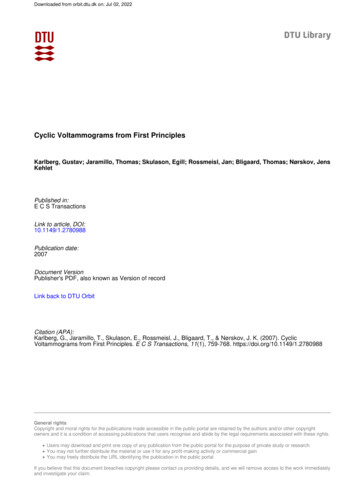
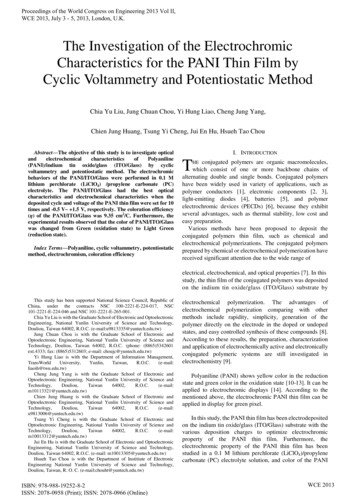
288A.B. Nepomnyashchii et al. / Journal of Electroanalytical Chemistry 621 (2008) 286–296electrochemical measurement. A CHI 660 electrochemicalstation (CH Instruments, Austin, TX) was used for all electrochemistry measurements.3. Results3.1. Reduction of Cd2 in the absence of dendrimers at thehemispherical mercury UMEThe electrochemical behavior of metal ions at a mercuryUME are different from those at a bare platinum or largehanging mercury electrode. The steady-state current ofmetal ions at a hemispherical Hg UME can be expressed asiss ¼ 2pnFDcr;ð1ÞFig. 3. Cyclic voltammograms of 0.6 mM Cd(NO3)2 at a mercurymicroelectrode at different scan rates; (1) 50 V/s; (2) 10 V/s; (3) 5 V/s; (4)1 V/s; (5) 0.1 V/s; (6) 0.05 V/s. The vertical arrow points to decreasingscan rate for decreasing cathodic current while the horizontal arrow pointsto decreasing scan rate for increasing negative potential shift of the anodicstripping peak. Supporting electrolyte: 0.2 M NaNO3. Electrode radius:7 lm.where n is the number of the electrons transferred, r is theradius of a hemispherical electrode and D is the diffusioncoefficient of the metal ion. Since the UME was made byelectrodeposition in our experiment, the radius of the electrode can be estimated from the deposition time, t, assuming a diffusion-controlled deposition of a mass of Hg and avolume of mercury V 4/3pr3r ¼ ½2MDM Ct q 1 2;ð2Þwhere M is the molecular weight and q is the density ofHg, and DM is the diffusion coefficient of mercurous ions.[18] Cyclic voltammograms of cadmium ions at a HgUME, at scan rates, v, of 0.05–50 V/s (Fig. 3) showed aslight shift of the half-wave potential to more negative values with a decrease of v. Such scan rate dependence at aHg UME is similar to that seen with mercury thin filmelectrodes and is caused by saturation of the amalgamwith metal at slow scan rates [21–23]. The experimental results for the reduction of Cd2 at the Hg UME were veryclose to digital simulation results (Fig. 4). Digital simulations were established by using Digielch 2.0 software [24].The disparity between the experimental and the simulatedoxidation current may partially be due to the modelingproblem of simulation and partially due to the incompletestripping of the cadmium from the mercury. The lattersuggests that a large quiet time must be used to regeneratea clean mercury drop. In the simulation, a spherical electrode was assumed and then corrected by a factor of 1/2for a hemisphere to obtain the results shown by Fig. 5a.This assumption might not be completely appropriate tosimulate the diffusion current within an electrode withspherical-segment geometry, e.g. a hemisphere. Simulations were established assuming very fast heterogeneouskinetics (ko 105 cm/s) and the measured uncompensatedresistance and capacitance values of 21 kX and1 10 10 F, respectively. Diffusion coefficients were foundFig. 4. Experimental (1) and simulated (2) cyclic voltammograms of 0.6 mM Cd(NO3)2. Scan rate: (a) 50 mV/s; (b) 50 V/s. Experimental data: supportingelectrolyte: 0.2 M NaNO3. Electrode radius 7 lm. Simulated data: diffusion coefficient of Cd2 was 6.8 10 6 cm2/s and for the metal stripping8.0 10 6 cm2/s; Uncompensated resistance: 21 kX; capacitance: 1 10 10 F.
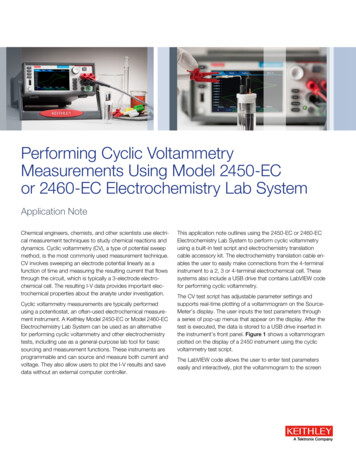
A.B. Nepomnyashchii et al. / Journal of Electroanalytical Chemistry 621 (2008) 286–296289Fig. 5. (a) Experimental cyclic voltammogram (1) of 0.6 mM metal ions under radial diffusion control at a hemispherical mercury electrode and simulateddata (2) under radial diffusion control without film formation; scan rate 50 mV/s. (b) Scan rate dependence of the peak current of the cyclicvoltammograms for metal ions under radial diffusion control (1: simulated; 2: experimental data) in comparison of the one under planar diffusion control(3: simulated results); (c) expanded plot of the b in the peak current range from 13 to 28 nA. For the experimental data: supporting electrolyte: 0.2 MNaNO3. Electrode radius 7 lm. Simulated data: Diffusion coefficient of Cd2 was 6.8 10 6 cm2/s and for the metal stripping 8.0 10 6 cm2/s;Uncompensated resistance: 21 kX; capacitance: 1 10 10 F.to be 6.8 10 6 cm2/s for the reduction of cadmium ionsand 8.0 10 6 cm2/s for the stripping of cadmium metalfrom mercury. Usually the stability constants K of thecoordination reactions between metal ions and organicspecies are determined by measuring the potentialdifference in the voltammetry of free metals to the ligandbound ones [20]. However, cadmium shows a negative potential shift at low scan rate at a Hg UME, limiting theuse of a slow scan rate to determine the stability constantsthrough potential shifts (Figs. 3 and 5a). Therefore fastscan rates of 1 V/s or higher were used to determine thecomplexation parameters of cadmium based on the potential shift after a complex formed with other ligands. In thiscase the formed amalgam is not saturated and thus theexperimental conditions are close to those for a simple diffusion-controlled process of metal ions in solution. Fastscans can be used for current measurements, where theelectrochemical reduction of the metal ions at the HgUME can be treated by planar-diffusion and the Randles–Sevčik equation used for current calculations. Theregion between the spherical and planar diffusion-controlled processes is less convenient to treat. Since theamalgam film is not saturated with Cd, metal diffusion inside the mercury film leads to electrochemical behaviorcharacteristic of diffusion control with no potential shiftas a function of v. The slow scan rate experiments showthat the steady-state current is the same at Hg UME asthat of a regular hemispherical electrode without influenceof amalgam formation (Fig. 5a). This combination of slowand fast scan rate CV allows us to determine the character of the binding between dendrimer macromolecule andmetal ions. The experimental and theoretical scan ratedependences of cathodic peak current are presented inFig. 5b. There is a change from hemispherical to planardiffusion with an increase in scan rate. At 30 and 50 V/sthe square root scan rate dependence is close to linear,indicating diffusion control. The line does not extrapolateto zero due to the small contribution of the radial diffusion as evident from the simulation of hemisphericalUME (Fig. 5a).
290A.B. Nepomnyashchii et al. / Journal of Electroanalytical Chemistry 621 (2008) 286–2963.2. Reduction of the Zn2 in the absence of dendrimers athemispherical Hg UMESimilar to electrochemical behavior of Cd2 at the HgUME, zinc also forms amalgams at the mercury electrodesurface after reduction (Fig. 6). The reduction peak currentshows a behavior close to a linear square root scan ratedependence, suggesting diffusion control at the Hg UME.The oxidation peak broadening in the CVs is due to theheterogeneous kinetic limitations of the electrode reaction.3.3. Complexation studies of the PAMAM G2-OHdendrimers with Cd2 and Zn2 ionsAddition of the bulky ligand to the metal ions has twoeffects: a significant decrease in the diffusion coefficientand a negative shift in the potential of the wave. TheCVs of Cd2 in the presence of G2-OH at scan rates of50 V/s and 50 mV/s in Fig. 7 show the pronounced negative shift in the reduction potential. A similar shift in thereduction peak upon addition of dendrimer was observedfor silver–dendrimer G2-OH complex [13]. Compared withZn2 , as we will discuss below in more detail, the reductionpeak potential shift for Cd2 is relatively small because ofweaker interaction between Cd2 and the dendrimer. Theshift of the oxidation reaction to more positive potentialwith v is ascribed to the effect of slower heterogeneouskinetics.One can study the complexation by titrating a solutionof the metal ion with dendrimer and noting the ratio oftotal metal ions to total ligand. A decrease in the reductioncurrent was obtained for Cd2 when PAMAM G2-OH wasadded to the electrolyte to form complexes. The decrease inreduction current is due to a decrease of the amount of freeCd2 and the formation of metal–dendrimer complexes,which have smaller diffusion coefficients than free Cd2 ions. The cyclic voltammograms for the free Cd2 andthe largely complexed Cd2 and their scan rate dependenceare shown in Fig. 7. A linear dependence of cathodic current on v1/2 at v 1 V/s shows a diffusion-controlled process for the formed metal–dendrimer complex (Fig. 7d).The metal–dendrimer binding stability and other characteristics can be studied by measuring the dependence of thereduction current on R CD/CM, where CD and CM arethe analytical concentrations of dendrimer and metal,respectively. As shown in Fig. 8, a dramatic decrease ofthe steady-state current after the initial addition of the dendrimer, with a very slow decrease in the presence of theexcess dendrimer is seen in the titration results. The formerdecay is due to the metal–dendrimer complex formationand the later is caused by the changes of solution viscosityinduced by the excess amount of dendrimer. The magnitude of current decay caused by the viscosity increase canbe estimated by addition of the same amount of dendrimer3þto 0.6 mM RuðNH3 Þ6 that does not form complexes withPAMAM G2-OH dendrimer. As shown in Fig. 8b, the3þreduction peak current of RuðNH3 Þ6 shows a decreasewith an increased amount of PAMAM G2-OH dendrimerdue to the increase of viscosity of the solution. Correctionof the titration results for Cd2 - and Zn2 -G2-OH complexformation by subtracting the current changes due to theviscosity changes yield an essentially flat current withR 4 (Fig. 8c).CVs for the Zn–PAMAM G2-OH dendrimer system areshown in Fig. 9. These are similar to the interaction of cadmium ions with dendrimers, with a negative potential shiftand a peak current decrease after the complexation. Thescan rate dependence and the CV for the mostly bound zincions show a diffusion control process (Fig. 9c). The greaternegative potential shift for zinc ion reduction than that forcadmium ion in the presence of dendrimers can beexplained by a stronger complexation of the dendrimersFig. 6. Cyclic voltammograms of 0.6 mM Zn(NO3)2 (a) at increasing scan rate and the peak current dependence on the scan rate (b). Supportingelectrolyte: 0.2 M NaNO3. Electrode radius: 7 lm.
A.B. Nepomnyashchii et al. / Journal of Electroanalytical Chemistry 621 (2008) 286–296291Fig. 7. Cyclic voltammograms of 0.6 mM Cd(NO3)2 upon the addition of various concentrations of dendrimer at a scan rate of 50 V/s (a); 0.05 V/s (b).The concentration of dendrimer are: 0 mM (1), 0.2 mM (2), 0.45 mM (3), 1 mM (4), 3 mM (5) and 6 mM (6), respectively; The arrows point to decreasingdendrimer concentration for decreasing anodic current. (c) is the expanded plot of b in the current range from 5 to 5 nA; (d) Scan rate dependence of thepeak current of 0.6 mM Cd(NO3)2 with 1 mM dendrimer added. Supporting electrolyte: 0.2 M NaNO3. Electrode radius: 7 lm.with Zn2 . The decrease of the current is sharper comparedwith the cadmium complexes, which also suggests formation of complexes with a larger formation constant.4. Theoretical modelClassically [25] the electrochemical (polarographic)study of complex ions was based on shifts in the half-wavepotential with ligand concentration. Measurements basedon the magnitude of the diffusion currents were ordinarilynot made, because the diffusion coefficients and simplemetal ion and complex were usually too similar to allowone to distinguish among the various complexes. Howeverwhen a metal ion complexes with a large ligand, such as apolymer, one can also obtain valuable information aboutcomplexation by studying the change in limiting currentwith the ratio of metal ion and ligand. This approach hasbeen used in investigations involving the intercalation ofruthenium complexes into DNA, for dendrimer–ferrocenemethanol electrostatic interactions, [26–30] and also in thedendrimer–silver ion complexation studies [13].The theoretical approach assumes the following squarescheme:qCd2 2qe DDMqCd(Hg) DDM(Cd 2 ) q DDM 2qeCd(Hg)qDDMOne assumes, based on the electrochemical behavior,that all electron transfer reactions are nernstian and thatall complexation reactions involving bound and free speciesare at equilibrium:E0b;q E0f ¼ ð0:059 2Þ logðK 0 K q Þð3Þwhere E0f corresponds to the standard potential for the freemetal ion electron transfer and E0b;q for the bound one, Kq isthe equilibrium constant for the cumulative complexationof q metal ions and K0 recognizes the possibility that the
292A.B. Nepomnyashchii et al. / Journal of Electroanalytical Chemistry 621 (2008) 286–296Fig. 8. Dependence of the normalized current on dendrimer concentrations for (a) 0.6 mM Cd(NO3)2 (1, ) and Zn(NO3)2 (2, j) and (b) 0.6 mMRuðNH3 Þ3þ6 . The data in (a) were corrected for the viscosity contribution using data from (b) and the corrected results are shown in (c). (d) is an expandedplot of (c) in the R range between 0 and 2.zero valent metal remains associated with the dendrimerafter reduction. The limiting potential shift for the cadmium–dendrimer interaction, at large R, was 0.080 V,which yields Kq/K0 to be 500. Complexation of the zincions with the dendrimer at large R gives a potential shiftof 0.136 V, which corresponds to the stability constant ratio Kq/K0 to be 4 104. Such limiting stability constantratios do not provide information about the individualcomplexation constants for smaller values of q. While thiscould be obtained in principle by studying the variation ofthe half-wave potential as a function of R, the rather smallpotential range would limit the precision of the reportedvalues. Rather, we used the variation of the limiting currentwith R to construct a theoretical model to determine thestability constant Kq.In the dendrimer titration experiments shown in Figs. 7–9 a solution of the free metal ion was prepared, dendrimerwas added in small increments, and the limiting current asa function of R was determined. The first addition of asmall amount of dendrimer (R 1) leads to the formationof the polynuclear complexes containing the maximumnumber of metal ions per ligand. Further additions of dendrimer causes the dissociation of the complexes and forma-tion of metal–dendrimer complexes with smaller q-values,finally dominated by q 1 at the end of the titration. Byassuming that all complexes formed have the same diffusion constant, Db, the steady-state current can be expressedto be the sum of the reduction current of free and complexed diffusing species,i ¼ 2pnFDf r½Me þ 2pnFDb rqXq½Meq L ð4Þq¼1where Df is the diffusion coefficient of free metal ion and Dbthe diffusion coefficient of the complexed metal. Themeasured diffusion coefficient of zinc complex is 3.6 10 6 cm2/s, which is smaller than that of cadmium–dendrimer complex, 4.6 10 6 cm2/s, The diffusion coefficient ofthe cadmium ions is also higher (6.8 10 6 cm2/s) compared with zinc ions (5.4 10 6 cm2/s) due to the smallerhydrated radius.The steady-state current of Eq. (4) can be normalizedusing the current for totally free metal ions in the absenceof dendrimer andq½Meq L ¼ K q ½Me ½L ð5aÞ
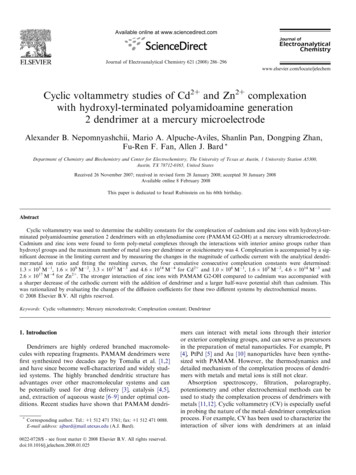
A.B. Nepomnyashchii et al. / Journal of Electroanalytical Chemistry 621 (2008) 286–296293Fig. 9. Cyclic voltammograms of 0.6 mM Zn(NO3)2 upon the addition of various concentrations of dendrimer at a scan rate of 50 V/s (a); 0.05 V/s (b).The concentration of dendrimer are: 0 mM (1), 0.06 mM (2), 0.12 mM (3), 0.45 mM (4), 0.6 mM (5), 1 mM (6), 1.5 mM (7) and 4 mM (8), respectively; Thearrows point to decreasing dendrimer concentration for decreasing anodic current. (c) Scan rate dependence of the peak current of 0.6 mM Zn(NO3)2 with1 mM dendrimer added. Supporting electrolyte: 0.2 M NaNO3. Electrode radius: 7 lm.to obtaininorm ¼¼q½Me Db XqþqK q ½Me ½L CMDf C M q¼1½Me DbþðC M ½Me ÞCMDf C Mð5bÞwhere CM is the total metal ion concentration withoutaddition of dendrimers. Free metal ion concentration[Me] in the presence of dendrimer can therefore be derivedfrom Eq. (5), inorm DDbf C M½Me ¼ð6Þ1 DDbfUsing expressions (5) and (6) and the ones [31] related tothe stability constant for each of the metal–dendrimer complex and its relation with free metal concentration [Me] andfree dendrimers [L], we then get a direct relationship between the R and free metal concentration (see appendix).[32]PqðC M ½Me Þð q¼1 ðK q ½Me þ 1ÞPqR¼ð7ÞC M q¼1 qK q ½Me qSince [Me] is related to the normalized current (Eq. (6))one can obtain the values of Kq from a plot of inorm vsR. The maximum value of q is obtained from consideration of the initial points of this plot, which in this casegive a value of 4. The inorm vs R curve was fit with anon-linear routine with four unknown equilibrium constants as adjustable parameters. The curves are shownin Fig. 10 and the equilibrium constants obtained are given in Table 1.Note the different diffusion coefficients for the differentmetal ions for the 1:1 Me–dendrimer complex (q 1).We are confident in these values since they are calculatedfrom the steady-state current under conditions where nonet changes in the current due to the complexation occur(i.e., no changes in [Me] or D with [L]). This could indicate that the different metal–dendrimer complexes couldalso have different diffusion coefficients. It could be possible to add these parameters to the mathematical model,but at the expense of requiring many more experimentalpoints to provide a statistically significant fit. However,our model, assuming all D are equal, fits the experimental results well. The difference in D for the Me-DENcomplexes (q 1), even though they follow the trendof the free ions, are within the same order of magnitudefor the different metal ions and complexes (3–7 10 6 cm2/s). However, the equilibrium constants vary8 and 11 orders of magnitude for the Cd- and Zn-complexes. Thus, our results suggest that the changes of D
294A.B. Nepomnyashchii et al. / Journal of Electroanalytical Chemistry 621 (2008) 286–296Fig. 10. Fit of the normalized peak current vs R. Plot concentration is 0.6 mM for both Cd(NO3)2 (a) or Zn(NO3)2 (b). Points are experimental values andline is fitted with the formation constants in Table 1.Table 1Four equilibrium constants for cadmium(II)–dendrimer and Zn(II)–dendrimer complexes determined by fitting the electrochemical titrationresults2 CdZn2 K1 (M 1)K2 (M 2)591.3 101.0 1061.6 102.1 1011K3 (M 3)123.3 104.6 1014K4 (M 4)4.6 10142.6 1017for the Me-DEN complexes or their effects are negligibleand the equilibrium constants carry most of the weighton determining the voltammetric properties of thesesystems.Consistent with our electrochemical study at a HgUME, previous spectrophotometric titration studies ofG2-OH dendrimer by copper (II) ions show a saturationnumber of the metals to be equal to 4. Cadmium, zincand copper have similar complexation behavior withG2-OH dendrimer and a maximum stoichiometry of 4can be obtained for all of these metal ions to form complexes with dendrimer. This is also can be seen as evidence that the interior amino groups are responsiblefor the complexation rather than the exterior hydroxylgroups. The fit of the experimental curve using four equilibrium constants was very close to the experimentaldata. Zinc ion forms stronger complexes compared tocadmium ion. These results are consistent with the earlierreport on the complexes of zinc and cadmium withamines and ethylenediamines, [31] where the affinity ofzinc ions to nitrogen groups has been shown to be higherthan cadmium ions.5. ConclusionsTo conclude, reversible electrochemical behavior ofcadmium and zinc ions can be obtained at the HgUME. This electrode is easy to fabricate and it can beapplied to the study of the coordination chemistry ofdendrimers with metal ions. A square scheme can beused to explain the cadmium and zinc–dendrimer com-plexation. The present study shows that cadmium andzinc can form stable complexes with dendrimer throughits interior amino groups rather than exterior hydroxylgroups. In addition, zinc ion forms stronger complexeswith dendrimer than cadmium ion. An electrochemicaltitration and measurement of the limiting current as afunction of dendrimer:metal ratio was used to determinethe stability constants of the metal–dendrimer complexes,with a maximum number of metal centers per dendrimerof 4. The procedure should also be applicable to largerdendrimers (e.g. generation 3. . .), but the greater numberof complexed metal ions and smaller diffusion coefficientof Db will complicate the treatment.AcknowledgementWe gratefully acknowledge support of this research bythe Robert A. Welch foundation.Appendix AThe total metal concentration is equal to the sum of freemetal concentration [Me] and bonded ones withdendrimers,C M ¼ ½Me þqXq½Meq L ðA:1Þq¼1where q is the number of metal ions coordinated to onedendrimer. The total dendrimer concentration CD is composed of free dendrimers and the complexed onesC D ¼ ½MeL þ ½L ðA:2Þwith the stability constant for each metal–dendrimercomplex,Kq ¼½Meq L ½Me q ½L ðA:3Þfrom which the concentration of each of the correspondingmetal–dendrimer complexes can be derived,
A.B. Nepomnyashchii et al. / Journal of Electroanalytical Chemistry 621 (2008) 286–296q½Meq L ¼ K q ½Me ½L ðA:4Þusing Eq. (A.4) to replace [MeqL] in Eq. (A.2), we obtainthe expression for the total dendrimer concentration asfunction of free dendrimer [L], free metal [Me] and stabilityconstants Kq,CD ¼qXqK q ½Me ½L þ ½L ðA:5Þq¼1therefore the free dendrimer concentration can be written as,CDqq¼1 ðK q ½Me þ 1Þ½L ¼ PqðA:6ÞUsing Eqs. (A.1) and (A.3) to replace [L] in the aboveequation by [Me] and stability constants, we can obtainthe following expression,PðC M ½Me Þð qq¼1 ðK q ½Me þ 1ÞPqðA:7ÞCD ¼qq¼1 qK q ½Me Rewriting the above equation by changing the position ofCD and CM yieldsPC D qq¼1 qK q ½Me qðA:8ÞC M ¼ ½Me þ Pqqq¼1 ðK q ½Me þ 1Þsince R CD/CM, Eq. (A.8) can be rewritten as Eq. (7)above.295[21] W.T. De Vries, E.J. Van Dalen, Electroanal. Chem. 14 (1967) 315.[22] N. Donten, Z. Stojek, Z. Kublik, Electroanal. Chem. 163 (1984) 11.[23] M.A. Baldo, S. Daniele, G.A. Mazzocchin, Electrochim. Acta 41(1996) 811.[24] (a) M.J. Rudolph, Electroanal
Keywords: Cyclic voltammetry; Mercury microelectrode; Complexation constant; Dendrimer 1. Introduction Dendrimers are highly ordered branched macromole-cules with repeating fragments. PAMAM dendrimers were first synthesized two decades ago by Tomalia et al. [1,2] and have since become well-characterized and widely stud-ied systems.