Transcription
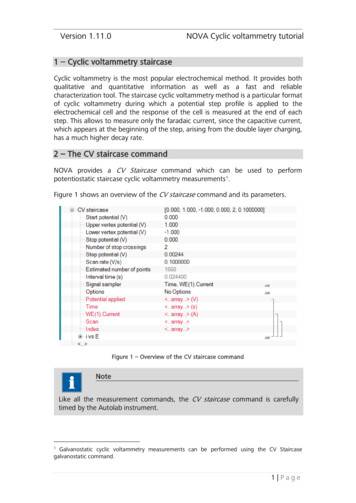
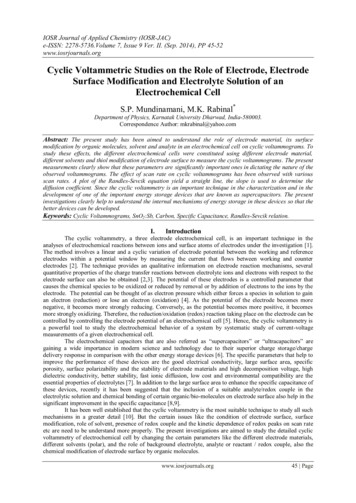
Teaching Experiment EXP002Electrochemical Techniques: Cyclic VoltammetryCyclic Voltammetry of Ferrocene Carboxylic Acid1. AimsTo use cyclic voltammetry to investigate the solution electrochemistry of a simple redox couple.2. BackgroundCyclic voltammetry is a powerful analytical technique that provides information about thecharacteristic electrochemical processes an analyte undergoes in solution.To perform cyclic voltammetry, typically a potentiostat and a three electrode cell is used to firstapply a linear potential sweep from E1 to E2, followed by a reverse sweep back to E1. Thetriangular voltage-time wave form used for cyclic voltammetry measurements is represented inFigure 2.1a.Figure 2.1 (a) Voltage-time profile for cyclic voltammetry measurements where λ is the switching time andE the applied potential. (b) Staircase ramp used by digital potentiostats. Sampling is restricted to the final1/4 of the step width to give time for capacitive current, ic, to decay when the potential is changed.Cyclic VoltammetryPage 1 of 10TEXP02 0405
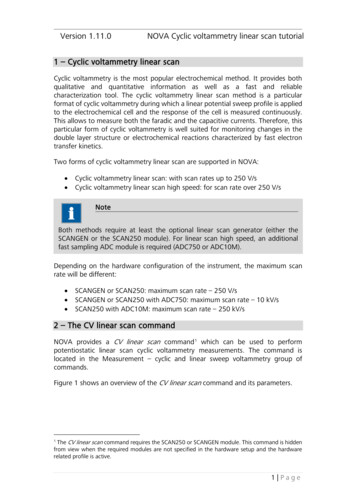
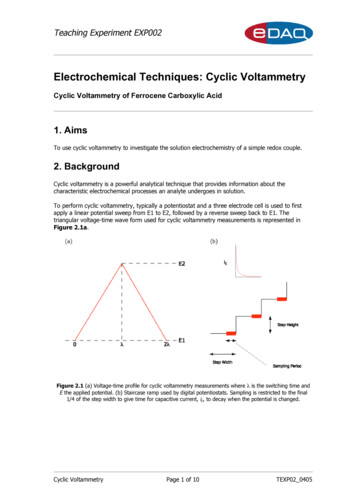
Teaching Experiment EXP002The potential applied, E, will control the concentration of the two redox forms in accordance withthe Nernst equation:()E E 0 RT nF ln Ox Red (2.1)where Ox oxidised species; Red reduced species.With digital instruments, a staircase potential ramp is used, as represented in Figure 2.1b. Thisis because digital to analog converters output discrete voltage values. To reduce the influence ofthe capacitive current, ic, which forms when the voltage is changed, current sampling is generallyrestricted to the final 1/4 of the step width, where ic has decayed.The Faradaic current (if) will depend on the concentration gradient of Ox at the electrode surface(Nernst diffusion layer) according to:(i f nFAD a d Ox dx) (2.2)Where Da is the diffusion coefficient for the electroactive species and A is the area of theelectrode. During the reducing scan, the surface concentration of species Ox progressivelydecreases, resulting in an increased concentration gradient and a larger current. As reductioncontinues, the concentration of Ox at the electrode surface is depleted, and the current peak willdecay if fresh Ox from the bulk solution does not have enough time to diffuse to the electrodesurface. When the direction of the potential scan is reversed, a peak resulting from there-oxidation of reduced Red is observed.Currents generated by the oxidation and reduction reactions at the working electrode aremeasured and plotted against applied potential on a cyclic voltammogram (CV). Figure 2.2shows the shape of typical CV for a single electron transfer process. Cyclic voltammograms arecharacterised by peak potentials, Ep, at which the current reaches a local maximum or minimumand the value of the peak current, ip, at these points.Figure 2.2 A typical cyclic voltammogram for a reversible single electron transferCyclic VoltammetryPage 2 of 10TEXP02 0405
Teaching Experiment EXP002When a redox reaction is 100% reversible, the oxidation and reduction peak currents areequivalent, and the peak current is given by the relation:(i p 0.4463nF nF RT111222) (D ) (V ) C Aaa (2.3)where V is the potential scan rate in V/s and Ca is analyte concentration in mol/cm3.Hence, reversible reactions may be diagnosed using the following criteria: Peak separation ΔEp EpRed - EpOx 59 mV (59 2.303 nF/RT at 298 K) ipOx/ipRed 1 ipOx and ipRed V1/2 EpOx and EpRed independent of VIn this practical, the potential scan rate (V) in Equation 2.3 is adjusted to see its influence onthe shape of a CV and the magnitude of the peak current. Observations made are then related toprocesses occurring at the surface of the working electrode and the properties of the analyte andsolution.Ferrocene Carboxylic Acid (FCA) is investigated, which undergoes a reversible single electronoxidation to ferricene as follows:Figure 2.3 Single electron transfer between FCA and FCA .In an electrochemical cell, the forward (oxidation) reaction is favoured at potentials positive ofthe E0 for the couple and gives a positive current. The reverse (reduction) reaction is favoured atpotentials negative of the E0 for the couple and gives a negative current.Cyclic VoltammetryPage 3 of 10TEXP02 0405
Teaching Experiment EXP0023. Equipment RequiredPer Group: Computer with EChem installed e-corder EA160 Potentiostat From the ET014 EChem Electrode Kit1.5 mm Glassy Carbon Disk Electrode (working electrode)mini Ag/AgCl Reference ElectrodePt Auxiliary Electrode3 mL Mini CellCell Stand Nitrogen gas cylinder with a needle valve and a hose terminating in Teflon tubing drawndown to a 1mm OD at the tip A role of electrical tape4. Reagents Required 0.002 M Ferrocene Carboxylic Acid Solution in Sodium Citrate Buffer with pH adjusted to7.5. Procedure5.1 Electrode Set-up5.1.1Set up the e-corder and Potentiostat using instructions in their respective manualson the eDAQ Software Installer CD.5.1.2Place 2 mL of ferrocene carboxylic acid solution into the cell provided and place intothe cell stand. Secure the lid and place the working electrode into the largest hole,adjusting the rubber O-ring into a position so that the tip of the electrode issubmerged in solution.5.1.3Insert the reference and auxiliary electrodes through two of the other holes, andtape to the working electrode. The tips of the electrodes should all be in the sameplane.5.1.4Make sure that needle valve of the nitrogen supply is closed and insert the fineTeflon tube end of the gas line through the remaining hole in the lid. Adjust thecylinder regulator to give a pressure reading of not more than 0.5 bar. (0.1 barideal). Slowly open the needle valve, adjusting the flow to give a steady stream ofsmall gas bubbles.Cyclic VoltammetryPage 4 of 10TEXP02 0405
Teaching Experiment EXP0025.1.5Connect the Red alligator clip from the potentiostat cable to the Auxiliary Electrode,the Green to the Working Electrode and the Yellow to the Reference Electrode.5.2 Familiarisation with EChem software5.2.1Double-Click the EChem icon on your computers desktop to launch EChem. Thescreen shows an X-Y graph of potential applied to the working electrode (V) againstthe current passed by the working electrode in µA5.2.2Double-Click on the Potentiostat button to the right of the main window to open thepotentiostat dialog box. Change the radio button from Standby to dummy, whichinternally connects a resistor between the electrodes. Set the current range to 10 µAand alter the applied potential using either the slider control or by typing a value intothe potential display. Increase the potential in 0.1 V jumps, the current trace shouldvary as you change the potential. The relationship between should be linear asexpected from Ohm's law. Finally reset the potential to 0 V.5.2.3Change the radio button from dummy to cell. The potential will now be appliedacross the electrodes. Repeat the procedure in Step 5.2.2, keeping the potentialsbetween –0.2 V and 1.0 V. Do NOT exceed these limits. It will be necessary tochange the current range (try 50 µA) to see the current responses. Notice that thereis a small range of potentials over which the current is very sensitive to appliedpotential.5.2.4Reset the potential to 0 V and click OK to close the potentiostat dialog box. Thepotentistat will automatically switch to standby mode.5.3 Cyclic Voltammetry of Ferrocene Carboxylic Acid5.3.1Switch the current range to 10 µA.5.3.2From the techniques menu select Cyclic Voltammetry. This opens the Staircase CyclicVoltammetry dialog box, which is used to set the limits and ramp rate of the voltagewaveform applied to the working electrode. In the dialog box, select the followingparameters:Initial 0 mVFinal 0 mVUpper Limit 700 mVLower Limit 0 mVRest Time 5 sRamp Rate 100 mV/sStep Width 20 msStep Height 2 mVSampling Period 5 msNumber of Cycles 3Click on View to preview the waveform defined. It should look like Figure 5.1.Cyclic VoltammetryPage 5 of 10TEXP02 0405
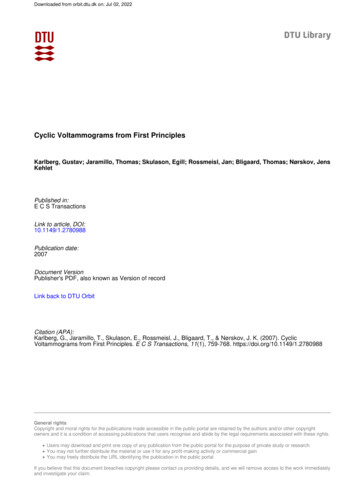
Teaching Experiment EXP002Figure 5.1 Waveform Overview Window5.3.3Select the Notebook under the Windows menu. Write some general notes on theexperiment including your name, Date, time and solution details. Close the windowand save the file using a suitable filename.5.3.4Lift the nitrogen line out of the solution. Check that there are no bubbles trapped onthe surface of the electrode. If there are, lightly tap the cell to dislodge them.5.3.5Click on Start to begin the potential scans. Voltammograms similar to that shown inFigure 5.3 should be recorded on pages 1, 2 and 3. After the scans, place thenitrogen line back into the solution.5.3.6If you are happy with the scans, click on the Page comment button (bottom left ofscreen) and enter a comment for the middle scan (solution, scan rate etc.).5.3.7In the Staircase Cyclic Voltammetry dialog box, change the Ramp Rate to 200 mV/s,the Step Width to 10 ms and the Sampling Period to 2.5 ms. Repeat Steps 5.3.4 to5.3.6 to obtain a new set of three voltammograms. If the current reading goes offscale, adjust the current range, and repeat the scans.5.3.8.Repeat 5.3.7, with a Ramp Rate of 500 mV/s, Step Width of 4 ms and a SamplingPeriod of 1 ms, adjusting the current range if necessary.5.3.9Switch the current range to 5 µA and obtain scans at 10 mV/s, Step Width of 200 msand a Sampling Period of 50 ms.6. Data Analysis6.1Overlay the middle CV of the three obtained for straight FCA at the different scanrates, by highlighting the corresponding page tabs and selecting Overlay All in theDisplay Menu. Print and label the overlain CVs for inclusion in your report.Annotate a single CV on the printout with the peak potentials (EpOx and EpRed) andpeak currents (ipOx and ipRed).6.2Tabulate the EpOx and EpRed values obtained for each of the CVs in Table 7.1.6.3As with many electrochemical techniques, cyclic votammograms often have slopingbaselines, and the peak currents can not be read directly. In EChem, two markerCyclic VoltammetryPage 6 of 10TEXP02 0405
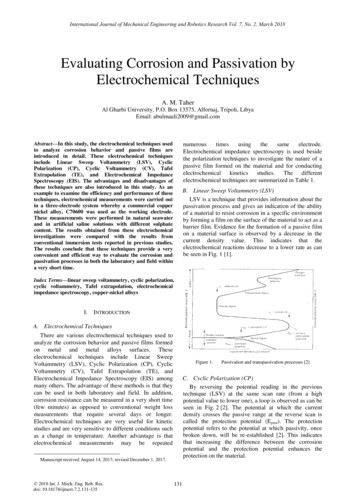
Teaching Experiment EXP002points can be used to define an estimated baseline from which the peak currents canbe determined.To set the two marker points, switch to the view of current and applied potentialagainst time view by selecting IE v t in the Display pop-up menu.The CVs should now look similar to Figure 6.1.6.3.1To measure the peak oxidation current (ipOx), drag the marker onto current (I)channel to t 0. Press Control-Alt (Command-Option for Macintosh) and drag asecond marker onto the CV that is independent of the waveform. Adjust the secondmarker so the tie line forms a tangent with the initial current slope during theoxidising sweep. See Figure 6.1 for an example. Use the cursor to measure thepeak current relative to the baseline and tabulate in Table 7.1. Repeat for each CV.Figure 6.1 Setting the baseline for ipOx in IE v t view6.3.2To measure the peak reduction current (ipRed) drag an initial marker onto the currentchannel at the time where the reduction scan starts. Press Control-Alt (CommandOption for Macintosh) and drag a second marker onto the CV that is independent ofthe waveform. Adjust the second marker so the tie line forms a tangent with theinitial current slope during the oxidising sweep. See Figure 6.2 for an example. Usethe cursor to measure the peak current relative to the baseline and tabulate inTable 7.1. Repeat for each CV.Cyclic VoltammetryPage 7 of 10TEXP02 0405
Teaching Experiment EXP002Figure 6.2 Setting the baseline for ipRed in IE v t view7. Results7.1 CV ParametersEpOx(mV)ipOx(µA)EpRed(mV)ipRed(µA) Ep(mV)100 mV/s scan 1100 mV/s scan 2100 mV/s scan 3200 mV/s scan 1200 mV/s scan 2300 mV/s scan 3500 mV/s scan 1500 mV/s scan 2500 mV/s scan 310 mV/s scan 110 mV/s scan 210 mV/s scan 3Cyclic VoltammetryPage 8 of 10TEXP02 0405
Teaching Experiment EXP0028. Questions8.1Do the results obtained support the electron transfer between ferrocene and ferricene beingreversible? What evidence is there to support this?The observations made should indicate that the electron transfer is reversible: Ep should be approximately 59 mV, however this can vary with laboratory temperature and thepositioning of the electrodes in the cell.IpOx IpRed However there may be errors associated with defining the baseline of the CV.8.2What happens to the peak current (ip) as the potential scan rate (V) changes? Explain why thisoccurs?The peak current increases at fast scan rates, and decreases at slower scan rates. This occursbecause Faradaic current is proportional to the concentration gradient of the oxidised species atthe working electrode surface. Larger concentration gradients are produced at fast scan rates asthere is reduced time for the bulk solution to diffuse into the layer of product that forms locally atthe surface of the working electrode.8.3Why do current signals decay after the peak currents (ip) are reached, even though oxidising orreducing potentials are still being applied to the working electrode? Why is this more pronouncedat faster scan rates?With time, the analyte at the electrode surface is consumed and the concentration gradients atthe electrode surface decrease, causing a decrease in Faradaic current if fresh analyte does nothave sufficient time to diffuse through the product produced to the electrode surface.8.4What do you predict will occur if a working electrodes with a smaller surface area is used toperform cyclic voltammetry? What would be the advantages and disadvantages of using thesmaller electrode?At equivalent potential scan rates, the peak current will be reduced because less analyte cantransfer electrons with the electrode surface. In addition the peak currents will not decay asmuch because the volume of the diffusion layer is not as great and bulk analyte diffuses to theelectrode surface faster.The advantage of using a smaller electrode is that flatter more stable peak currents are obtainedat faster scan rates. The disadvantage is that noise may become a problem when small currentsare being measured.Cyclic VoltammetryPage 9 of 10TEXP02 0405
Teaching Experiment EXP0029. Instructors Notes9.1 Computer System and Software RequiredA PC (running Windows 98 or later) or Mac (running OS 9 or later) computer with USB support isrequired per group. EChem must be installed for this experiment.9.2 ReagentsUse a sonicating bath to help prepare the ferrocene carboxylic acid solution, as the ferrocenederivative is only sparingly soluble in water. For the citrate buffer, prepare a combined 0.1 MSodium Citrate and 0.5 M NaCl solution with pH adjusted to 7 with HCL.9.3 Microelectrodes extensionIf an EA162 Picostat and some microelectrodes are available, this experiment can be extended toinvestigate cyclic voltammetry with microelectrodes. The file microelectrodes.efwdat that isincluded in this experiment’s resources folder, shows some examples of cyclic voltammogramsobtained using Pt microelectrodes with diameters ranging between 1 and 100 µm.As the currents obtained using these electrodes are in the pA range, noise can severely interferewith the signals obtained, hence the experiments are best performed inside a faraday cage.10. BibliographyP.W. Atkins, Chapter 29 – Dynamic Electrochemistry, in Physical Chemistry – 5th ed.,Oxford University Press 1994.H.A.O. Hill & G.S. Sanghera, Mediated amperometric enzyme electrodes, in Biosensors APractical Approach (A.E.G. Cass), Oxford University Press 1990.Cyclic VoltammetryPage 10 of 10TEXP02 0405
5.3 Cyclic Voltammetry of Ferrocene Carboxylic Acid 5.3.1 Switch the current range to 10 µA. 5.3.2 From the techniques menu select Cyclic Voltammetry. This opens the Staircase Cyclic Voltammetry dialog box, which is used to set the limits and ramp rate of the voltage waveform applied to the working electrode. In the dialog box, select the .