Transcription
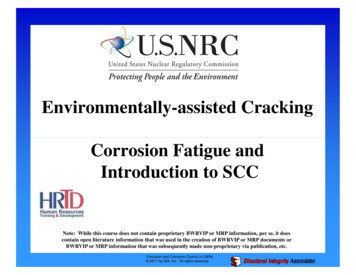
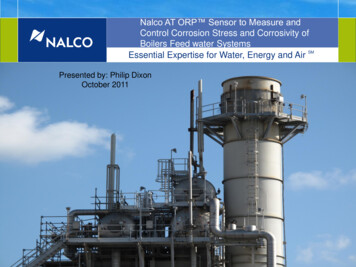
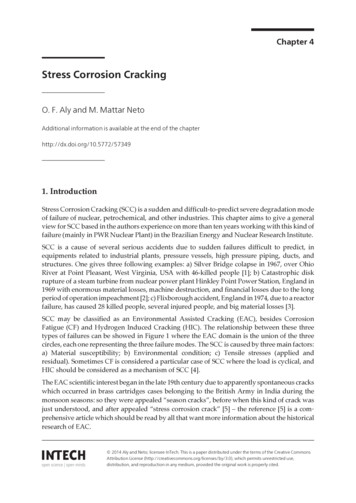
International Journal of Mechanical Engineering and Robotics Research Vol. 7, No. 2, March 2018Evaluating Corrosion and Passivation byElectrochemical TechniquesA. M. TaherAl Gharbi University, P.O. Box 13575, Alfornaj, Tripoli, LibyaEmail: abulmaali2009@gmail.comAbstract—In this study, the electrochemical techniques usedto analyze corrosion behavior and passive films areintroduced in detail. These electrochemical techniquesinclude Linear Sweep Voltammetry (LSV), CyclicPolarization (CP), Cyclic Voltammetry (CV), TafelExtrapolation (TE), and Electrochemical ImpedanceSpectroscopy (EIS). The advantages and disadvantages ofthese techniques are also introduced in this study. As anexample to examine the efficiency and performance of thesetechniques, electrochemical measurements were carried outin a three-electrode system whereby a commercial coppernickel alloy, C70600 was used as the working electrode.These measurements were performed in natural seawaterand in artificial saline solutions with different sulphatecontent. The results obtained from these electrochemicalinvestigations were compared with the results fromconventional immersion tests reported in previous studies.The results conclude that these techniques provide a veryconvenient and efficient way to evaluate the corrosion andpassivation processes in both the laboratory and field withina very short time. numeroustimesusingthesameelectrode.Electrochemical impedance spectroscopy is used besidethe polarization techniques to investigate the nature of apassive film formed on the material and for conductingelectrochemical kinetics studies. The differentelectrochemical techniques are summarized in Table 1.B. Linear Sweep Voltammetry (LSV)LSV is a technique that provides information about thepassivation process and gives an indication of the abilityof a material to resist corrosion in a specific environmentby forming a film on the surface of the material to act as abarrier film. Evidence for the formation of a passive filmon a material surface is observed by a decrease in thecurrent density value. This indicates that theelectrochemical reactions decrease to a lower rate as canbe seen in Fig. 1 [1].Index Terms—linear sweep voltammetry, cyclic polarization,cyclic voltammetry, Tafel extrapolation, electrochemicalimpedance spectroscopy, copper-nickel alloysI.INTRODUCTIONA. Electrochemical TechniquesThere are various electrochemical techniques used toanalyze the corrosion behavior and passive films formedon metal and metal alloys surfaces. Theseelectrochemical techniques include Linear SweepVoltammetry (LSV), Cyclic Polarization (CP), CyclicVoltammetry (CV), Tafel Extrapolation (TE), andElectrochemical Impedance Spectroscopy (EIS) amongmany others. The advantage of these methods is that theycan be used in both laboratory and field. In addition,corrosion resistance can be measured in a very short time(few minutes) as opposed to conventional weight lossmeasurements that require several days or longer.Electrochemical techniques are very useful for kineticstudies and are very sensitive to different conditions suchas a change in temperature. Another advantage is thatelectrochemical measurements may be repeatedFigure 1.C. Cyclic Polarization (CP)By reversing the potential reading in the previoustechnique (LSV) at the same scan rate (from a highpotential value to lower one), a loop is observed as can beseen in Fig. 2 [2]. The potential at which the currentdensity crosses the passive range at the reverse scan iscalled the protection potential (Eprot). The protectionpotential refers to the potential at which passivity, oncebroken down, will be re-established [2]. This indicatesthat increasing the difference between the corrosionpotential and the protection potential enhances theprotection on the material.Manuscript received August 14, 2017; revised December 1, 2017. 2018 Int. J. Mech. Eng. Rob. Res.doi: 10.18178/ijmerr.7.2.131-135Passivation and transpassivation processes [2]131
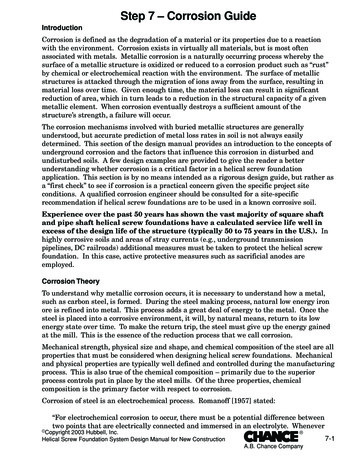
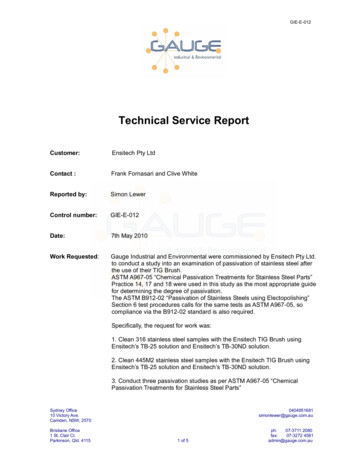
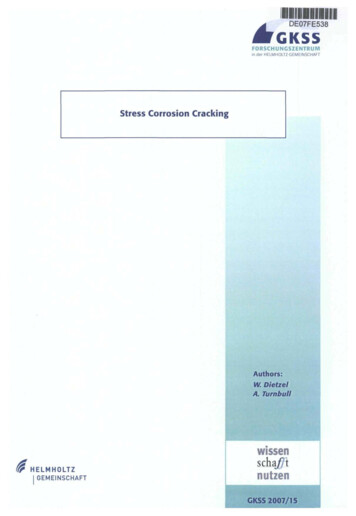
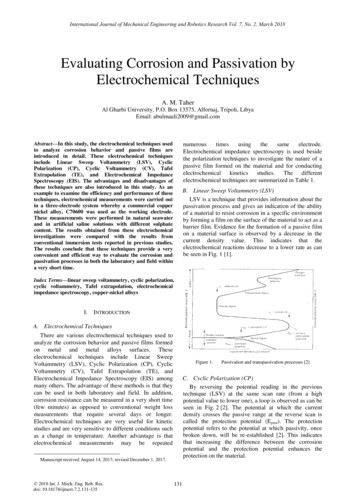
International Journal of Mechanical Engineering and Robotics Research Vol. 7, No. 2, March 2018F. Electrochemical Impedance Spectroscopy (EIS)Figure 2. Cyclic polarization curve [2]D. Cyclic Voltammetry (CV)CV is an electrochemical technique which is used toidentify the mechanism of the electrochemical processes,which take place at an electrode surface. The potential isscanned linearly between an initial potential E1 to asecond potential value E2 followed by reversal of thepotential scan back to the initial potential value as seen inFig. 3. The sweep rate might range from a few mV/s tothousands mV/s. The anodic peak current (ipa), thecathodic peak current (ipc), the anodic peak potential (Epa),and the cathodic peak potential (Epc) values can beobtained and can be used to identify the diffusioncoefficient of the ionic species involved.EIS is a technique used for corrosion ectrochemical kinetics studies. The principle ofimpedance (Z) measurements is based on the analysis of alow amplitude alternating potential signal of a widelyvarying frequency that is applied to the electrode/electrolyte interface. The current flowing through the cellis measured and the phase relationship between thecurrent and voltage signals is established digitally. Theelectrochemical impedance response of the corrodingelectrode may be modeled in terms of simple electricalcircuit elements, as seen in Fig. 5 [4], and estimates ofcorrosion rates and mechanisms are possible. There aremany kinds of plots to represent the variation of theimpedance, Z, as a function of frequency. The NyquistPlot is the most common, shown in Fig. 6 [3], a functionof the real part, Z’, on the X-axis, against the imaginarypart, Z’, on the Y-axis. The impedance behaves as asemicircle path, and at very low and very highfrequencies, the imaginary value of the impedance is zero.Figure 3. Cyclic voltammogram [5]Figure 5. An electrical circuit representation of EIS [4].(-)Potential( )E. Tafel Extrapolation (TE)TE is an electrochemical technique where the potentialis swept from a cathodic to an anodic value. The resultingdata is recorded as a log (i) vs. E plot. The corrosioncurrent and the corrosion potential are obtained from thistechnique. The corrosion rate is calculated from thecorrosion current (icorr). A Tafel extrapolation plot isshown in Fig. 4 [3].Figure 6.log iappFigure 4.Tafel Extrapolation plot [3]. 2018 Int. J. Mech. Eng. Rob. Res.132Nyquist pot [3]
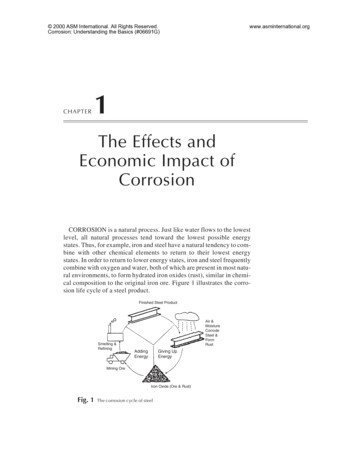
International Journal of Mechanical Engineering and Robotics Research Vol. 7, No. 2, March 2018TABLE I.Electrochemical TechniqueLinear Sweep Polarization (LSP)Tafel Extrapolation (TE)Cyclic Polarization (CP)Cyclic Voltammetry (CV)Electrochemical Impedance Spectroscopy(EIS)ELECTROCHEMICAL TECHNIQUESAppliedPotentialPotentialCyclic PotentialCyclic potentialAC with a wide range offrequency valuesRESULTS AND DISCUSSIONA. Tafel Extrapolation and Corrosion RatesThe cathodic and anodic slope constants, the corrosionpotential, and the corrosion current were estimated fromthe Tafel plots as seen in Fig. 7. The corrosion rateinitially decreased with increasing amounts of sulphae inthe solution from 0 ppm to 400 ppm, before the corrosionrate could increase drastically. The corrosion rate rangedfrom 0.03 mmpy in the 0 ppm sulphate artificial salinesolution to 0.046 mmpy in the sea waterseawaterenvironment. Similar results were obtained for the samealloy in a previous study (0.03 mmpy) at very lowconcentration of sulphide (0.01 mg/L) [5]. The corrosionrate in the absence of sulphate has been reported as 0.048 2018 Int. J. Mech. Eng. Rob. Res.Obtained ResultsPassivation potential rangeCorrosion rateCorrosion & protection potentialElectrochemical reaction natureThickness and number of layers of thepassivemmpy [6], 0.043 mmpy [7], 0.03 mmpy [8], and 0.023mmpy [9]. G. Kear et al. [10] reported that the corrosionrate varied between 0.01 mmpy and 0.24 mmpy. Whenadding sulphate up to a concentration of 600 ppm, therewas no significant change in the corrosion rate values, butif more than 600 ppm was added, the corrosion rateincreased to a relatively high value. Addition of sulphateto a level of 1000 ppm caused the corrosion rate to reach0.039 mmpy. The corrosion rate calculations were 0.042and 0.046 mmpy for the 2260 ppm sulphate and the N.S.seawater, respectively. Linear Polarization andPassivity Potential: The linear polarization plots for thecommercial alloy C70600 in different artificial salinesolutions and in N.S. seawater are shown in Fig.8. Theelectrochemical behavior of the commercial alloydepends on the amount of sulphate in the solution. In theabsence of sulphate in the artificial saline solution and atlow concentrations of sulphate (less than 400 ppm), theC70600 alloy has a good passivity in the potential valuerange from 0.1 to 0.75 V/SCE. This can be explainedby the decrease in the passivation current density value at 0.1 V/SCE to a lower value, which then remainsapproximately constant until the potential reaches a valueof 0.75 V/SCE. This indicates that the passive film hasgood integrity and there is very limited or no pittingcorrosion at low sulphate concentrations to destroy thepassivity of the film. Similar results in the 0 ppm sulphateartificial saline solution were reported in another study[11]. By increasing the sulphate content of the solution tomore than 400 ppm, a transpassive region appeared,which is an evidence of the breakdown of the passivefilm, and the current density starts to increase again. Thisresults in a decrease in the passivity potential range (thedifference between the passivation potential and thetranspassive potential value). In addition to the change inthe potential values, the passivation current densityvalues also increased by raising the amount of sulphateabove 400 ppm. The behavior of the commercial alloy inthe N.S. seawater environment was very close to thebehavior of the alloy in the 2260 ppm sulphate artificialsaline solution. Cyclic Polarization and the ProtectionPotential: Fig. 9 shows the cyclic polarization plots forthe commercial alloy C70600 in artificial saline solutionscontaining various amounts of suphfate and in N.S.seawater. The electrochemical behavior of thecommercial alloy depends on the amount of sulphate inthe solution. By adding up to 400 ppm sulphate to thesolution, the potential difference between the corrosionpotential (varied between 0.401 V/SCE and 0.409V/SCE) and the protection potential (varied between 0.138 V/SCE and 0.144 V/SCE) remainedG. Experimental ProcedureThe experiments in the present work were conductedusing a commercial alloy, C70600. All experiments werecarried out in aerated electrolytes and at roomtemperature (22 C 1.1 C). The average oxygendissolved was 8.2 mg/L. The pH of the natural seawaterwas 7.8, and for the synthetic saline solution the pHranged between 4.76 and 6.75, depending on the sulphatecontent. Materials, equipment, and experimentalprocedures used in this work are described in thefollowing sections. Materials: Samples were cut to 1 cm2surface area and were ground using 600 grit SiC paperand polished using 1 and 0.05 micron alumina. Thecommercial alloy was 88.62 wt% Cu, 9.86 wt% Ni,1.11 wt% Fe, 0.13 wt% Zn, 0.01 wt% Mo, 0.005 wt% Co.Electrolytes: Seawater was used as an electrolyte. It wasanalyzed and contained 17400 ppm Cl, 8560 ppm Na,2260 ppm SO4, 316 ppm K, 105 ppm Mg and 33 ppm Ca.In addition to the seawater, artificial saline solutions wereprepared using distilled water mixed with 2.86 wt% NaCland different amounts of sulphate (0, 50, 100, 200, 300,400, 500, 600, 700, 800, 1000, and 2260 ppm).Electrochemical Measurements: A potentiostat wasused for the different electrochemical techniquesincluding TE, LSV, CP, and CV by using a threeelectrode electrochemical cell. Only 1 cm2 of the Cu-Nisample surface was subjected to the electrolyte, a graphiterod with a surface area of 16.32 cm2 was used as thecounter electrode and a saturated calomel electrode (SCE)was used as the reference electrode. The potential rangeversus SCE and the scanning rate for LSV were 0.25 to0.75 V and 1 mV/s respectively, they were 1.5 to 2.5 Vand 1 mV/s for CP, 0.5 to 0.02 V and 1 mV/s for TE,and 1.5 to 1.5 V and 10 mV/s for CV.II.PlotsE vs. log(i)E vs. log(i)E vs. log(i)E vs. i(Z vs. Z )133
International Journal of Mechanical Engineering and Robotics Research Vol. 7, No. 2, March 2018[13]. Cyclic voltammetry: The voltammogram in the 0ppm solution is similar to one produced in a previousstudy for a 85 wt% Cu, 15 wt% Ni alloy [14]. Thissuggests that the reactions taking place in this system arenot ideally reversible because the anodic current peaksare not equal to the cathodic current peaks. The peaks thatappear could be attributed to the following reactions:approximately the same. By adding more than 400 ppmof sulphate, the potential difference became smaller,which indicates that the commercial alloy becomes lessprotected. This result is consistent with the resultsobtained by linear polarization, where 400 ppm ofsulphate led to a significant change in the behavior of thealloy. The smallest potential difference was observed forthe commercial alloy in the 2260 ppm artificial salinesolution and in the N.S. seawater. The corrosion potentialshifted to a more negative value in the solution containingup to 400 ppm sulphate (from 0.401 V/SCE in the 0ppm sulphate artificial saline solution to 0.409 V/SCEin the 400 ppm sulphate artificial saline solution).Starting from the artificial saline solution with 400 ppmsulfate as the electrolyte, the corrosion potential startsshifting to less negative values. It had a value of 0.391V/SCE in the 600 ppm sulphate artificial saline solution, 0.373 V/SCE in the 2260 ppm sulphate artificial salinesolution and approximately 0.375 V/SCE in the N.S.seawater. In contrast to the results obtained by anotherstudy [12], the corrosion potential for the commercialalloy in N.S. seawater was 0.220 V/SCE but theelectrolyte (the seawater) in this case was stagnant unlikethe previous report where the flow velocity of theseawater was 0.5 m/s. The behavior of the commercialalloy in the 2260 ppm artificial saline solution was thesame as that of the commercial alloy in the N.S. seawater,and these plots were similar to those reported by othersFigure 7. A Tafel extrapolation plot forcommercial alloy C70600 in 0 ppm sulphateartificial saline solution.2Cu H2O Cu2O 2H eCu2O ½O2 Cl- 2H2O Cu2(OH)3Cl OHIn the artificial saline solution with 2260 ppm sulphate,the peaks became more complicated and distorted, whichmade it difficult to separate the peaks from one another.The behavior of the commercial alloy in the N.S.seawater was similar to the behavior of the alloy in the2260 ppm sulphate artificial saline solution. It can benoted that the current density values of the anodic peakswere approximately constant up to a 400 ppm sulphateartificial saline solution, then they started to increasewhen more sulphate was added, causing a distortion inthe cyclic voltammogram. These increases in the currentdensity values can be explained by increases in thecorrosion rates in these conditions, and was consistentwith the linear polarization data.Figure 8. Linear sweep polarization plots forcommercial alloy C70600 in N.S. seawaterand in artificial saline solutions with variousconcentrations of sulphates.CONCLUSIONSREFERENCES[2]R. Kelly, J. Scully, D. Shoesmithd and R. Buchheit, “ElectricalTechniques in Corrosion Science and Engineering,” MarcelDekker, Inc., New York, 2003, p.1.J. Davis, “Corrosion: Understanding the Basics,” ASMInternational, Ohio, 2000. pp. 129-465. 2018 Int. J. Mech. Eng. Rob. Res.Figure 9. Cyclic Polarization plots forcommercial alloy C70600 in artificialsaline solutions for various concentrationsof sulphates and N.S. seawater.D. Jones, “Principles and prevention of corrosion,” MacmillanPublishing Company, 1992, pp. 2-5, 7, 9-34, 107-111, 142-150,161-164, 235-254.[4] J. Fildes, P. Chen, and X. Zhan, “Application of ElectrochemicalImpedance Spectroscopy, Color Visible Imaging, and InfraredImaging for Nondestructive Evaluation of Anti-CorrosionCoatings,” Northwestern University, May, 1995.[5] J. Gudas and H. Hack, “Parametric evaluation of susceptibility ofCu-Ni alloys to sulfide induced corrosion in seawater,” Corrosion,vol. 35, no. 2, pp. 259-264, 1979.[6] J. Gudas and H. Hack, “Sulfide Induced Corrosion of CopperNickel Alloys,” Corrosion, vol. 35, no. 2, 1979, pp. 67-73.[7] S. Sayed, E. Ashour, and G. Youssef, “Effect of sulfide Ions onthe corrosion behavior of Al-brass and Cu10Ni alloys in saltwater,” Materials Chemistry and Physics, vol. 78, 2003, pp. 825834.[8] M. Gavgali, I. Kaymaz, Y. Totik, and R. Sadeler, “Corrosionbehavior of 90% Cu 10% Ni alloy at different rotation speeds,”Corrosion Reviews, vol. 20, no. 4-5, 2002, pp. 403-414.[9] J. Al- Hajji and M. Reda, “Corrosion of Cu-Ni Alloys in SulfidePolluted Seawater,” Corrosion, vol. 49, no. 10, 1993, pp. 809- 820.[10] G. Kear, B. Barker, K. Stokes and F. Walsh, “Electrochemicalcorrosion behavior of 90-10 Cu-Ni alloy in chloride-basedElectrochemical methods are highly efficient for theevaluation of corrosion and passivation processes. Thereare many advantages of these methods over theconventional immersion tests such as saving time, givingaccurate results, and the ability to use these techniques inboth the laboratory and the field. By using thesetechniques, it was concluded that the behavior of thecommercial alloy C70600 depends on the amount ofsulphate in the saline solution.[1](2)Cu2(OH)3Cl OH- Cu2O ½ O2 Cl- 2H2O (3)[3]III.(1)134
International Journal of Mechanical Engineering and Robotics Research Vol. 7, No. 2, March 2018[11][12][13][14][15]electrolytes,” Journal of Applied Electrochemistry, vol. 34, 2004,pp. 659.R. North and M. Pryor, "The influence of corrosion productstructure on the corrosion rate of Cu-Ni alloys," Corrosion Science,vol. 10, 1970, pp. 297-311.B. Syrett and S. Wing, "Effect of flow on corrosion of coppernickel alloys in aerated seawater and in sulfide-polluted seawater,"Corrosion, vol. 36, no. 2, 1980, pp. 73-84.A. El-Domiaty and J. Al Hajji, “The susceptibility of 90 Cu-10 Nialloy to stress corrosion racking in seawater polluted by sulfideions,” Journal of Materials Engineering and Performance, vol. 6,no. 4, 1997, pp. 534-544.J. Mathlyarasu, N. Palaniswamy and V. Muralidharan, "An insightinto the passivation of cupronickel alloys in chlorideenvironment," Indian Acad. Sci. (Chem. Sci), vol. 113, no. 1, 2001,pp. 63-76.Educator’s Reference Guide for Electrochemistry, Pine InstrumentCompany,Pennsylvania, Feb 2000, p. 23. [Online]. P-PROF1.pdf.Abulmaali Taher is an Assistant Professorworking as a faculty member in the g, Al Gabal Al Gharbi University.He has Canadian citizenship and was born in1967 and grew up in Tripoli, Libya. Hereceived his MSc degree in MaterialEngineering from the University ScienceMalaysia (USM), Malaysia, in 1993. Hereceived his Ph.D degree in Material 2018 Int. J. Mech. Eng. Rob. Res.135Engineering from Dalhousie University, Canada, in 2008. He haspublished extensively in many international journals and has givenpresentations at several conferences in Canada, USA, Libya, Thailand,Indonesia and Malaysia. He is a member of many professional societiessuch as The Association of Professional Engineers, Geologists andGeophysicists of Alberta (APEGA), The American Society ofMechanical Engineers (ASME). The National Association of CorrosionEngineers (NACE), The Canadian Institute of Mining, Metallurgy, andPetroleum (CIM), The Minerals, Metals and Materials Society (TMS)and The Society of Automotive Engineers (SAE International).He has worked for about 25 years as an instructor and Scientificresearcher in different universities and higher education institutes inboth Libya and Canada. Dr. Abulmaali has served as a consultant tomany organizations on a wide range of problems related to materialsengineering in both Libya and Canada. He has received many awards,including an award for the best oral presentation in the 2008 graduateresearch symposium (Dalhousie University), an award for the best SEMimage in the 2008 IRM annual meeting and was the recipient of aDalhousie University award (Dalhousie University certificate inuniversity teaching and learning). At the current time his researchfocuses on the corrosion behavior of steels and copper nickel alloys inthe marine environment, corrosion in concrete, laser alloying andhardening and memory shape alloys.
Figure 2. Cyclic polarization curve [2] D. Cyclic Voltammetry (CV) CV is an electrochemical technique which is used to identify the mechanism of the electrochemical processes, which take place at an electrode surface. The potential is scanned linearly between an initial potential E 1 to a second potential value E 2