Transcription
Data Analysis Using SPSSBy: Akmal Aini Othman
The key to GOOD descriptive research isknowing exactly what you want to measure andselecting a survey method in which everyrespondent is willing to cooperate and capable ofgiving you complete and accurate informationefficiently–Joe Ottaviani-
Uncertainty InfluencesThe Type Of ResearchCAUSAL LORATORYSource: Zikmund, 2009
ProblemdiscoveryProblem Discoveryand DefinitionSelection ofresearchtechniqueSamplingSelection ofexploratory gDataProcessingandAnalysisProblem definition(statement ofresearch objectives)ExperimentLaboratoryConclusionsand ReportSurveyFieldInterviewCollection ofdata(fieldwork)Editing andcodingdataDataprocessingSelection ofbasic researchmethodResearch aryData StudyInterpretationoffindingsReportSource: Zikmund, 2009
Thesis Contents Chap 1 - IntroductionChap 2 - Literature ReviewChap 3 – MethodologyChap 4 – Findings & DiscussionChap 5 – Conclusion andRecommendation
Thesis Contents Introduction – why & what this research Literature Review – who have done this research &how, what results, what shortcomings Research Framework & Data Collection – why thisframework, hypotheses; measurements, sample, howdata can be collected Data Collection & Analysis – what methods mostappropriate, findings Conclusion – have u achieved what you set out to do?
Thesis Contents Chap 1 – Introduction Background of the studyProblem StatementResearch QuestionResearch ObjectiveHypothesisSignificance of the studyLimitation
Thesis Contents Chap 4 – Findings and Discussion Descriptive Analysis Test of Goodness of Data – e.g Normality &Multicollinearity Factor Analysis Reliability and Validity Test Inferential Analysis / Hypothesis Testing
Data Preparation ProcessPrepare Preliminary Plan of Data AnalysisCheck QuestionnaireEditCodeTranscribeClean DataStatistically Adjust the DataSource: Malhotra, 2012Select Data Analysis Strategy
Questionnaire CheckingA questionnaire returned from the field may beunacceptable for several reasons. Parts of the questionnaire may beincomplete. The pattern of responses may indicate thatthe respondent did not understand or followthe instructions. One or more pages are missing. The questionnaire is received after thepreestablished cutoff date. The questionnaire is answered by someonewho does not qualify for participation.
EditingTreatment of Unsatisfactory Results Returning to the Field – The questionnaires withunsatisfactory responses may be returned to the field,where the interviewers recontact the respondents.Assigning Missing Values – If returning thequestionnaires to the field is not feasible, the editor mayassign missing values to unsatisfactory responses.Discarding Unsatisfactory Respondents – In thisapproach, the respondents with unsatisfactory responsesare simply discarded.
CodingData coding Coding the variables Coding the response/items for each variable Eg. Variable for gender sex Coding item 1 male, 2 female The numerical scale can be coded by using theactual number circled by the respondents(question 6 to 21) Random checks should be conducted to ensuredata are coded correctly
Table 12.1Coding of Serakan Co. Questionnaires1.Age (years)2. Education3. Job level4. Sex[1] Under 25[1] High school[1] Manager[1] M[2] 25-35[2] Some college[2] Supervisor[2] F[3] 36-45[3] Bachelor’s degree[3] Clerk5. Work shift[4] 46-55[4] Master’s degree[4] Secretary[1] First[5] Over 55[5] Doctoral degree[5] Technician[2] Second[6] Other (specify)[6] Other (specify)[3] Third5a.Employment Status[1] Part time[2] Full timeHere are some questions that ask you to tell us how you experience your work life in general.Please circle the appropriate number on the scales below.To what extent would you agree with the following statements, on a scale of 1 to 7, 1 denoting very low agreementdenoting very high agreement?6. The major happiness of my life comes from my job.1234567. Time at work flies by quickly.12345678. I live, eat and breathe my job.1234569. My work is fascinating.12345610. My work gives me a sense of accomplishment.12345611. My supervisor praises good work.12345612. The opportunities for advancement are very good here.12345613. My coworkers are very stimulating.12345614. People can live comfortably with their pay in this organization.12345615. I get a lot of cooperation at the workplace.12345616. My supervisor is not very capable.12345617. Most things in life are more important than work.12345618. Working here is a drag.12345619. The promotion policies here are very unfair.12345620. My pay is barely adequate to take care of my expenses.12345621. My work is not the most important part of my life.123456and 7777777777777777
Data TranscriptionFig. 14.4CATI/CAPIKeypunching viaCRT TerminalRaw DataOpticalRecognitionDigitalTech.Bar Code &OtherTechnologiesVerification: CorrectKeypunching ErrorsComputerMemoryDisksTranscribed DataOtherStorage
Data Cleaning Consistency ChecksConsistency checks identify data that are outof range, logically inconsistent, or have extremevalues. Computer packages like SPSS, SAS, EXCELand MINITAB can be programmed to identifyout-of-range values for each variable andprint out the respondent code, variable code,variable name, record number, columnnumber, and out-of-range value.Extreme values should be closely examined.
Data Cleaning Treatment of MissingResponses Substitute a Neutral Value – A neutral value, typically themean response to the variable, is substituted for the missingresponses. Substitute an Imputed Response – The respondents'pattern of responses to other questions are used to imputeor calculate a suitable response to the missing questions. In casewise deletion, cases, or respondents, with anymissing responses are discarded from the analysis. In pairwise deletion, instead of discarding all cases withany missing values, the researcher uses only the cases orrespondents with complete responses for each calculation.
Basic TermsLevels ofMeasurement NominalOrdinalIntervalRatio Key Terms VariableDimensionItemDefinition DictionaryOperationalVariables IndependentDependentModeratingMediating
Research Framework5 itemsManagement(Independent)5 items3 itemsAdvancement(Independent)4 itemsJob ry(Independent)Gender(Moderating)4 itemsWorkload(Independent)
ScaleNominalOrdinalIntervalRatioNumbersAssignedto RunnersFinish783Rank Orderof WinnersPerformanceRating on a0 to 10 ScaleTime toFinish, .19.615.214.113.4Source: Malhotra, 2007
What is Statistics – process of making senseof data Descriptive Stat – describe the basic featuresof data using tables, graphs, summary stats Inferential Stat – generalising from samples topopulations performing estimations, hypothesistests, determining relationships and makingpredictions
Descriptive Statistics Norminal data – frequencies, %, crosstabulation, mode, pie chart, bar chart Ordinal data - frequencies, %, cross tabulation,mode, median, pie chart, bar chart Interval & Ratio data – mean, variance, stddeviation, skewness, kurtosis, index number,histogram, box plot, stem and leaf plot
Inferential Statistics Statistical Techniques: Exploring differences between groups Exploring relationshipParametric – Data must be interval and thedistribution must be normalNonparametric – Data is categorical(norminal/ordinal) or interval butdistribution is not normal
Data analysis Basic objectives: Getting a feel for the data Testing the goodness of data Testing the hypotheses Feel for the data Checking for the central tendency and the dispersion If there is less variability, the questions could be notproperly worded Check for similar response for every questions Remember, if there is no variability in the data, then novariance can be explained
Data analysis It is always prudent to obtain: Frequency distributions for the demographic variables The mean, standard deviation, range and variance onthe other dependent and independent variables An inter-correlation matrix of the variables, regardlesswhether hypotheses are related to the these analyses. Ifthe correlation between two variables is high, say over.75, we should wonder whether they are really twodifferent concepts or we are measuring the sameconcepts.
Data analysis Testing goodness of data Reliability Cronbach’s alpha. The closer Cronbach’s alpha is to 1,the higher the internal consistency reliability Split-half reliability coefficient Stability measures include: Parallel from reliability Test-retest reliability Validity Criterion-related validity Convergent validity Discriminant validity
Choosing the TestDepends on: Data – Norminal or Interval/Ratio Data Samples – one/two/k-samples Purpose – Describing, Comparing twostatistics or Looking at relationship
A Classification of Univariate TechniquesUnivariate TechniquesNon-numeric DataMetric DataOne Sample* t test* Z testTwo or MoreSamplesIndependent* Two- Group test* Z test* One-WayANOVARelated* Pairedt testOne Sample*****Two or endent*****Chi-SquareMann-WhitneyMedianK-SK-W e: Malhotra, 2012
Univariate Analysis Univariate analysis is the simplest form of analyzingdata. “Uni” means “one”, so in other words your datahas only one variable. It doesn't deal with causes orrelationships (unlike regression) and it's major purposeis to describe; it takes data, summarizes that data andfinds patterns in the data. It explores each variable in a data set, separately. Itlooks at the range of values, as well as the centraltendency of the values. It describes the pattern ofresponse to the variable. It describes each variable on itsown.www.csulb.edu/./696uni.htm
A Classification of Multivariate TechniquesMultivariate TechniquesDependenceTechniqueOne DependentVariable* Cross-Tabulation* Analysis of Varianceand Covariance* Multiple Regression* 2-GroupDiscriminant/Logit* Conjoint AnalysisMore Than leInterdependence* Multivariate Analysis * Factor Analysisof Variance* Confirmatory* Canonical CorrelationFactor Analysis* Multiple DiscriminantAnalysis* Structural EquationModelingand Path AnalysisInterobjectSimilarity* Cluster Analysis* MultidimensionalScalingSource: Malhotra, 2012
Multivariate Analysis Multivariate Data Analysis refers to any statisticaltechnique used to analyze data that arises from morethan one variable. This essentially models reality whereeach situation, product, or decision involves more than asingle variable.
Steps Involved in Hypothesis TestingFormulate H0 and H1Select Appropriate TestChoose Level of SignificanceCollect Data and Calculate Test StatisticDetermine ProbabilityAssociated with TestStatistic (p value)Compare with Level ofSignificance, Determine Critical Value ofTest Statistic TSCRDetermine if TSCAL fallsinto (Non) RejectionRegionReject or Do not Reject H0Draw Research Conclusion
Hypothesis Testing – Hnull & Halternative A null hypothesis is a statement of the statusquo, one of no difference or no effect. If the nullhypothesis is not rejected, no changes will bemade. An alternative hypothesis is one in which somedifference or effect is expected. Accepting thealternative hypothesis will lead to changes inopinions or actions. The null hypothesis refers to a specified value ofthe population parameter (e.g., m , s , p ), not asample statistic (e.g., X ).
Hypothesis Testing – Hnull & Halternative A null hypothesis may be rejected, but itcan never be accepted based on a singletest. In classical hypothesis testing, there isno way to determine whether the nullhypothesis is true. The null hypothesis is formulated in such away that its rejection leads to the acceptanceof the desired conclusion. The alternativehypothesis represents the conclusion forwhich evidence is sought.H0: p 0. 40H1: p 0. 40
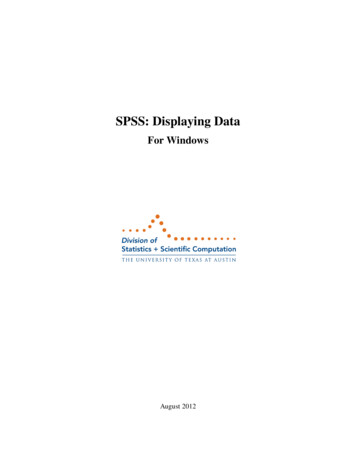
Hypothesis Testing – Hnull &Halternative The test of the null hypothesis is a one-tailedtest, because the alternative hypothesis isexpressed directionally. If that is not the case,then a two-tailed test would be required, andthe hypotheses would be expressed as:H 0: p 0 .4 0H1: p 0.40
One-Tailed & Two-Tailed Test
One-Tailed & Two-Tailed Test
Test Statistic The test statistic measures how close thesample has come to the null hypothesis. The test statistic often follows a well-knowndistribution, such as the normal, t, or chisquare distribution. In our example, the z statistic,which followsthe standard normal distribution, would beappropriate.p-pz spwheresp p (1 - p )n
Type I and Type II errorType I Error Type I error occurs when the sample results lead to therejection of the null hypothesis when it is in fact true.Type II Error Type II error occurs when, based on the sample results,the null hypothesis is not rejected when it is in fact false.
Descriptive Analysis
Frequencies - Command
Question:1. Is our sample representative?Frequencies2. Data entry rcent75.025.0100.0Valid Percent75.025.0100.0Cumulat iv ePercent75.0100.0Current PositionValidTechnicianEngineerSr EngineerManagerAbov e .116.73.1100.0Valid Percent17.734.428.116.73.1100.0Cumulat iv ePercent17.752.180.296.9100.0
Table in ReportGenderMaleFemalePositionTechnicianEngineerSr EngineerManagerAbove .734.428.116.73.1
Descriptives - Command
DescriptivesDescriptive StatisticsNMinimum MaximumStatisticStatisticStatisticMeanStd. isStd. ErrorStatisticStd. 9-.361.175-.328.349192Valid N (listwise)Question:1. Is there variation in our data?2. What is the level of the phenomenon we aremeasuring?
Table in ReportMeanStd.DeviationJob Satisfaction3.820.64Management3.810.65Work Load3.700.67Salary3.480.74Advancement4.060.58
Research Framework5 itemsManagement(Independent)H15 items3 itemsAdvancementH2Job Satisfaction(Independent)(Dependent)H34 itemsSalary(Independent)H44 itemsWorkload(Independent)
Factor Analysis (FA)- Command
Assumptions in FAQuestion:How valid is our instrument?KMO and Bartlett's TestKaiser-Meyer-Olkin Measure of Sampling Adequacy.Approx. Chi-SquareBartlett's Test of Sphericity.8903178.651df120Sig.000KMO should be 0.5Bartlett’s Test should besignificant ie; p 0.05
Measure of Sampling AdequacyMSAComment0.80 and aboveMeritorious0.70 – 0.80Middling0.60 – 0.70Mediocre0.50 – 0.60MiserableBelow 0.50Unacceptable
Assigning QuestionsCommunalitiesInitialRotated Component 2.897-.026-.032Extraction Method: Principal ction Method: Principal Component Analysis.Rotation Method: Varimax with Kaiser Normalization.a. Rotation converged in 6 iterations.Analysis. Amount of shared, or commonvariance, among the variables General guidelines all communnalitiesshould be above 0.5
Significant LoadingsFactor LoadingSample Size 60850.65700.70600.7550
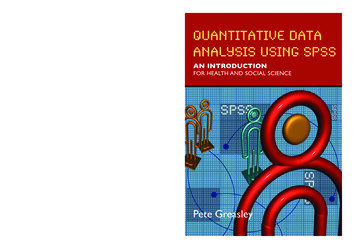
How many Factors?Total Variance ExplainedInitial EigenvaluesComponentExtraction Sums of SquaredRotation Sums of Squared LoadingsLoadingsTotal% ofCumulativeVariance%Total% ofCumulativeVariance%Total% 016.034.210100.000Extraction Method: Principal Component Analysis.
How many Factors? - Scree Plot
Reliability - Command
Question:How reliable are our instruments?Should bepreferably 0.3Reliability StatisticsCronbach'sN of ItemsAlpha.9775Item-Total StatisticsScale Mean ifScale VarianceCorrected Item-Cronbach'sItem Deletedif Item DeletedTotalAlpha if 5.256.555.935.970
Table in ReportVariableN of 0.919Intention5-0.966Actual3-0.9330.977
Computing New Variable Command
Data after Transformation
Inferential Analysis
Chi Square Test - Command
Question:Is level of sharing dependent on gender?CrosstabulationGender * Inten tion Level Cr osstabu lationGenderMaleFemaleTotalCount% wit hin Gender% wit hin I ntention Lev el% of TotalCount% wit hin Gender% wit hin I ntention Lev el% of TotalCount% wit hin Gender% wit hin I ntention Lev el% of TotalIntention Lev .0%192100.0%100.0%100.0%Chi-Squar e TestsPearson Chi-SquareContinuity CorrectionaLikelihood RatioFisher's Exact TestLinear-by -LinearAssociationN of Valid CasesValue8.934b7.70411.2748.888df1111Asy mp. Sig.(2-sided).003.006.001Exact Sig.(2-sided)Exact Sig.(1-sided).002.001.003192a. Computed only f or a 2x2 tableb. 0 cells (.0%) hav e expect ed count less than 5. The minimum expected count is 9.00.
T-test - Command
Question:Does intention to share vary by gender?t-test(2 Independent)Group 03.5750Std.Dev iation.60302.68619Std. ErrorMean.05025.09904Independent Samples TestLevene's Test f orEquality of VariancesFIntentionEqual variancesassumedEqual variancesnot assumed3.591Sig.060t-test for Equality of MeanstdfSig. (2-tailed)MeanDif f erenceStd. ErrorDif f erence95% ConfidenceInterv al of theDif f 352.92672.729.005.32500.11106.10364.54636
Paired t-test - Command
Question:Are there differences between intention tot-testshare and actual sharing behavior?(2 Dependent)Paired Samples 192St d.Dev iation.63877.58349St d. ErrorMean.04610.04211Paired Samples Correl ationsNPair 1Intention & Actual192Correlation.817Sig.000Paired Samples TestPaired Diff erencesPair 1Intention - ActualMean-.24375Std.Dev iation.37326Std. ErrorMean.0269495% ConfidenceInterv al of theDiff erenceLowerUpper-.29688-.19062t-9.049df191Sig. (2-tailed).000
One Way ANOVA - Command
Question:One way ANOVA(k independent)Does intention vary by position?ANOVAIntentionBetween GroupsWithin GroupsTotalSum ofSquares7.86470.06877.933df4187191Mean Square1.966.375F5.247Sig.001Intentio na,bDuncanCurrent PositionEngineerManagerTechnicianSr EngineerAbov e managerSig.N663234546Subset f or alpha .05123.64243.66253.89414.00004.5333.1011.000Means f or groups in homogeneous subsets are display ed.a. Uses Harmonic Mean Sample Size 19.157.b. The group sizes are unequal. The harmonic meanof the group sizes is used. Ty pe I error lev els arenot guaranteed.
Kruskal-Wallis - Command
Question:Does the variables vary by position?Kruskal-Wallis(k erSr EngineerManagerAbov e managerTotalN346654326192Mean Rank101.3279.68114.5481.63171.17Test Statistics a,bChi-SquaredfAsy mp. Sig.Intention28.1794.000a. Kruskal Wallis Testb. Grouping Variable: Posit ion
Correlation - Command
Question:Are the variables related?Correlation(Interval/ratio)Correlati onsAt tit udesubjectiv ePbcontrolIntentionActualPearson CorrelationSig. (2-tailed)NPearson CorrelationSig. (2-tailed)NPearson CorrelationSig. (2-tailed)NPearson CorrelationSig. (2-tailed)NPearson CorrelationSig. (2-tailed)NAt tit ude1subjectiv e 031.817**.000.000.665.000192192192192**. Correlation is signif icant at the 0.01 lev el (2-t .817**.0001921192
Table PresentationAttitudeAttitudesubjectivesubjective 059.805***p 0.05, **p 0.011
Regression - Command
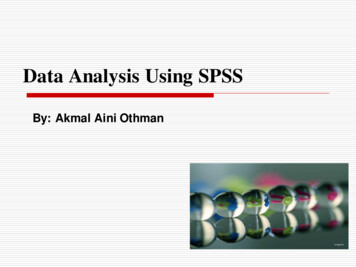
Question:Which variables can explain the intention toshare?MultipleRegressionVariabl es Entered/ Removed bModel1VariablesEnteredPbcontrol,subjective,aAt tit udeVariablesRemov ed.R square – how much ofthe variance in thedependent variable isexplained by the modelMethodEntera. All requested v ariables ent ered.b. Dependent Variable: Intent ionModel Summary bModel1RR Square.832a.693AdjustedR Square.688Std. Error ofthe Estimate.35703a. Predictors: (Constant), Pbcontrol, subjective, Attitudeb. Dependent Variable: IntentionDurbinWatson1.501
Multiple RegressionANOVAbModel1RegressionResidualTotalSum ofSquares53.96823.96477.933dfMean Square17.989.1273188191F141.127Sig.000aa. Predictors: (Constant), Pbcontrol, subjectiv e, Attitudeb. Dependent Variable: ectiv ePbcontrolUnstandardizedCoeff icientsBStd. Error.191.197.601.059.227.056.143.037a. Dependent Variable: IntentionStandardizedCoeff 3.000.000.000Collinearity StatisticsToleranceVIF.453.472.8772.2102.1161.140
Regression Equation
Thank youa2o@icqmail.com
Univariate Analysis Univariate analysis is the simplest form of analyzing data. "Uni" means "one", so in other words your data has only one variable. It doesn't deal with causes or relationships (unlike regression) and it's major purpose is to describe; it takes data, summarizes that data and finds patterns in the data.