Transcription
Developing Location Effects Using Cluster Analysis withResponse Surface AnalysisBY RICHARD WARDSeveral methods for quantifying theeffects of location on property values have been developed over the lastfew decades. Valuation models tend toovervalue some localities and undervalueothers. Therefore, most computer-assisted mass appraisal (CAMA) analysts andmass appraisal companies adjust modelresults for location by assigning differentadjustment factors to neighborhoods.These factors adjust values up or down forall parcels within a given neighborhoodto better equalize values at all locationsat some predetermined level, generallymarket value. These factors may be derived from the inverse of average salesratios within each neighborhood. Morerecent methods of accounting for theeffects of location analyze value changesspatially across all locations without regard to fixed neighborhood boundaries.This article describes how this can be accomplished by combining two differenttechniques—response surface analysis(RSA) and cluster analysis.History of RSA in CAMAIn the late 1970s before the widespreaduse of geographic information systems(GIS), Charles Cook (at that time withthe mass appraisal company, CBM) hadthe idea to create a system for neighborhood delineation using an index ofsimilarity among contiguous physicalblocks. The system analyzed severalphysical property characteristics andsales prices to determine which blockswere most alike and should thereforebe “joined” to other blocks to form aneighborhood.In the early 1980s, Cook, while atthe Lincoln Institute of Land Policy,developed the SOLIR (Small On-LineResearch) software that ran on earlypersonal computers. The SOLIR CAMAsystem was used by various jurisdictionsfor property data management and valuation modeling. The software assistedthe user in recognizing value influencecenters (VICs) and included algorithmsthat analyzed these VICs and adjustedRichard (Dick) Ward is a CAMA consultant based in Toledo, Ohio. He has worked in theassessment field since 1976 on projects in three jurisdictions within the United States and inseven other countries. He has developed and taught CAMA courses for the International Association of Assessing Officers (IAAO), the International Property Tax Institute (IPTI), andthe Urban and Regional Information Systems Association (URISA) and has made numerouspresentations on the subject for these and other organizations.Journal of Property Tax Assessment & Administration Volume 3, Issue 15
valuation models for the effects of theselocations. Among the early adopters ofthis software and the location analysistechnique were Patrick O’Connor andJerome German of the Lucas CountyAuditor’s Office in Toledo, Ohio.By the mid-1980s, both the softwareand location analysis were being employed in the earliest version of theCAMA modeling course developed forthe International Association of Assessing Officers (IAAO) under the directionof Dr. Joseph Eckert who was Directorof Education at the time. In addition toDr. Eckert, course developers includedPatrick O’Connor and Jerome Germanas well as this author.A few years later, Patrick O’Connor,then chief assessor in New York City,teamed with Jack Eichenbaum to significantly extend the understanding of theuse of location analysis for property valuation. In 1988, they described their workin an article in the Property Tax Journal.The next step in the evolution of location analysis techniques occurred in thelate 1990s when ESRI’s ArcView softwarewas introduced into the process by theLucas County Auditor’s Office. Jim Weaver, who had been hired as GIS Director,worked with the county’s CAMA team touse ArcView Spatial Analyst for analyzingthe effects of location on local propertyvalues. Their work was presented at the1997 IAAO annual conference in Toronto and was subsequently publishedin the Assessment Journal in 1999.Subsequently, Weaver used GS , asoftware package for response surfacemodeling created by Gamma DesignSoftware, to conduct location analysisduring the Lucas County reassessmentof 2000. In 2002, Jason Guilford, BrianJones, Debbie Pratt, Jerome German,and this author, in a follow-up to the1999 Assessment Journal article, explainedhow Lucas County was performinglocation analysis using ArcView SpatialAnalyst, the NCSS statistical system, andTableCurve 3-D, a modeling programdeveloped by Science Inc. Currently, the6Lucas County Research and Development (R&D) CAMA team uses ArcViewGeoStatistical Analyst exclusively forlocation analysis.Other leading practitioners have useda variety of software approaches to conduct location analysis. Patrick O’Connor,in his consulting practice, and MichaelIreland of the City of Bloomington (IL)Township among others used SOLIRor NCSS for location modeling duringthe 1990s. Now many of these sameexperts utilize ArcView extensions forthis purpose. Dr. Syed Rizvi working inSaskatchewan, Canada, and ThembaMusekiwa in Cape Town, South Africa,have studied extensively the GeoStatistical Analyst component of ESRI’s ArcViewGIS software suite. Dr. Rizvi’s work wasreported in an Assessment Journal articlein 2003.The idea to explore the possibilities ofcombining cluster analysis with responsesurface analysis was sparked by a conversation between Dr. Eckert and the authorin 2004. Dr. Eckert mentioned that oneof his clients in Kyrgyzstan, ValentinaSolodovnikova, was using cluster analysisalong with response surface modelingfor neighborhood delineation. (Basedon other consulting work in Russia,this author assumes the software usedwas NCSS, both for clustering and response surface analysis.) This work bySolodovnikova became the catalyst forthis further examination of how clusteranalysis might improve the use of or beintegrated with response surface analysisfor location modeling and/or neighborhood delineation.Approaches to Location ModelingWithin a given property type, severalCAMA models may be developed formultiple strata or one global or universal model may be applied to the entireinventory. Separate models may be developed for each neighborhood or groupof similar neighborhoods (stratified bygeography) or by clusters with similarproperty characteristics (cluster analysisJournal of Property Tax Assessment & Administration Volume 3, Issue 1
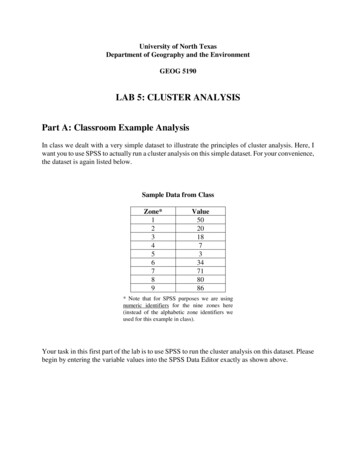
based on property features).If a global model is used, some formof location or “neighborhood” adjustment must be applied to the model toaccount for differences across space.Fixed neighborhoods may be adjustedby the inverse of the average sales ratioper neighborhood or may be assignedlinearized (scalar) values derived fromprior modeling or other sources. Themore efficient approach is responsesurface analysis.Inputs and Outputs of RSA forProperty Valuation ModelingThe use of RSA for location adjustmentswithin a property valuation modelassumes a global or universal (jurisdiction-wide) model. In RSA’s earliest form,adjustments were made to a modelbased on distances from VICs that werevisually identified from plots of sales ratios resulting from the application of aglobal model “without location.” Thesedistance measures were then input intothe model and calibrated along withother property features in the model.Resultant sales ratios were thereby improved since properties near high or lowvalue centers were adjusted up or downby the model.Later, with the development of trueGIS software, only geographic coordinates and sales information, which weregenerally transformed into a relativescore, were required for the locationanalysis component of the model. TheRSA technique generated an estimateof the effect of location according tothe sales information input. It was alsofound that physical property data, suchas age, building size, and quality of construction, could serve as indicators ofthe effect of location on value (see Wardet al. 2002, Guilford section), providedthe data varied systematically by location(i.e., was spatially auto-correlated).The estimated value surface can be“smoothed” within the software and mayalso be combined with other locationeffects or averaged by physical blocksand/or neighborhoods for an evensmoother surface. Sometimes, the technique includes adjustments to estimatesof value produced by regression modelsbased on the inverse of sales ratios, typically averaged by neighborhoods. Resultsof the RSA are input into a global modelfor re-calibration along with other property features. The surface must also beapplied to the inventory for subsequentglobal model application.Initially, sales prices for input in the response surface technique were convertedto a relative score by dividing each priceby the average price of the sales sample.Sales price per unit (e.g., square feetof living area) was found to be a bettermeasure than raw sales price. Both priceand price per unit may be used togetherif converted to a common denominator,such as standardizing with Z-scores. Inthis way, vacant and improved sales canbe combined into one score for use inthe analysis, inasmuch as vacant landsales are generally on a much differentscale than improved sales. Z-scores arecalculated by dividing the difference ofone sale price from the average of allprices by the standard deviation of theprices. Table 1 shows the calculationoptions in NCSS and table 2 shows thesame in SPSS. Note that division by 6 centers the final scores around 1.00 whichcauses an average location to have noadjustment. Scores above 1.00 will adjustvalues upward and those below 1.00 willlower the values.Inputs and Outputs of ClusterAnalysis for Property ValuationModelingThe Z-scores of price-per-square-footinformation are used along with X and Ycoordinates in the GIS software to generate a response surface of value and thenestimate those values at all X-Y points onthe surface. These estimated values aregenerally used as multipliers in valuationmodels to indicate the effect of locationJournal of Property Tax Assessment & Administration Volume 3, Issue 17
Table 1. Z-score calculations in NCSS* Standardize Sales Data in NCSSZSaleImp(Improved 1) * ((Sale-106407)/56321)ZSaleTla(Improved 1) * ((SaleTla-84.27)/31.42)ZSaleVac(Vacant 1) * ((Sale-25876)/21932)ZSaleLot(Vacant 1) * Zsalevac,Zsalelot,6))/6* Alternative Z-score computation method[Filter by Improved eTla)[Filter by Vacant t,6))/6Table 2. Z-score calculations in SPSS* Standardize Sales Data in SPSSIF(Improved 1)ZSaleImp (Sale-106407)/56321IF(Improved 1)ZSaleTla (SaleTla-84.27)/31.42IF(Vacant 1)ZSaleVac (Sale-25876)/21932IF(Vacant 1)ZSaleLot (SaleLot-1.29)/1.40Zscore * Alternative Z-score computation methodFILTERBY ImprovedDESCVAR SaleImp, SaleTlaFILTERBY VacantDESCVAR SaleVac, SaleLotCOMP/SAVE/SAVEZscore (SUM(Zsaleimp,Zsaletla,Zsalevac,Zsalelot,6))/6on property values. The same multipliers or estimated scores may be used asinputs to cluster analysis to assist in thedelineation of neighborhoods, therebyreducing the manual effort required forthis task. The resultant neighborhoods(“clusters”) can then be used in adjusting8models for the effects of location.Insofar as clusters for use in neighborhood analysis should logically bein relative proximity to one another, Xand Y coordinates are used as inputs tothe clustering along with the estimatedZ-scores derived from the RSA. TheseJournal of Property Tax Assessment & Administration Volume 3, Issue 1
three variables (X, Y, and Z) were used inthe NCSS “K-Means Clustering” module,as shown in figure 1, to assemble the respective clusters. The five clusters fromthis output were then displayed on a scatter plot for visual review and the resultindicated some overlap of clusters.K-Means Cluster Analysis (figure 2)was also used in SPSS as it was in NCSSto delineate clusters or neighborhoodsusing X, Y, and Z variables. The output,when plotted, greatly reduced the overlap of clusters. A review of the estimatedZ-scores in the output of cluster centersindicates which cluster is the lowest inoverall values and which is the highest.The RsaLoc of 1.11 is the highest-priced“neighborhood” and the RsaLoc of .76 isthe lowest priced, as shown in table 3.Table 4 indicates the distribution ofcases by cluster.Data and Software UsedFor the purpose of this study, RSA resultswere generated as inputs to cluster analysis for neighborhood delineation usingsingle residential property sales in threelocations: Prince Edward Island, Canada;Cape Town, South Africa; and eThikweni(Durban), South Africa. Non-residentialproperties were also analyzed in Durban.The software used included NCSS andSPSS for generating the inputs for RSAand for the subsequent cluster analysis.ArcGIS GeoStatistical Analyst was usedfor the response surface analysis.Examples using RSA andClusteringPrince Edward Island, CanadaThe two major towns, Charlottetown andSummerside, as well as the resort areasFigure 1. NCSS K-Means clustering moduleJournal of Property Tax Assessment & Administration Volume 3, Issue 19
especially along the north coast, are theprimary high-value residential areas onPrince Edward Island (PEI). The eastand west ends of PEI and the middleare typically lower-value areas. Figure 3shows the location surface which reflectsthe differences in values across the island. These values were used to developthe clusters shown in figure 4.The yellow and black clusters indicatethe lowest-priced areas of the province.The second to right cluster is somewhathigher priced and adjoins Charlottetown, the capital. The center clusterincludes the capital as well as the popularresort area made famous in the novel,Anne of Green Gables. The second to leftcluster includes the second largest town,Table 3. SPSS cluster centersTable 4. Cases per clusterFigure 2. K-Means cluster analysis in SPSS10Journal of Property Tax Assessment & Administration Volume 3, Issue 1
Figure 3. Market value pattern across Prince Edward IslandFigure 4. PEI cluster pattern from SPSS outputJournal of Property Tax Assessment & Administration Volume 3, Issue 111
Summerside, and the bridge to NovaScotia. These clusters properly reflectthe configuration of the various marketareas of the island.Cape Town, South AfricaIn the Cape Metro area, the highestvalue neighborhoods are those that areATM or “around the mountain,” thatis, around Table Mountain (figure 5).These are the neighborhoods locatedon the Atlantic seaboard, in the northern bowl-shaped area that contains thecentral business district and adjoiningresidential areas, and in the tree-linedresidential section east of the mountain.Many of these neighborhoods are similarsubmarket areas and may be combinedfor analysis and valuation modelingpurposes.The cluster analysis based on X-Y coordinates and RSA results indicate whichareas may effectively be combined forfurther analysis and modeling (figure6). In the figure, the thick black linesrepresent established neighborhoodboundaries, whereas the similarly coloreddots indicate the preferred realignmentof neighborhoods. For example, thenorthern neighborhoods on the eastside of the mountain would best becombined into one group as indicated bythe clustering. Likewise, the two southernmost neighborhoods on the east sidewhich are presently separated should beconfigured differently based on marketinformation. The extreme southeast partshould be its own neighborhood and themiddle portions should be combineddifferently than at present. Realigningneighborhoods according to this analysisof market data will improve the modeling results for the next revaluation.Durban, South AfricaIn a pilot study to determine the applicability of CAMA technology to the city’srevaluation needs, it was found that oneglobal residential model did not work assatisfactorily as three targeted models.Figure 5. Relative property values in Cape Town’s “Around the Mountain” areaNote: Values as represented on this map range from darkest red as the highest valueareas to darkest blue as the lowest value areas.12Journal of Property Tax Assessment & Administration Volume 3, Issue 1
Figure 6. Cluster analysis of “Around the Mountain” propertiesNote: Thick black lines represent established neighborhood boundaries, whereas areaswith the same color dots indicate the preferred realignment of neighborhoods.This conclusion was reached after clusteranalysis along with RSA identified threemajor RSA groups: high value, mediumvalue, and low cost areas (figure 7).Separate valuation models were thendeveloped and applied to the three respective areas or clusters. This achievedbetter results for overall valuations thanone global model did.It also became clear from the RSAbased cluster analysis that each clustercrossed many of the city’s “suburbs” orsubdivisions (figure 8). These were notpreviously categorized as “neighborhoods” in most cases but were simplyused for local value review. Based on thisanalysis, they can now be combined intolarger neighborhoods.In addition, the larger groupings ofhigh value, medium value, and low costcan each be further broken down intoseveral clusters, as illustrated by thedifferent clusters within low cost areasshown in figure 9.These groupings of residential property should prove useful for revaluations,both in market analysis and valuationmodeling, and in the final value review.Clusters were also developed for nonresidential properties (figure 10). Thesecan now serve as neighborhoods for future analysis and valuation modeling.Practical Applications of ClusterAnalysis with RSACombining cluster analysis with theresults of response surface analysis canassist in at least three areas of CAMAwork. First, it can be used to develop orrevise delineations of neighborhoods.Second, the clusters can be used as binary or linearized (scalar) variables alongwith the RSA location multiplier to adjustmodels for the influence of location onvalue. These two elements also can becombined into one location adjustmentin a model. The Lucas County R&D stafftypically uses a similar technique to ad-Journal of Property Tax Assessment & Administration Volume 3, Issue 113
Figure 7. Cluster analysis showing Durban’s three major value areasFigure 8. Detailed view of clusters spanning neighborhood areas14Journal of Property Tax Assessment & Administration Volume 3, Issue 1
Figure 9. Distinctive clusters identified within low-cost clusterFigure 10. Cluster analysis of non-residential properties in DurbanJournal of Property Tax Assessment & Administration Volume 3, Issue 115
just the RSA for all properties in the samephysical block. Finally, as the Durbinexample illustrates, cluster analysis withRSA can be used to delineate subsets of auniverse for separate model application.Durbin’s experience shows that resultscan be improved when models are applied in this way.Summary and ImplicationsCluster analysis was first tested in theearly years of CAMA valuation modeling but the results proved unacceptable.These early attempts failed because theanalysis was based solely on physical features of the respective properties whichresulted in properties in close proximityappearing in different clusters that therefore were subject to different models.The major difference in the techniquedescribed here is that the estimates of theeffect of location on value are combinedwith X and Y coordinates to delineatethe clusters. Properties should not onlyhave similar market prices to be in thesame neighborhood, but should also bein close proximity. The physical featuresof the properties as well as their location can thus be accounted for withinthe same model. It is important to notethat the location effects are smoothedestimates of those effects based on market data.This technique can be used with orwithout a true GIS since response surfaceanalysis is available in generic softwaresuch as NCSS and TableCurve 3D aswell as in GIS software such as ArcGISfrom ESRI.Annotated BibliographyFor those interested in exploring this topic in greater depth, the following readinglist, if read in order, will provide a shortcourse in the historical development oflocation analysis and the contributionsof the pioneers in the field.O’Connor, P.M., and Eichenbaum, J.1988. Location value response surfaces:The geometry of advanced mass apprais16al. Property Tax Journal 7(3):277–296.This article explores the various types ofcurves for use in response surface analysis. Although it predates most currentlyavailable software for location modeling,it does indicate which curves are appropriate in which situations.Eckert, J.K., ed. 1990. Property appraisaland assessment administration. Chicago:IAAO, 392–395.This IAAO textbook includes a briefdescription of RSA as developed onSOLIR software using value influencecenters and X-Y coordinates. Thisdiscussion is based on earlier presentations of the techniques as developed byCharles Cook and as utilized by PatrickO’Connor and Jerome German in LucasCounty, Ohio.Ward, R.D., Weaver, J.R., and German,J.C. 1999. Improving CAMA modelsusing geographic information systems/response surface analysis location factors. Assessment Journal 6(1):30–38.This article was developed from apresentation given at the 1997 IAAO annual conference in Toronto, which firstpublicized the technique of using ESRIsoftware for RSA. The article explainswhy including an explicit location variable in a valuation model is better thanusing delineated neighborhood adjustments. A comparison is made betweenRSA results using NCSS and ArcViewSpatial Analyst in the context of apartment market data.Ward, R.D. 2001. Demonstration ofCAMA in South Africa. Assessment Journal8(3):33–43.This article describes USAID-sponsoredprojects for demonstrating CAMA inrural and urban contexts. NCSS was usedfor location modeling with limited available data. A more detailed description ofthe projects is provided by the same author in: Demonstration of computer-assistedmass appraisal: Three pilot studies. 2002.Chapter 7 in Property taxes in South Africa,edited by M.E. Bell and J.H. Bowman.Journal of Property Tax Assessment & Administration Volume 3, Issue 1
Cambridge, MA: Lincoln Institute ofLand Policy. Various examples are givenof the use of RSA modeling in NCSS.Price, S. 2002. Surface interpolation ofapartment rental data: Can surfaces replace neighborhood mapping? AppraisalJournal 70(3):260–271.Spatial autocorrelation and one methodof surface interpolation, namely IDW(inverse distance weighting), is described in the context of apartment data.It explains the same methods discussedin the preceding articles but from theperspective of a fee appraiser.Ward, R., Guilford, J., Jones, B., Pratt, D.,and German, J.C. 2002. Piecing togetherlocation: Three studies by the LucasCounty research and development staff.Assessment Journal 9(5):15–48.This research was presented at the Integrating GIS and CAMA Conferencein 2002. The resulting article demonstrates how to use spatial analysis toolsto improve the equity of property valuation models. The first part by Guilforddescribes use of property data insteadof sales prices in developing a location-based response surface for use invaluation modeling. The second partby Jones describes the use of stages ofdevelopment in vacant land modelingand shows how RSA assists in this process.The last part by Pratt and Ward detailshow to develop RSA multipliers usingNCSS, TableCurve 3-D, and ArcViewSpatial Analyst (with descriptions ofboth IDW and Kriging methods). A comparison is made of results from the samevaluation model run under all describedmethods and software. This is the onlyarticle which offers a detailed “how–to”in the specific software.Ireland, M.W., and O’Connor, P.M. 2002.“Location analysis for commercial properties. Assessment Journal 9(6):21–26.This article explores the use of RSA inmodeling commercial vacant land salesin a small jurisdiction. Model results areanalyzed relative to the current assessedland values.Korbno, B.G., Rizvi, S., Ghebre, K., Merritt, G. 2003. Location adjustments foragricultural land using the geostatisticalcapabilities of a GIS. Assessment Journal10(4):34–43.This article describes research usingArcView Spatial Analyst and GeoStatistical Analyst for agricultural property inSaskatchewan, Canada. It includes a concise literature review of RSA research.The steps for developing location effectsin GeoStatistical Analyst are described interms of the IDW method.Journal of Property Tax Assessment & Administration Volume 3, Issue 117
18Journal of Property Tax Assessment & Administration Volume 3, Issue 1
Developing Location Effects Using Cluster Analysis with Response Surface Analysis BY RICHARD WARD Richard (Dick) Ward is a CAMA consultant based in Toledo, Ohio. He has worked in the . same in SPSS. Note that division by 6 cen-ters the final scores around 1.00 which causes an average location to have no adjustment. Scores above 1.00 will adjust