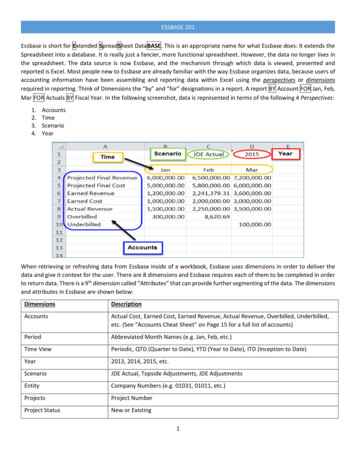
Transcription
Graphing CalculatorandSpreadsheet Masters
Glencoe/McGraw-HillCopyright by The McGraw-Hill Companies, Inc. All rights reserved.Printed in the United States of America. Permission is granted to reproduce thematerial contained herein on the condition that such material be reproduced onlyfor classroom use; be provided to students, teachers, and families without charge;and be used solely in conjunction with Glencoe Algebra 2. Any otherreproduction, for use or sale, is prohibited without prior written permission of thepublisher.Send all inquiries to:Glencoe/McGraw-Hill8787 Orion PlaceColumbus, OH 43240ISBN: 0-07-828020-6Glencoe Algebra 2Graphing Calculator and Spreadsheet Masters2 3 4 5 6 7 8 9 10 024 11 10 09 08 07 06 05 04 03
CONTENTSRESOURCE MATERIALSTI-83 Plus Graphing Calculator Template . 1Spreadsheet Template . 3TI-83 Plus Graphing Calculator HandbookIntroduction to the Graphing Calculator . 5Graphing Functions . 8Analyzing Functions.11Graphing Inequalities.16Matrices .19Graphing Trigonometric Functions .21Graphing Special Functions.22Statistics and Statistical Graphs .23GRAPHING CALCULATOR INVESTIGATIONSUse with 4-2TitlePageSolving Equations and Checking Solutions.27Transformations: Greatest Integer Function.29Linear Programming.31Matrices for 30 , 45 , and 60 Rotations .33Using Tables to Factor by Grouping.35Quadratic Inequalities and the Test Menu.37Rational Root Theorem .39Matrices and Equations of Circles.41Horizontal Asymptotes and Tables.43Regression Equation Lab .45Recursion and Iteration .47Probabilities.49Law of Sines: Ambiguous Case .51Sinusoidal Equations.53SPREADSHEET INVESTIGATIONSUse with 4-3TitlePageAbsolute Value Statements .28Using Linear Equations .30Break-Even Point .32Cramer’s Rule .34Appreciation and Depreciation .36Approximating the Real Zeros of Polynomials .38Operations on Functions .40Parabolas .42Variation .44Net Present Value .46Sequences and Series .48Permutations And Combinations.50Cofunctions .52Trigonometric Identities .54Answers .55iii
Teacher’s Guide to Using theGraphing Calculator andSpreadsheet MastersThis booklet contains a TI-83 Plus Graphing CalculatorHandbook, which summarizes many of the graphing calculatorskills students might use in pre-algebra. This is a referencetool and does not contain additional exercises for students.This booklet also includes a Graphing Calculator Investigationand a Spreadsheet Investigation for each chapter in GlencoeAlgebra 2. The graphing calculator activities are written with TI-83Plus keystrokes provided. If your students use anothercalculator, they will need to modify their keystrokes tocomplete the activity. The spreadsheet masters were developed for use withMicrosoft Excel. If you use a different spreadsheetapplication software, you may need to alter the commandsgiven in the activity.When to Use Each activity should be used as an extension ofthe lesson to which it is referenced. Because these activitiescan be done independently of classroom time, they may beused as extra credit or as enrichments for those students whohave completed their assignments in a timely manner.iv
Glencoe Division, Macmillan/McGraw-HillvGeometry
NAME DATEPERIODTI–83 Plus Graphing Calculator Template Glencoe/McGraw-Hill1Glencoe Algebra 2
NAME DATEPERIODSpreadsheet Template Glencoe/McGraw-Hill3Glencoe Algebra 2
NAME DATE1PERIODTI–83 Plus Graphing Calculator HandbookIntroduction to the Graphing CalculatorThis section introduces you to some commonly-used keys and menus ofthe calculator.SettingPreferencesMODEThe MODE key allows you to select your preferences in manyaspects of calculation and graphing. Many of these settings are rarelychanged in common usage. This screen shows the default mode settings. type of numeric notationnumber of decimal places in resultsunit of angle measure usedtype of graph (function, parametric, polar, sequence)whether to connect graphed points real, rectangular complex, or polar complex number system graph occupies full screen, top of screen withHOME screen below, or left side of screen with TABLE onrightTo change the preferences, use the arrow keys to highlight your choiceand press ENTER .FORMATThe FORMAT menu is the second function of ZOOM andsets preferences for the appearance of your graphing screen. The defaultscreen is shown below. rectangular or polar coordinate systemwhether to display the cursor coordinates on screenwhether to show a grid pattern on screenwhether to show the axeswhether to label the axeswhether to show the equation being graphedYou can change your preferences in the FORMAT menu in the sameway you change MODE settings.Using Menus Glencoe/McGraw-HillMany keys on the calculator access menus from which you can select afunction, command, or setting. Some keys access multiple menus. Youcan use the right and left arrow keys to scroll through the differentmenu names located at the top of the screen. As each menu name ishighlighted, the choices on the screen change. The screens on the nextpage show various menus accessed by using MATH .5Glencoe Algebra 2
Math menuNumber menuComplex Number menuProbability menuTo select a choice in a menu, either use the arrow keys to highlight yourchoice and press ENTER or simply press the number or letter of yourselection. Notice that entry 7 in the first screen has a down arrow insteadof a colon after the 7. This signifies there are more entries in the menu.AlternateFunction KeysAbove most keys are one or two additional labels representing commands,menus, letters, lists, or operational symbols. These are accessed by using2ndor ALPHA . 2nd accesses the commands on the left above the key. Note thatWhenever analternate functionthese commands and 2nd are the same color.is indicated in thekeystrokes of this ALPHA accesses the commands on the right above each key. Theseappendix, we willcommands and ALPHA are also the same color.use brackets to Pressing 2nd ALPHA engages the [A-LOCK] or Alpha Lock command.show that thefunction is listedThis enables you to select consecutive ALPHA commands without pressingabove a key.ALPHA before each command. This is especially useful when enteringprograms.Each letter accessed by using ALPHA can be used to enter words or labelson the screen, but can also be used as a variable. A value can be storedto each variable.ComputationA graphing calculator is also a scientific calculator. That is, it followsthe order of operations when evaluating entries. Unlike some scientificcalculators, the graphing calculator displays every entry in the expression.Before pressing ENTER to evaluate the expression, you can use the arrowkeys to scroll through the expression to make corrections. Correctionscan be made in three ways. UseDEL Use2ndto delete any unwanted entries.[INS] to insert omitted entries. “Type” over an incorrect entry. This overprints any entries and doesnot shift the entries to the right as a word processor does. Glencoe/McGraw-Hill6Glencoe Algebra 2
If you have an expression that you wish to evaluate repeatedly with achange in one part of the expression, you can press 2nd [ENTRY]after you have pressed ENTER and the expression will reappear. You canedit it for your next computation. The ENTRY command always repeatsthe last entered expression. You cannot scroll back through previousexpressions you have evaluated.Example2 4(6) 3 [5 ( 12)] 3.1 Evaluate 6Press:5The minus keyand the negativekey are differentkeys.[ ] 32nd12(–)——x23)4)(6 ) 6(ENTERNote that the square root function automaticallyincludes a left parenthesis. You must enter theright parenthesis to indicate the end of theexpression under the radical sign. If you havethe decimal in the Float mode, as many as 10digits may appear in the answer.2 Evaluate each expression if a 4, b 5, c 2, d 2 , and e 1.5.3e 4ab. 2 a. abc 3de4c 8bFor a series of expressions that use the same values for the variables, itis often helpful to store the value for each variable into the calculator.You can combine several commands in one line by using the colon aftereach command. The following commands save the values for variablesa, b, c, d and e.Press: 4[A] ALPHA [:]ALPHASTOALPHA[C] ALPHA [:] 2 3ALPHA[E]5(–)STOALPHASTOALPHA[B] ALPHA [:] 2[D] ALPHA [:](–)1.5STOSTOENTERa. Method 1: Using stored valuesALPHA[D][A] ALPHA [B] ALPHA [C]ALPHA[E]4—3 ALPHAENTERMethod 2: Entering computations4 1.5(–)54)2 —3 2 3 ((–)ENTERb. Method 1: Using stored values(ALPHAALPHA[C][E] 4 ALPHA [A]) 8 ALPHA [B])ENTERx2(Method 2: Entering computations(–)(8 Glencoe/McGraw-Hill 1.5 4(–)5) 4 )(2x2 ENTER7Glencoe Algebra 2
NAME DATE2PERIODTI–83 Plus Graphing Calculator HandbookGraphing FunctionsMost functions can be graphed by using the Y key. The viewingwindow most often used for non-trigonometric functions is the standardviewing window [ 10, 10] scl:1 by [ 10, 10] scl:1, which can be accessedby selecting 6:ZStandard on the ZOOM menu. Then the window can beadjusted so that a complete graph can be viewed. A complete graph isone that shows the basic characteristics of the parent graph.Example1 Linear Functionsy-intercepts.A complete linear graph shows the x- anda. Graph y 3x 4 in the standard viewing window.Press:Y 3—4ZOOM6If your calculator is already set for thestandard viewing window, press GRAPHinstead of ZOOM 6.Both the x- and y-intercepts of the lineargraph are viewable in this window, so thegraph is complete.[ 10, 10] scl:1 by [ 10, 10] scl:1b. Graph y 2(x 5) 2.Press:Y (–)2 5()—2GRAPHWhen this equation is graphed in the standard viewing window(Figure 1), a complete graph is not visible. The graph indicates thatthe y-intercept is less than 10. You can experiment with the Yminsetting or you can rewrite the equation in y mx b form, whichwould be y 2x 12. The y-intercept is 12, so Ymin should beless than 12. Remember that Xmax and Ymax can be less than 10so that your screen is less compressed. Use the WINDOW menu tochange the parameters, or settings, and press GRAPH to view theresult. There are many windows that will enable you to view thecomplete graph (Figure 2).Figure 1Figure 2[ 10, 10] scl:1 by [ 10, 10] scl:1[ 10, 10] scl:1 by [ 15, 5] scl:12 Quadratic Functions When graphing quadratic functions, acomplete graph includes the vertex of the parabola and enough of thegraph to determine if it opens upward or downward.(continued on the next page) Glencoe/McGraw-Hill8Glencoe Algebra 2
Graph y 4(x 3)2 4.Press:Y 4(—3) 4x2GRAPHWhile the standard viewing window shows acomplete graph, you may want to change theviewing window to see more of the graph.[ 10, 10] scl:1 by [ 10, 10] scl:1Example3 Polynomial Functions The graphs of other polynomial functionsare complete when their maxima, minima, and x-intercepts are visible.a. Graph y 5x3 4x2 2x 4.Press:Y 3 45 4x2—2GRAPHA complete graph is shown in the standardviewing window. You may want to redefineyour window to observe the intercepts,maximum, and minimum points more closely.[ 10, 10] scl:1 by [ 10, 10] scl:1b. Graph y x4 13x2 36.Press:4Y —13x2 36GRAPHThe standard viewing window (Figure 1) does not show a completegraph. It seems that only the y parameters need to be adjusted.Experiment to find a window that is suitable. Figure 2 shows asample.Figure 1Figure 2[ 10, 10] scl:1 by [ 10, 10] scl:1[ 10, 10] scl:1 by [ 8, 40] scl:24 Exponential Functions A complete graph of an exponentialfunction shows the curvature of the graph and the y-value that itapproaches.Graph y 92 x.Press:Y 9(2 )GRAPHNote that you must use parentheses to group theterms that make up the exponent.A complete graph seems to appear in the secondquadrant of the standard viewing window. Varythe WINDOW settings to view the graph moreclosely. Glencoe/McGraw-Hill9[ 7, 1] scl:1 by [ 1, 9] scl:1Glencoe Algebra 2
Example5 Logarithmic Functions A complete graph of a logarithmic functionshows the curvature of the graph and the values, or locations, of theasymptotes that the curve approaches.a. Graph y log (x 6).Press: 6LOGY )GRAPHAn entire graph appears in the standardviewing window, but is very small. Redefinethe WINDOW parameters for y, so that thegraph is more visible.[ 10, 10] scl:1 by [ 2, 2] scl:1b. Graph y log4 x.To graph a logarithmic function with a base other than 10, youmust first change the function by using the change of base formula,log x .loga x l og aPress:4)LOGY ) LOGGRAPHAn entire graph appears in the standardviewing window, but is very small. Redefinethe WINDOW parameters, so that the graphis more visible.[ 1, 5] scl:1 by [ 3, 3] scl:1You can graph multiple functions on a single screen. Each function isdenoted by Y1 , Y2 , Y3 , and so on, in the Y menu. To graph morethan one function, press ENTER at the end of each function you areentering and the cursor will move to the next function to be entered.Example6 Systems of EquationsGraph y 0.5x 4 and y 2x2 5x 1.Press:Y —0.55 4 1ENTER2x2GRAPHThe standard viewing window shows that theline and parabola intersect in two points. Glencoe/McGraw-Hill10[ 10, 10] scl:1 by [ 10, 10] scl:1Glencoe Algebra 2
NAME DATE3PERIODTI–83 Plus Graphing Calculator HandbookAnalyzing FunctionsIn addition to graphing a function, you can use other tools on a graphingcalculator to analyze functions. One of those tools is a function table.ExampleThe functionvalues are thedependentvariable values.1 How to Use a Table You may complete a table manually orautomatically. To create a table for one or more functions, you mustfirst enter each function into the Y list. Then set up and create thetable.a. Use a table to evaluate the function y 4x2 2x 7 for{ 9, 4, 0, 1, 5}.In this case you only need to evaluate the function for selectedvalues, so use the TBLSET menu to have the calculator ask for thevalues of the independent variable (domain) and find the functionvalue (range) automatically.Press:Y 472nd2ndENTER2[TBLSET][TABLE] (–) 90ENTER —x21ENTERENTERENTER5(–)4ENTERb. Use a table to evaluate the functions y 5x2 x 1 andy 6 x3 for the integers from 3 to 3, inclusive.When you want to evaluate a function for a range of values, have thecalculator find both the values of the independent variable and thefunction values automatically. In Table Setup, enter the initialnumber of the domain as the TblStart value and the incrementbetween the values of the independent variable as Tbl. Enteringmore than one function in the Y list allows you to evaluate all ofthe functions in one table.Press:Y 5x2—1 ENTER 6 —3[TBLSET] (–) 3 ENTER 1ENTER2nd [TABLE] 2ndENTEROnce you create a table, you can scrollthrough the values using the arrow keys. Glencoe/McGraw-Hill11Glencoe Algebra 2
ZOOMallows you to quickly adjust the viewing window of a graph indifferent ways. The effect of each choice on the ZOOM menu is shown onthe next page.1: ZBox2: Zoom In3: Zoom Out4: ZDecimal5: ZSquare6: ZStandard7: ZTrig8: ZInteger9: ZoomStat0: ZoomFitExample2 UsingAllows you to draw a box to define the viewing windowMagnifies the graph around the cursorViews more of a graph around the cursorSets X and Y to 0.1Sets equal-sized pixels on the x-and y-axesSets the standard viewing window, [ 10, 10] scl:1 by[ 10, 10] scl:14747πSets the built-in trig window, π, π scl: by [ 4, 4]24242scl:1 for radians or [ 352.5. 352.5] scl:90 by [ 4, 4] scl: 1for degreesSets integer values on both the x-and y-axesSets values for displaying all of the data in the currentstat listsFits Ymin and Ymax to show all function values for Xminto Xmaxto Graph in the Standard and Square WindowsZOOMGraph the circle with equation x2 y2 16 in the standardviewing window. Then use ZSquare to view the graph in asquare screen.First solve the equation for y in order to enter it into the Y list.x2 y2 16 y 16 x 2The two pieces of the graph can be entered at one time using { 1, 1}.This expression tells the calculator to graph 1 and 1 times thefunction.)Press: Y 2nd [ { ] (–) 1 , 1 2nd [ } ] 2nd [ ] 16 —x2ZOOM6The circle is distorted when viewed in thestandard viewing window.Press:ZOOM5[ 10, 10] scl:1 by [ 10, 10] scl:1Using ZSquare makes the circle appear asa circle.[ 15.16, 15.16] scl:1 by [ 10, 10] scl:1 Glencoe/McGraw-Hill12Glencoe Algebra 2
Example3 Using ZOOM to Zoom In and Out Graph y 0.5x3 3x2 12in the standard viewing. Zoom out to view a complete graph.Then zoom in to approximate the y-intercept of the graph tothe nearest whole number.Press:Y 0.53—3x2—12ZOOM6The complete graph is not shown in the standard viewing window.(Figure 1) When you zoom out or in, the calculator allows you to choosethe point around which it will zoom. Zooming out around the originonce allows a complete graph to be shown. (Figure 2)Press:ZOOM3ENTERFigure 1Figure 2[ 10, 10] scl:1 by [ 10, 10] scl:1[ 40, 40] scl:1 by [ 40, 40] scl:1Now zoom in to approximate they-intercept. Choose a point close to theintercept by using the arrow keys.Press:ZOOM2ENTERThe y-intercept appears to be about 12.Zooming in again may allow you to makea closer approximation.[ 10, 10] scl:1 by [ 24.19, 4.19] scl:1The TRACE feature allows you to move the cursor along a graph anddisplay the coordinates of the points on the graph.ExampleMake sure thatCoordOn ishighlighted in theFORMAT menuto display thecursor coordinatesas you trace.Graph y 4x 2 and y 3x2 x 5. Use the4 Using TRACETRACE feature to approximate the coordinates of theintersection of the graphs in the first quadrant. Then evaluatey 3x2 x 5 for x 1.7.Press:Y 4 2ENTER(–)3Move the cursor along the graphs usingx2andGlencoe/McGraw-HillTRACE.Pressing 2ndor 2ndmoves thecursor more quickly. If your cursor moves offof the screen, the calculator will automaticallyupdate the viewing window so that the cursoris visible. Useandto move from onefunction to the other. The intersection is atabout (0.4, 4).To evaluate a function for a value and move tothat point, place the cursor on the function graph.Then enter the value and press ENTER . Whenx 1.7, y 5.37 for y 3x2 x 5. 5—13[ 10, 10] scl:1 by [ 10, 10] scl:1Glencoe Algebra 2
Using TRACE to locate the intersection points of the graphs of twofunctions gives you an approximation of the coordinates. For more accuratecoordinates, you can use the intersect option on the CALC menu.Example5 Finding Intersection Points Use 5:intersection on the CALCmenu to find the coordinates of the intersection of the graphs ofy 4x 2 and y 3x2 x 5.If you do not have the functions graphed, enter the functions into theY list and press GRAPH . Then find the coordinates of the intersection.Press:The intersectionof the graphsmust appear onthe screen to findthe coordinateswhen usingintersect.2nd[CALC] 5Place the cursor on one graph and pressENTER . Then move the cursor to the othergraph and press ENTER . To guess at theintersection or enter an x-value and pressENTER . If there is more than one intersectionpoint, the caculator will find the one closestto your guess. The cursor will move to theintersection point and the coordinates willbe displayed.[ 10, 10] scl:1 by [ 10, 10] scl:1The CALC menu also allows you to find the zeros of a function.Example6 Finding ZerosPress:Y (–)2Find the zeros of f(x) 2x4 3x2 2x 5.4 3x2 2The calculator can find one zero at a time. Usethe arrow keys or enter a value to choose theleft bound for the interval in which thecalculator will search for the zero and pressENTER . Choose the right bound and pressENTER . Select a point near the zero using thearrow keys or by entering a value and pressENTER . Repeat with another interval to findthe other zero. The zeros of this function areabout 1.42 and 1.71. 52nd[CALC] 2[ 10, 10] scl:1 by [ 10, 10] scl:1Real-world application problems often require you to find the relativeminimum or maximum of a function. You can use 3:minimum or4:maximum features on the CALC menu of a graphing calculator tosolve these problems. Glencoe/McGraw-Hill14Glencoe Algebra 2
Example7 Finding Maxima and Minima Determine the relativeminimum and the relative maximum for the graph off(x) 4x3 6x 5.First graph the function.Press:Y 43—6 5To find the relative minimum pressZOOM2nd6[CALC] 3.Similar to finding a zero, choose the left andright bound of the interval and guess theminimum or the maximum. The point at about(0.71, 2.17) is a relative minimum.[ 10, 10] scl:1 by [ 10, 10] scl:1Use a similar method to find the relativemaximum, by pressing 2nd [CALC] 4. Thepoint at about ( 0.71, 7.83) is a relativemaximum.[ 10, 10] scl:1 by [ 10, 10] scl:1 Glencoe/McGraw-Hill15Glencoe Algebra 2
NAME DATE4PERIODTI–83 Plus Graphing Calculator HandbookGraphing InequalitiesMost linear and nonlinear inequalities can be graphed using the Y keyand selecting the appropriate graph style in the Y editor. To select theappropriate graph style, select the graph style icon in the first column of theY editor and press ENTER repeatedly to rotate through the graph styles. To shade the area above a graph, select the Above style icon,. To shade the area below a graph, select the Below style icon,.Before graphing an inequality, clear any functions in the Y list bypressing Y and then using the arrow keys and the CLEAR key to selectand clear all functions. If you do not wish to clear a function, you can turnthat particular graph off by using the arrow keys to position the cursorover that function’s sign and then pressing ENTER to change theselection status.Example1 Linear Inequalitiesa. Graph y 2x 3 in the standard viewing window.First enter the boundary equation y 2x 3 into the Y list.Press:Y 2—3Next, press thekey until the icon before flashes. Pressuntil the icon changes to the Below style icon, , for “y ”.Finally, if your calculator is not already set forthe standard viewing window, press ZOOM 6.Otherwise, press GRAPH .ENTER[ 10, 10] scl:1 by [ 10, 10] scl:1b. Graph y 4x 5 in the standard viewing window.Press:Y (–)4 5Next, press thekey until the icon before flashes.Then press ENTER until the icon changes tothe Above style icon, , since the inequalityasks for “y ”. Finally, press GRAPH .[ 10, 10] scl:1 by [ 10, 10] scl:1 Glencoe/McGraw-Hill16Glencoe Algebra 2
Example2 Nonlinear Inequalities The procedure for graphing nonlinearinequalities is the same as that of graphing linear inequalities.a. Graph y 0.25x2 4 in the standard viewingwindow.Press:Y 0.25—x24Next, select the Below style icon, , since theinequality asks for “y ”, and then pressGRAPH .[ 10, 10] scl:1 by [ 10, 10] scl:1b. Graph y 0.2x4 3x2 4.Press:Y 0.24—2 4Next, select the Above style icon, , sincethe inequality asks for “y ”. Then pressGRAPH .[ 10, 10] scl:1 by [ 10, 10] scl:1 2 4.c. Graph y x Press:2ndY 2[ ]) 4Next, select the Below style icon, , sincethe inequality asks for “y ”. Then pressGRAPH .[ 10, 10] scl:1 by [ 10, 10] scl:1d. Graph y 3x 5.Press:Y 3—5Next, select the Above style icon, , sincethe inequality asks for “y ”. Then pressGRAPH .[ 10, 10] scl:1 by [ 10, 10] scl:1 Glencoe/McGraw-Hill17Glencoe Algebra 2
Graphing systems of inequalities on a graphing calculator is similar tographing systems of equations.Example3 Graph the system of inequalities.y 2x 5y x2 4x 1Method 1: Shading Options in Y Press:Y 2—5—4 1ENTERx2Select the Above style icon, , for y 2x 5and the Below style icon, , for y x2 4x 1.Then press GRAPH .Notice that the first inequality is indicatedusing vertical lines and the second inequalityuses horizontal lines. The solution to the systemis shown by the intersection of the shaded areas.The Shade(command canonly be used withtwo inequalitieswhich can bewritten with “y ”in one inequalityand “y ” in theother.[ 10, 10] scl:1 by [ 10, 10] scl:1Method 2: Using the Shade CommandSome systems of inequalities can be graphed by using the Shade(command and entering a function for a lower boundary and a functionfor the upper boundary of the inequality. The calculator first graphsboth functions and then shades above the first function entered andbelow the second function entered.Before graphing an inequality using the Shade( command, clear anygraphics from the viewing window by pressing 2nd [DRAW] 1 ENTER .Also clear any equations in the Y list. If not already there, return tothe home screen by pressing 2nd [QUIT].Press:2ndx2—[DRAW] 7 24 1—)5 ,ENTER[ 10, 10] scl:1 by [ 10, 10] scl:1 Glencoe/McGraw-Hill18Glencoe Algebra 2
NAME DATE5PERIODTI–83 Plus Graphing Calculator HandbookMatricesA graphing calculator can perform operations with matrices. It can alsofind determinants and inverses of matrices. The MATRX menus areaccessed using 2nd [MATRX].There are three menus in the MATRX menu. The NAMES menu lists the matrix locations available. There are tenmatrix variables, [A] through [J]. The MATH menu lists the matrix functions available. The EDIT menu allows you to define matrices.A matrix with dimension 2 3 indicates a matrix with 2 rows and 3columns. Depending on available memory, a matrix may have up to 99rows or columns.Example1 2Entering a Matrix Enter matrix A 1 3. 2To enter a matrix into your calculator, choose the EDIT menu andselect the matrix name. Then enter the dimensions and elements of thematrix.Press:[MATRX]2 ENTER 1 ENTER 3ENTER2ndENTER22ENTERENTER( ) 2Press 2nd [QUIT] to return to the HOMEscreen. Then press 2nd [MATRX] ENTERENTER to display the matrix.You can find the determinant and inverse of a matrix very quickly witha graphing calculator.Example2Determinant and Inverse of a Matrixa. Find the determinant of matrix A.Press:2nd1[MATRX]12nd[MATRX]ENTERThe determinant of matrix A is 8.b. Find the inverse of matrix A.Press:A 1 Glencoe/McGraw-Hill2nd 0.250.25[MATRX] 1 x –10.375 0.125ENTER 19Glencoe Algebra 2
Example3 Operations with MatricesEnter matrix B 24 6. Then perform each operation.53 812a. BFirst, enter matrix R5ENTERENTERENTER[QUIT]2nd12Then find B.Press: .51 B 2[MATRX] 22nd 12ENTER 1.5 432.5b. ABPress:2nd2AB [MATRX] 12nd[MATRX]ENTER 212214 4 212c. A2Press:A2 2nd[MATRX] 1x2ENTER 310 27 d. AB BPress:2nd[MATRX] 12 AB B Glencoe/McGraw-Hill 1602nd2nd[MATRX] 2 1814[MATRX]ENTER 27720Glencoe Algebra 2
NAME DATE6PERIODTI–83 Plus Graphing Calculator HandbookGraphing Trigonometric FunctionsTrigonometric functions and the inverses of trigonometric functions canbe graphed using Y . The functions and their inverses can be graphedin degrees or radians. You must set the calculator in Radian or Degreemode. The standard viewing window for trigonometric functions can beset by pressing ZOOM 7:Trig, which automatically adjusts the x- andy-axes scales for degrees or radians.Example1a. Using DegreesGraph y cos x.First, set the calculator in degree modeENTER .by pressing MODENow enter and graph the function. Press)Y COSZOOM 7.[ 352.5, 352.5] scl:90 by [ 4, 4] scl:1b. Using RadiansGraph y sin x.Change to radian mode by pressingENTER. PressY CLEARMODEto deletethe function entered in part a. Then press)SINto enter the new function.Nex
Graphing Calculator and Spreadsheet Masters This booklet contains a TI-83 Plus Graphing Calculator Handbook, which summarizes many of the graphing calculator skills students might use in pre-algebra. This is a reference tool and does not contain additional exercises for students. This booklet also includes a Graphing Calculator Investigation