Transcription
Cluster AnalysisPresented by: Amelia Caldwell & Catherine CihaCleveland State UniversityCOM 731 Spring 2014Table of Contents:I. Modelp. 1-4II. Running SPSSp. 5-20III. SPSS Outputp. 21-33IV. Tabling Resultsp. 34V. Write-upp. 35 -37VI. Appendix Decision Tools
I. ModelData Set: National Community Study 2006 conducted by CATII. Internal Variables/Clustering Variables (11 total):Q61 through Q71 All questions have the following measurement categories (5-0, 9 where 5 is severaland 0 is never on scale and 9 indicates missing data):5- Several times a day;4- About once a day;3- Several times a week;2- About once a week;1- Less often than that;0- Have never gone on Internet;9- Missing dataFrequency of Internet use overallQ61. Today, people use the internet and other communication technologies to keep up with theircommunities and for a host of other reasons.Have you ever gone on the Internet? If said yes, remaining questions follow. 0 never gone InternetIf yes, how often do you go on the Internet at home or at work?Website content/specific useQ62. How often do you visit websites representing larger community or metro area where you live?Q63. How about a website representing your immediate neighborhood or community?Q64. Media websites such as one of the TV networks, a newspaper site or radio site?Q65. Websites of businesses or companies?Q66. Entertainment websites such as those for movies, games, hobbies, etc.?Q67. Websites of public or non-profit organizations?Q68. Websites in other countries, outside the United States?Q69. Sports websites?Q70. Websites in other languages?Email useQ71. How often do you use email?Page 1
II. External Variables/Profiling Variables (9 total):Q1. First, which of the following best describes where you live?1- in a central city neighborhood of a metropolitan area;2- in a near-by suburb or a metro area;3- in a more distant suburb of a metro area;4- in a fair-sized city outside a metro area;5-in a small town outside a metro area, or;6- in the country;7-otherQ2. How long have you lived there?1- less than a year;2- from 1 to 5 years;3- 6 to 10 years;4- 11 to 20 years;5- 21 to 30 years;6- 31 to 40 years;7- 41 to 50 years;8- more than 50 years;9- missing informationQ97. I enjoy learning about other peoples and cultures0-0 Completely disagree1-12-23-34-45- Neutral6-67-78-89-910-10 Completely agree99- Missing data/Don’t knowQ98. I think of myself as a citizen of the world.0-0 Completely disagree1-12-23-34-45- Neutral6-67-78-89-910-10 Completely agree99- Missing data/Don’t knowRecoded Q.97 and Q.98 compute variable “Cosmopolitaness” Cosmo ZQ97 Zq98Page 2
Q103. Marital -never been married;9-missing informationRecoded as nominal variable Q.103Dummy “Marriedness” where 1 1 and 0 all othersQ104. Age1- 18-20;2- 21-30;3- 31-40;4- 41-50;5- 51-60;6- 61-70;7-71 or older;9-Declines to answerQ105. How much formal education have you completed?1-completed grade school (8 years or less);2-some high school;3-high school graduate;4-some college;5-college graduate;6-advanced college degree;9-Missing informationRecoded as nominal variable Q.105Dummy “Post High school Education” where 1 4-6 & 0 1-3Q106. What is your ethnic or racial background?1-Black/African erican Indian;6-Mixed;7-Other;9-Missing information/Refused)Recoded as nominal variable Q.106 Dummy “Whiteness” where 1 2 (white) and 0 all othersPage 3
Q107. Annual household income1- 10,000 or less;2- 10,001 to 20,000;3- 20,001 to 30,000;4- 30,001 to 40,000;5- 40,001 to 50,000;6- 50,001 to 75,000;7- 75,001 to 100,000;8- 100,001 to 150,000;9- more than 150,000;99-missing information/don't know/refused)Recoded into nominal variable Q107Dummy “Above Median Income” where median income 1,below median 0. 1 responses include 6,7,8,9 and 0 responses 1,2,3,4,5Q107 source http://www.census.gov/prod/2007pubs/acs-08.pdf 48,451Q109. And, just for the record, are you male or female?1-male;2-femaleRecoded as nominal variable Q.109Dummy “Femaleness” where 1 2 (female) and 0 1 (male)Page 4
II. Running SPSSAnalyze Classify Hierarchical ClusterPage 5
Select your Internal Variables for analysis(Q. 61, 62, 63,64,65,66,67,68,69, 70, 71)Page 6
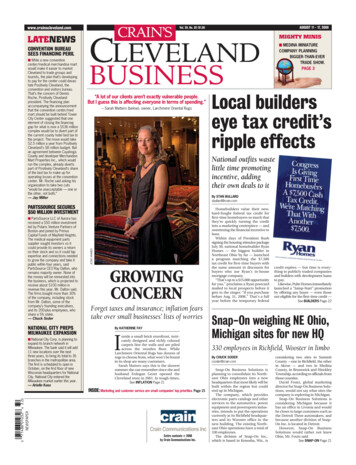
Click “Statistics” Box Make sure that the “Agglomeration Schedule” boxis checked. Then, under Cluster Membership, check the circle“Range of Solutions”. Indicate your minimum number of clusters and themaximum number of clusters. (3 to 6 or 4 to 7 is common)Then click “Continue”.Page 7
Click “Plots” Box Note that you must select either the “Dendrogram”box or something under “Icicle”. We ran Icicle, AllClusters. SPSS forces you to proceed, though you arenot required to report for five stats assignment.Then click “Continue”.Page 8
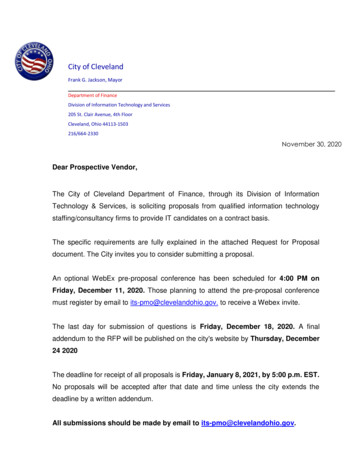
Click “Method” Box From “Cluster Method” drop down arrow Select“Ward’s Method”Page 9
Under “Measure”, select “Interval” circle. From drop down arrow select “Squared EuclideanDistance”Then click “Continue”.Page 10
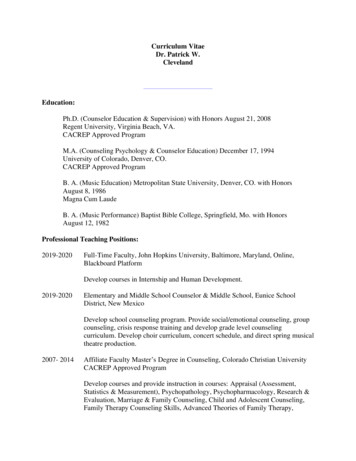
Click “Save” Box Under “Cluster Membership” select the circle“Range of Solutions”. Type 3 into “Minimum numberof clusters” box and type 6 into “Maximum number ofclusters” box.Then click “Continue”.Page 11
Click “OK” BoxNote: This point marks the end of the actual Cluster procedure in SPSS asindicated by our Syntax below. The Hierarchical Cluster Analysis procedurehas produced an Agglomerative Schedule and a Cluster MembershipTable in SPSS output. This procedure has also created and saved at the endof the dataset new nominal variables. In our specific example a 3-clustervariable, a 4-cluster variable, a 5-cluster variable, and a 6-cluster variable.GETFILE 'E:\Spring 2014\COM 731\Cluster Analysis\SPSS\Community Civic Project Class041014 Dataset with clusters post dr n.sav'.DATASET NAME DataSet1 WINDOW FRONT.CLUSTERq61 q62 q63 q64 q65 q66 q67 q68 q69 q70 q71/METHOD WARD/MEASURE SEUCLID/PRINT SCHEDULE CLUSTER(3,6)/PLOT VICICLE/SAVE CLUSTER(3,6).Page 12
Further Frequencies and ANOVA analysis procedureswill help decide which cluster solution to ultimatelyselect.Now we examine the cluster groupings.Analyze Descriptive Statistics FrequenciesPage 13
Select the cluster variables. This are the newlycreated variables that will be at bottom of SPSS list.“Ward Method [Clus6 1]” (Note we changed name inlabel to Ward Method 6 Cluster so easier to identifydistinctions in SPSS output charts)“Ward Method [Clus5 1]” (Note we changed name inlabel to Ward Method 5 Cluster so easier to identifydistinctions in SPSS output charts)“Ward Method [Clus4 1]” (Note we changed name inlabel to Ward Method 4 Cluster so easier to identifydistinctions in SPSS output charts)“Ward Method [Clus3 1]” (Note we changed name inlabel to Ward Method 3 Cluster so easier to identifydistinctions in SPSS output charts)Page 14
Click “OK” BoxPage 15
Run Means (with ANOVA tests) to compare meansamong the clusters.Analyze Compare Means MeansPage 16
Select the 11 total Internal Variables and enter intothe “Dependent List”Q.61-71 for our example. Also select the 9 total External Variables and enterinto the “Dependent List.”Q1, Q2, Q104ComputeCosmo (scale composed of standardized Q97and Q98)And the following dummied variables:Marriedness, PostHighSchoolEducation, Whiteness,MedianIncome Above, Femaleness.Page 17
20 Total variables were entered in our “Dependent List” Select “Ward Method 4 Cluster” and enter into“Independent List”Page 18
Click “Options” Box Check “ANOVA table and eta” Then click “Continue”Page 19
Click “OK” to compare meansNote: You can re-run by changing out the “IndependentList” to “Ward Method 6”, “Ward Method 5” and“Ward Method 3” to see ANOVA means comparisonbased upon various cluster numbers.Page 20
III. Running SPSSCluster Analysis OutputNOTE: Original SPSS Output is 60 pages. Version included in this packet has been reformatted andredacted for presentation clarity.GETFILE 'E:\Spring 2014\COM 731\Cluster Analysis\Community Civic Project Class Unchanged Data from website 040314.sav'.DATASET NAME DataSet1 WINDOW FRONT.CLUSTER q61 q62 q63 q64 q65 q66 q67 q68 q69 q70 q71/METHOD WARD/MEASURE SEUCLID/PRINT SCHEDULE CLUSTER(3,6)/PLOT DENDROGRAM VICICLE/SAVE CLUSTER(3,6).RECODE q103 (1 1) (ELSE 0) INTO Q103Dummy.VARIABLE LABELS Q103Dummy 'Marriedness'.EXECUTE.RECODE q105 (4 thru 6 1) (1 thru 3 0) INTO Q105Dummy.VARIABLE LABELS Q105Dummy 'PostHighSchoolEducation'.EXECUTE.SAVE OUTFILE 'E:\Spring 2014\COM 731\Cluster Analysis\SPSS\Community Civic Project Class 041014 ' 'Dataset with clusters post dr n.sav'/COMPRESSED.RECODE q106 (2 1) (ELSE 0) INTO Q106Dummy.VARIABLE LABELS Q106Dummy 'Whiteness'.EXECUTE.DATASET ACTIVATE DataSet1.SAVE OUTFILE 'E:\Spring 2014\COM 731\Cluster Analysis\SPSS\Community Civic Project Class 041014 ' 'Dataset with clusters post dr n.sav'/COMPRESSED.RECODE q107 (1 thru 5 0) (6 thru 9 1) INTO Q107RecodeMedianIncome2007.VARIABLE LABELS Q107RecodeMedianIncome2007 'Median Income Above'.EXECUTE.DATASET ACTIVATE DataSet1.SAVE OUTFILE 'E:\Spring 2014\COM 731\Cluster Analysis\SPSS\Community Civic Project Class 041014 ' 'Dataset with clusters post dr n.sav'/COMPRESSED.RECODE q109 (2 1) (ELSE 0) INTO Q109Dummy.VARIABLE LABELS Q109Dummy 'Femaleness'.EXECUTE.Page 21
Cluster[DataSet1] E:\Spring 2014\COM 731\Cluster Analysis\SPSS\Community Civic Project Class 041014Dataset with clusters post dr n.savCase Processing 18137.9a. Squared Euclidean Distance usedb. Ward LinkageTotalN477Percent100.0Page 22
Ward LinkageAgglomeration Schedule (NOTE: Total of 9 pages output created in SPSS, only first & last included here)Cluster CombinedStage Cluster First AppearsStageCluster 1Cluster 2CoefficientsCluster 1Cluster 2Next 041.5000074Page 23
28528729028453289294Page 2842882902922892932902892942912922942952950
Cluster Membership (NOTE: Total of 8 pages of output created in SPSS, only first included 686970717274757677786 Clusters5 41653243334113334 41553243334113333 4122324333411333Page 3333311333
(NOTE: Vertical Icicle Chart does not print legibly due to its size. View Icicle chart directly in SPSS output)FREQUENCIES VARIABLES CLU6 1 CLU5 1 CLU4 1 CLU3 1/ORDER ANALYSIS.Frequencies[DataSet1] E:\Spring 2014\COM 731\Cluster Analysis\SPSS\Community Civic Project Class 041014Dataset with clusters post dr n.savStatisticsNWard Method 6Ward Method 5Ward Method 4Ward Method ing181181181181Page 26
Frequency TablesWard Method 6 2.137.9100.0Valid t31.849.357.477.792.9100.0Ward Method 5 .9100.0Valid .849.357.477.7100.0Ward Method 4 0Valid .679.7100.0Ward Method 3 1884296181477Percent19.724.717.662.137.9100.0Valid Percent31.839.928.4100.0Page 27CumulativePercent31.871.6100.0
MEANS TABLES q61 q62 q63 q64 q65 q66 q67 q68 q69 q70 q71 q1 q2 Cosmo Q103Dummy q104 Q105Dummy Q106DummyQ107RecodeMedianIncome2007 Q109Dummy BY CLU4 1/CELLS MEAN COUNT STDDEV/STATISTICS ANOVA.(NOTE: We ran means counts ANOVA for CLU6 1, CLU5 1, CLU4 1, and CLU3 1 but are only showing the SPSS Output for CLU4 1 for this classpresentation handout as we ultimately went with a 4 Cluster Group.)Means Using 4 Cluster Groups[DataSet1] E:\Spring 2014\COM 731\Cluster Analysis\SPSS\Community Civic Project Class 041014 Dataset with clusters post dr n.savCase Processing SummaryQ61:Freq go on Internet at home,work * Ward Method 4 ClusterQ62:Freq visit metro, communitywebsite * Ward Method 4 ClusterQ63:Freq visit neigh website * WardMethod 4 ClusterQ64:Freq visit media websites *Ward Method 4 ClusterQ65:Freq visit business websites *Ward Method 4 ClusterQ66:Freq visit entertainmentwebsites * Ward Method 4 ClusterQ67:Freq visit public,non-profitwebsites * Ward Method 4 ClusterQ68:Freq visit websites outside U.S.* Ward Method 4 ClusterQ69:Freq visit sports websites *Ward Method 4 ClusterQ70:Freq visit websites in otherlanguages * Ward Method 4 ClusterQ71:Freq used email * WardMethod 4 ClusterQ1:Where live * Ward Method 4ClusterQ2:Time lived there * Ward Method4 ClusterCOMPUTE Cosmo Zq97 Zq98(COMPUTE) * Ward Method 4ClusterMarriedness * Ward Method 4ClusterQl04:Age * Ward Method 4 ClusterPostHighSchoolEducation * WardMethod 4 ClusterWhiteness * Ward Method 4 ClusterMedian Income Above * WardMethod 4 ClusterFemaleness * Ward Method 77100.0%Page 28
Ward Method 4 Cluster1234TotalMeanNStd. DeviationMeanNStd. DeviationMeanNStd. DeviationMeanNStd. DeviationMeanNStd. DeviationReportQ61:Freq go onQ62:Freq visitInternet at home, metro, 573.641.542962961.6801.175Q63:Freq visitneigh 29296.976ReportWard Method 4 Cluster1234TotalMeanNStd. DeviationMeanNStd. DeviationMeanNStd. DeviationMeanNStd. DeviationMeanNStd. DeviationQ64:Freq visitQ65:Freq visitmedia websites business 2962961.5121.602Page 29Q66:Freq 0024.0001.3260.5371.952961.465
Ward Method 4 Cluster1234TotalWard Method 4 Cluster1234TotalMeanNStd. DeviationMeanNStd. DeviationMeanNStd. DeviationMeanNStd. DeviationMeanNStd. DeviationReportQ67:Freq visitQ68:Freq visitpublic,non-profit websites 871.571.222962961.216.930Q69:Freq visitsports .582961.260MeanNStd. DeviationMeanNStd. DeviationMeanNStd. DeviationMeanNStd. DeviationMeanNStd. DeviationReportQ70:Freq visitwebsites in .1811.10296.777Q1:Where .462901.811Q71:Freq 3.412961.816Page 30
ReportWard Method 4 Cluster1234TotalWard Method 4 Cluster1234TotalMeanNStd. DeviationMeanNStd. DeviationMeanNStd. DeviationMeanNStd. DeviationMeanNStd. DeviationMeanNStd. DeviationMeanNStd. DeviationMeanNStd. DeviationMeanNStd. DeviationMeanNStd. DeviationCOMPUTEQ2:Time livedCosmo Zq97 365296.44128Page n 50066
Q61:Freq go on Internet athome, work * Ward Method 4ClusterQ62:Freq visit metro,community website * WardMethod 4 ClusterQ63:Freq visit neigh website *Ward Method 4 ClusterQ64:Freq visit media websites *Ward Method 4 ClusterQ65:Freq visit businesswebsites * Ward Method 4ClusterQ66:Freq visit entertainmentwebsites * Ward Method 4ClusterQ67:Freq visit public,non-profitwebsites * Ward Method 4ClusterQ68:Freq visit websites outsideU.S. * Ward Method 4 ClusterQ69:Freq visit sports websites *Ward Method 4 ClusterQ70:Freq visit websites in otherlanguages * Ward Method 4ClusterQ71:Freq used email * WardMethod 4 ClusterQ1:Where live * Ward Method 4ClusterQ2:Time lived there * WardMethod 4 ClusterCOMPUTE Cosmo Zq97 Zq98 (COMPUTE) * WardMethod 4 ClusterMarriedness * Ward Method 4ClusterQl04:Age * Ward Method 4ClusterPostHighSchoolEducation *Ward Method 4 ClusterWhiteness * Ward Method 4ClusterMedian Income Above * WardMethod 4 ClusterFemaleness * Ward Method 4ClusterBetween GroupsWithin GroupsTotalBetween GroupsWithin GroupsTotalBetween GroupsWithin GroupsTotalBetween GroupsWithin GroupsTotalBetween GroupsWithin GroupsTotalBetween GroupsWithin GroupsTotalBetween GroupsWithin GroupsTotalBetween GroupsWithin GroupsTotalBetween GroupsWithin GroupsTotalBetween GroupsWithin GroupsTotalBetween GroupsWithin GroupsTotalBetween GroupsWithin GroupsTotalBetween GroupsWithin GroupsTotalBetween GroupsWithin GroupsTotalBetween GroupsWithin GroupsTotalBetween GroupsWithin GroupsTotalBetwee
The Hierarchical Cluster Analysis procedure has produced an Agglomerative Schedule and a Cluster Membership Table in SPSS output. This procedure has also created and saved at the end of the dataset new nominal variables. In our specific example a 3-cluster variable, a 4-cluster variable, a 5-cluster