Transcription
Fourth Quarter 2018 Earnings CallFebruary 28, 2019
DAN JABLONSKYPresident and CEO, Maxar2
What we will cover today 2018 financial results Update on leverage, liquidity and cash flows Resolution of the go-forward plan for our GEO Comsat business Our new operating model: leaner, better able to serve customers and unlock the value in ourcombined businesses Expected synergies and cost-outs resulting from these changes An update on WV-4 and how we are proceeding to serve customers A high level view of our strategy evolution and outlook for the future3
SummaryTaking ActionCEO ObservationsBusiness StrengthsCapital Structure Imagery: Solid underlying demand across bothgovernment and commercial markets Covenants: Negotiated amendment to credit agreementcreating more headroom Services: Robust demand, low capital intensity, marginexpansion opportunities Dividend: Reduced dividend to 0.01 saving 60Mannually MDA Canada: Solid franchises and continuedopportunities for profitable growth Asset sales: Land sale in Palo Alto ( 70M); continue toright-size portfolio & asset baseOpportunity for ImprovementStrengthening the business Leverage: Too high; committed to deleveraging overtime Revised Operating Model: One Maxar with lean andagile organizational structure SSL: Retaining GEO Comsat business in the portfolio;right-sizing to drive profit and cash flow improvements Cost Reductions: Reduce cost structure to offset WV-4loss and improve profit outlook Running the business: better operational executionand focus on profit / cash growth Invest in the future: WV-4 replacement capacity andservices products to meet demand and drive growth4
In 45 days we have: Commenced review of alternatives to deleverage the balance sheet and fix the capitalstructure; Reduced the dividend to US 0.01, to preserve cash; Addressed GEO Comsat with a clear focus for the future: continue to operate on a smallerscale, re-engineer the business to focus on competitive advantage in the 500kg and 1300kgbus lines; Stopped RSGS, which would not be a good use of capital in 2019; Initiated full recovery against the loss of WV-4, replaced much of that capacity near term;potentially accelerating WV Legion for longer term replacement; Significantly restructured operating model to be leaner and more nimble, including almost 60 million in annual cost-out in 2019; and Evolved our strategy to best leverage our core business and unique assets.5
Guiding Principles1. We will pursue our purpose, which is to help our customers build a better world.2. We are going to work to drive sustainable growth across our businesses.3. We will seek to pay down our debt over time.4. We will aim to expand our returns on invested capital each and every year.5. We will work to create a leading edge, collaborative work environment that allows our teammembers to do the best, most challenging, and exciting work of their careers.6
We have resolved the near-term outlook for financing, leverage, cashflows and covenants and have ample liquidity to fund our plan Received approval from our lenders to amend our credit agreement to provide additionalfinancial flexibility with regard to our consolidated debt leverage ratio. Reduced dividend from CAD 0.37 to US 0.01 per share providing an additional 60 millionin annual cash flow. Sold a portion of our real estate in Palo Alto with proceeds totaling 70 million, applied to paydown debt. We are focused on all levers to drive cash flow and pay down debt.7
We have reached resolution on the GEO Comsat business:the value of the business is worth more to us than anyone else We will continue to operate the GEO Comsat product line on a smaller scale as part of astreamlined facility to drive improved profitability and cash flow. We will: Continue to execute on our backlog with the high level of performance customersexpect; Accelerate growth in new markets, particularly U.S. Government, focused on1300kg and 500kg bus products; and Maintain the right footprint and infrastructure to execute on both backlog and new orders,while repositioning the facility for the next wave of state-of-the-art satellites andconstellations.8
Changing our operating model to be leaner, better able toserve customers and unlock the value of combined businesses Revised operating model moves faster to achieve customers’ objectives and delivers thesolutions they need Restructured the business and leadership team from four business units to one operatingcompany with a separate Canadian business with the following benefits: Strengthen key customer relationships Unlock growth opportunities Increase speed of execution Improve employee engagement and retention Achieve further synergies and cost reduction Moving to a single brand, Maxar, while maintaining the MDA logo and its linkage to Maxar topreserve our Canadian identity Changes already in effect; new teams already moving forward to implement plans9
Expect synergies and 60- 70 million in annual cost-outs fromthese changes We expect to deliver approximately 60M in cost reductions in 2019, 70M annualizedsavings. Includes approximately 4% reduction in workforce. Is in addition to our previously announced post-merger synergy target of run rate 60M to 120M by the end of the fourth quarter of 2019.10
Progress on serving WV-4 customers and insurance recovery WV-4 is insured for 183 million and we have initiated the claim process for the full amount. We have identified actions to replace the imagery collected by WV-4 and meet as much ofthe customer commitments as possible, until we have WV Legion in place. Our investment in WV Legion, is underway, with an expected launch of early 2021, orpossibly late 2020. This next generation constellation will replace the capacity of WV1 and WV2 and providenext generation technologies and a configuration that can be used to address current andexpected demand from our customers.11
We have evolved our strategy to support priorities andleverage strengths We are evolving our strategy to achieve our goals: Intensifying our focus on improving capital allocation and capital structure; Stabilizing the business with the goal of driving profitable growth; and Changing our operating model with the aim of unlocking capabilities and technologiesacross our business. Our strategy leverages Maxar’s unique capabilities: Deep customer intimacy with USG, Canadian government and ID&I; Leading-edge talent; A commercial mindset; Unrivaled product quality, which goes hand-in-hand with the use of AI to unlock value inour content; Industry-leading satellite manufacturing capability with track-record of on-orbit successand ability to expand into the USG market; and Worldwide / regional salesforces.12
Imagery Backlog: 1.2B Unfunded Backlog: 900M Major Programs: EnhancedView Global-EGD Roughly a dozen DAFs 400 commercial customers Major Pipeline Pursuits: Legion X Additional DAFs Dozens of commercial customersacross a multitude of industries Defense programsSatelliteImagery Native 30cm resolution imagery Advanced multispectral capabilities including short-waveinfrared (SWIR) 18-year, 100 petabyte image archiveAnalytics Scalable cloud-based environment Machine learning and computer vision algorithms Multiple content sources, including DigitalGlobe, Landsat,RADARSAT-2 SARInformationProducts Advanced Elevation Suite Building Footprints Telco GeodataSubscriptionAccess EarthWatch SecureWatch Spatial on Demand13
Services Backlog: 246M Unfunded Backlog: 100M Major Programs: SBIR Phase III AI & PredictiveAnalytics Classified Intel Mission Support Classified Space ISR Mission NGA Janus Geography GEOINT Major Pipeline Pursuits: Classified DoD Predictive Analytics Classified GEOINT DataProcessing Army Remote Ground TerminalProgram DHS and International DefenseGEOINT ProductionSensor & GroundModernization Sensor Modeling & Systems Engineering & PrototypingConstellation Modeling & Mission ManagementTactical Remote Ground TerminalsGEOINT Processing, Cataloging, Discovery & AccessData toInsight Sensor Data EnrichmentLand ClassificationPersistent Change DetectionAutomated Feature Extraction & Object DetectionFoundational GEOINT ProductionAgileIntelligence Interactive Mission PlanningGeospatial Data VisualizationPredictive AnalyticsAdvanced Tradecraft and Agile Intelligence14
Space Systems Total Backlog: 935M GEO Comsat Backlog: 525M (8 satellites) Noteworthy non-GEO Comsat programs: Restore-L OneWeb Legion ISS Robotics Psyche Major Pipeline Pursuits: Canadian Surface Combatant Legion X Telesat LEO GEO Dragon Fly Classified Programs Task orders on SSPEDI Ovzon Power Propulsion Element (PPE) for DeepSpace Gateway Canadarm 3 for Lunar GatewayCommunicationsSatellites GEO, MEO and LEO satellites 100 – 1300 kgRemote SensingSatellites Earth Observation Signals TrackingRadarSatellitesSatellite GroundStationsRoboticsSatelliteComponents &PayloadsDefenseSystems15 Satellites Radar Imagery Services Earth Observation ground stations Optical and Radar Imagery Robotic manipulators Rovers Visual sensor systems Merchant antenna and components Engineering design and production Complex systems engineering, development and support ISR, EW, Command & Control, Communications
Summary – Key Focus Items Serving customers Growing business Reducing costs Paying down debt Allocating capital in a disciplined fashion16
BIGGS PORTERCFO, Maxar17
Key items of note Move to the United States Effective January 1, 2019 Canadian shares exchanged for US company shares Move to US GAAP Reconciliations from IFRS to US GAAP can be found in supplemental document foundon the Maxar website Revised definition of Adjusted EBITDA Reconciliation from prior presentation in IFRS to revised presentation in US GAAP canbe found in supplemental document found on Maxar website18
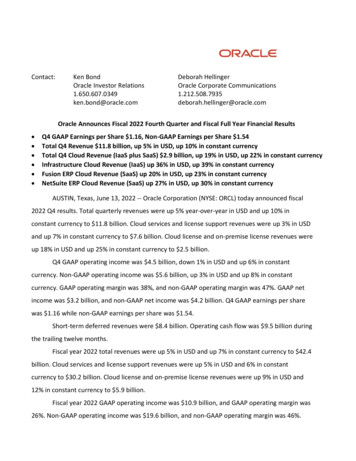
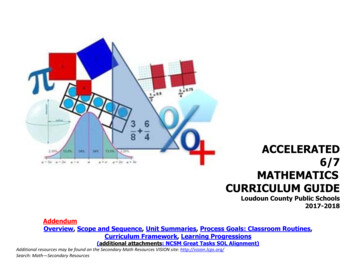
Q4 financial results Revenue down 9% y/y Driven by growth in Imagery and Services offset bydeclines in Space Systems Pro forma revenue declined 10% driven by SpaceSystems offset by growth in Imagery and Services4Q Rev. (in millions) and Adj. EBITDA1 Margin 600 545 496 500 400 Adj.Margins down 400bps y/y Driven by lower Space Systems volumes, EACadjustments and LDs Adjusted segment EBITDA margins of 20.4% on anIFRS basis vs. 34.7% in 2017 driven in large part bySpace SystemsEBITDA121%-9%17% 300 2004Q1714Q18See supplemental financial information found on the company’s website www.maxar.comfor a definition and reconciliation of these non-GAAP financial metrics. US GAAP EPS of ( 16.10) vs. 0.99 in 4Q17 Goodwill impairment: ( 636M) WV-4 Loss: ( 162M) Various SSL-related impairments: ( 116M) Gain on sale of Palo Alto real estate: 33M19
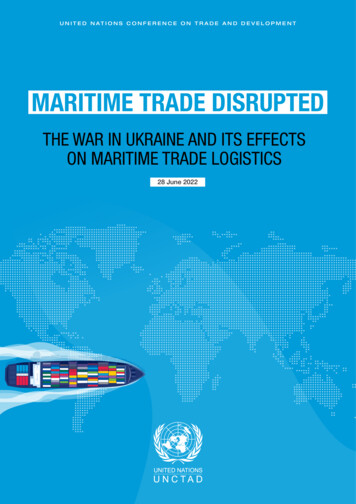
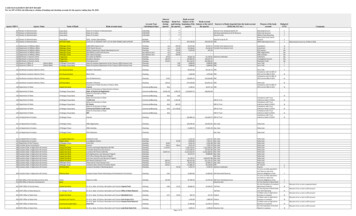
2018 financial results Revenue 31% y/y Driven by the acquisition of DigitalGlobe Pro forma revenue declined 7% driven by Space Systemsoffset by growth in Imagery and Services2018 Rev. (in millions) and Adj. EBITDA1 Margin 2,500 2,141 2,000 1,631Adj. EBITDA1 margins up 700bps y/y Driven by DigitalGlobe acquisition offset by lower SpaceSystems margins Adjusted segment margins of 29.7% on an IFRS basis vs.guidance of 32% driven largely by pressure in SpaceSystems 1,500 1,00022%15% 500 -US GAAP EPS of ( 21.76) vs. 1.41 in 2017 Goodwill impairment: ( 636M) WV-4 Loss: ( 162M) Various SSL-related impairments: ( 331M) Gain on sale of Palo Alto real estate: 33M Adj. EPS of 3.47 on an IFRS basis vs. guidance of 4.05 to 4.10YTD 171YTD 18See supplemental financial information found on the company’s website www.maxar.comfor a definition and reconciliation of these non-GAAP financial metrics.Book-to-bill of 1.0x for year Including unfunded bookings for contracts such as the EVFOprogram that extends to 202320
Imagery – Q4 results 4Q Revenue growth driven US Government Full-year pro forma revenue growth of 5% vs.guidance of 6%Q4 Rev. (in millions) & Adj. EBITDA1 Margin 250 200 4Q Adjusted EBITDA1 margins down y/y driven by mix andhigher overhead Full year margins of 63.4% on an IFRS basis vs.guidance of 64% 200 213 15063.5% 10057.3% 50 EnhanceView Follow-On (EVFO) through 2023 4Q17 International Defense & Intelligence opportunity pipelineremains robust4Q182018 Revenue (in millions) and Adj. EBTIDA1 Margins Noteworthy product and contract announcements: Completed continent wide mapping Mission for PMSAAustralia Ecopia-Tech Corp & DigitalGlobe produce first highprecision US building footprints dataset Vodafone partnership with DigitalGlobe to Create IoTPrecision Agriculture Product Expanded NASA partnership with new sole-sourcecontract21 845 800 600 400 230 20062.2%61.3%YTD 17YTD 18 -1See supplemental financial information found on the company’s website www.maxar.comfor a definition and reconciliation of these non-GAAP financial metrics.
Space Systems – Q4 resultsQ4 Rev. (in millions) & Adj. EBITDA1 Margin Revenue driven by higher costs, lower GEO and RCMrevenue, partially offset by increases in Small Sat, USGovernment and MDA Canada revenue Full year pro forma revenue down 11% vs. guidanceof down 9% 400 350 300 250 200 292 2436.5% 150 4Q Adj. EBITDA1 margins driven by lower volumes, EACadjustments, and liquidated damages (LDs) Full year margins of 7.6% on an IFRS basis vs.guidance of 12% given performance at SSL 100 50(11.9%) 4Q17 2018 SSL: 821M in Revenue and ( 80M) in EBITDA4Q182018 Revenue (in millions) and Adj. EBTIDA1 Margins Noteworthy product and contract announcements: On-Orbit servicing & space exploration PSN launch Two earth observation satellites shipped to belaunched Selected by CSA to design Lunar Rover Concept Canadian Surface Combatant program progressing RCM satellites shipped; launch expect in 1H19 1,500 1,270 1,250 1,000 1,12911.9% 750 500 2500.4% YTD 171YTD 18See supplemental financial information found on the company’s website www.maxar.comfor a definition and reconciliation of these non-GAAP financial metrics.22
Services – Q4 resultsQ4 Rev. (in millions) & Adj. EBITDA Margin1 Revenue driven by growth in new contract awards andexpansion of programs with DOD and the Intel Community Full year pro forma revenue increased 2% vs.guidance of up 4% 80 70 63 68 60 5015.9% 408.8% 30 Adjusteddriven by mix toward cost-plusprograms in the quarter vs. product / production Full year margins of 11% on an IFRS basis vs.guidance of 12% given mix in 4QEBITDA Margins1 20 10 4Q17 Product development effort for International andCommercial markets continues; now in beta phase4Q182018 Revenue (in millions) and Adj. EBTIDA Margins1 300 266 250 New and/or follow-on awards: NGA contract award for SBIR Phase III program DARPA award to for next-generation optical telescopesystem for small satellite constellations 200 150 100 14416.0%9.4% 50 YTD 17YTD 18See supplemental financial information found on the company’s website www.maxar.comfor a definition and reconciliation of these non-GAAP financial metrics.123
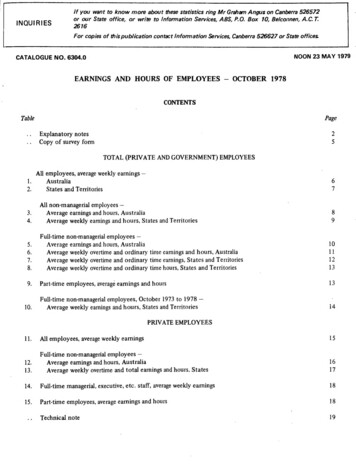
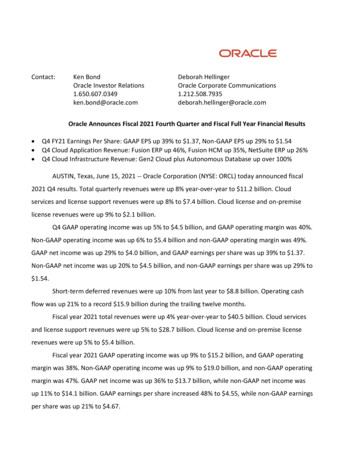
Cash flows 2018 Cash from operations on a GAAP basis of 139M2018 Adj. Operation Cash Flow / CapEx andCapitalized Development1 2018 Adjusted Operating Cash Flow (OCF) on an IFRSbasis of 281M vs. guidance of 300M to 400M Government shutdown caused a delay in payments Payments have since been received Adj. OCF would have fallen inside guidance rangewith prompt government payments 400 300 281 200 100 (100) (200) (300) (291) (400) 2018 Capital Expenditures Purchase / Development ofIntangibles on a GAAP basis of 218MAdj. OCFCap Ex & Cap DevelopmentSee supplemental financial information found on the company’s website www.maxar.comfor a definition and reconciliation of these non-GAAP financial metrics.1 2018 Capital Expenditures under IFRS of 291M vs.guidance of 300M to 325M SSL consumed roughly 95M in free cash flow in 201824
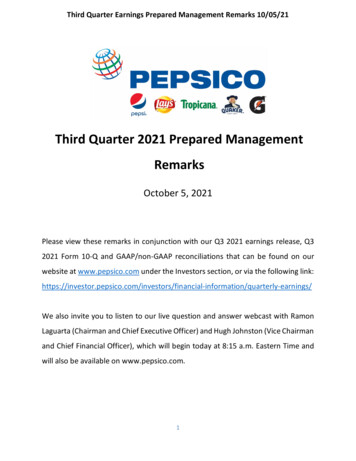
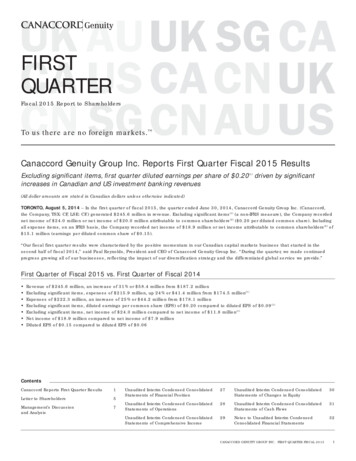
Liquidity and Debt Liquidity: Cash on Hand: 35M Revolver: 637M Total: 672MNet Debt ( M) 3,300 3,200 3,057 3,100 3,000 Net debt down q/q 3,112 3,116 3,040 2,976 2,900 2,800 Leverage ratio of 4.2x well below covenantrestrictions of 6.0x 2,700 2,600 2,500 Maturity schedule: Oct. 2020: 250M Term Loan A Oct. 2021: 250M Term Loan A Revolver( 595M drawn as of 12/31/18) Oct. 2024: 1.9B4Q17 Debt Rating: B1 / BB-251Q182Q183Q184Q18
Financial outlook – 2019Imagery, Services, and MDAnet of corporate expenses 550M in Adjusted EBITDA1SSLImproved EBITDA but higher cashusage given timing of milestones andrestructuringOther Noteworthy ItemsDepreciation and Amortization: 410MInterest Expense: 210MTax Rate: 0%Share Count: 61MAmortization on Purchased IntangiblesIn millionsCapExHigher CapEx as Legion programreaches peak spend2019 2342020 2032021 1452022 1182023 Thereafter 47 353Amortization of acquired intangible assets is based on the period over which the Company expects toreceive benefit from those assets. Assets are generally amortized on a straight -line basis.Debt Covenant Add BacksConversion from US GAAP to IFRS several add backs allowed for undercredit agreementEnhanced View Deferred Revenue / Imputed InterestIn millions2019 120Leverage Ratio for DebtCovenant Purposes 6.0x2020 802021 0Revenue is reported in the Imagery segment and relates to the Enhanced View contract signed in 2010 thatexpires in August 2020. There are no material costs associated with this revenue.1See supplemental financial information found on the company’s website www.maxar.comfor a definition and reconciliation of these non-GAAP financial metrics.26
Caution concerning forward looking statementsThis presentation and associated earnings release, conference call and webcast, which includes a business update, discussion of the financial results as ofand for the year ended December 31, 2018, and question and answer session (collectively, the “Earnings Information”), contain certain “forward-lookingstatements” or “forward-looking information” under applicable securities laws. Forward-looking terms such as “may,” “will,” “could,” “should,” “would,” “plan,”“potential,” “intend,” “anticipate,” “project,” “target,” “believe,” “plan,” “outlook,” “estimate” or “expect” and other words, terms and phrases of similar nature areoften intended to identify forward-looking statements, although not all forward-looking statements contain these identifying words.Forward-looking statements are based on certain key expectations and assumptions made by the Company. Although management of the Company believesthat the expectations and assumptions on which such forward-looking statements are based are reasonable, undue reliance should not be placed on theforward-looking statements because the Company can give no assurance that they will prove to be correct. Any such forward-looking statements are subject toa number of risks and uncertainties that could cause actual results and expectations to differ materially from the anticipated results or expectations expressedin this Earnings Information. The Company cautions readers that should certain risks or uncertainties materialize, or should underlying assumptions proveincorrect, actual results may vary significantly from those expected.The risks that could cause actual results to differ materially from current expectations include, but are not limited to those set forth in Part I, Item 1A, “RiskFactors” in our Annual Report on Form 10-K which is available online under the Company’s EDGAR profile at www.sec.gov or on the Company ’s website atwww.maxar.com, as well as the Company’s continuous disclosure materials filed from time to time with Canadian securities regulatory authorities, which areavailable online under the Company’s SEDAR profile at www.sedar.com or on the Company’s website at www.maxar.com. The risk factors detailed in theforegoing are not intended to be exhaustive and there may be other key risks that are not listed above that are not presently known to the Company or that theCompany currently deems immaterial.The forward-looking statements contained in this Earnings Information are expressly qualified in their entirety by the foregoing cautionary statements. All suchforward-looking statements are based upon data available as of the date of this Earnings Information or other specified date and speak only as of such date.The Company disclaims any intention or obligation to update or revise any forward-looking statements herein as a result of new information, future events orotherwise, other than as may be required under applicable securities law.27
Non-IFRS and non-GAAP measure disclosureSee supplemental financial information found on the company’s website www.maxar.com for adefinition and reconciliation of the non-GAAP financial metrics found in this presentation.28
Thank You29
adjustments and LDs Adjusted segment EBITDA margins of 20.4% on an IFRS basis vs. 34.7% in 2017 driven in large part by Space Systems US GAAP EPS of ( 16.10) vs. 0.99 in 4Q17 Goodwill impairment: ( 636M) WV-4 Loss: ( 162M) Various SSL-related impairments: ( 116M) Gain on sale of Palo Alto real estate: 33M 545 496 0 0 0 0 0