Transcription
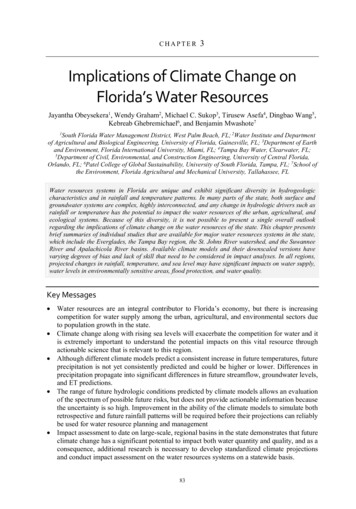
CHAPTER3Implications of Climate Change onFlorida’s Water ResourcesJayantha Obeysekera1, Wendy Graham2, Michael C. Sukop3, Tirusew Asefa4, Dingbao Wang5,Kebreab Ghebremichael6, and Benjamin Mwashote71SouthFlorida Water Management District, West Palm Beach, FL; 2Water Institute and Departmentof Agricultural and Biological Engineering, University of Florida, Gainesville, FL; 3Department of Earthand Environment, Florida International University, Miami, FL; 4Tampa Bay Water, Clearwater, FL;5Department of Civil, Environmental, and Construction Engineering, University of Central Florida,Orlando, FL; 6Patel College of Global Sustainability, University of South Florida, Tampa, FL; 7School ofthe Environment, Florida Agricultural and Mechanical University, Tallahassee, FLWater resources systems in Florida are unique and exhibit significant diversity in hydrogeologiccharacteristics and in rainfall and temperature patterns. In many parts of the state, both surface andgroundwater systems are complex, highly interconnected, and any change in hydrologic drivers such asrainfall or temperature has the potential to impact the water resources of the urban, agricultural, andecological systems. Because of this diversity, it is not possible to present a single overall outlookregarding the implications of climate change on the water resources of the state. This chapter presentsbrief summaries of individual studies that are available for major water resources systems in the state,which include the Everglades, the Tampa Bay region, the St. Johns River watershed, and the SuwanneeRiver and Apalachicola River basins. Available climate models and their downscaled versions havevarying degrees of bias and lack of skill that need to be considered in impact analyses. In all regions,projected changes in rainfall, temperature, and sea level may have significant impacts on water supply,water levels in environmentally sensitive areas, flood protection, and water quality.Key Messages Water resources are an integral contributor to Florida’s economy, but there is increasingcompetition for water supply among the urban, agricultural, and environmental sectors dueto population growth in the state. Climate change along with rising sea levels will exacerbate the competition for water and itis extremely important to understand the potential impacts on this vital resource throughactionable science that is relevant to this region. Although different climate models predict a consistent increase in future temperatures, futureprecipitation is not yet consistently predicted and could be higher or lower. Differences inprecipitation propagate into significant differences in future streamflow, groundwater levels,and ET predictions. The range of future hydrologic conditions predicted by climate models allows an evaluationof the spectrum of possible future risks, but does not provide actionable information becausethe uncertainty is so high. Improvement in the ability of the climate models to simulate bothretrospective and future rainfall patterns will be required before their projections can reliablybe used for water resource planning and management Impact assessment to date on large-scale, regional basins in the state demonstrates that futureclimate change has a significant potential to impact both water quantity and quality, and as aconsequence, additional research is necessary to develop standardized climate projectionsand conduct impact assessment on the water resources systems on a statewide basis.83
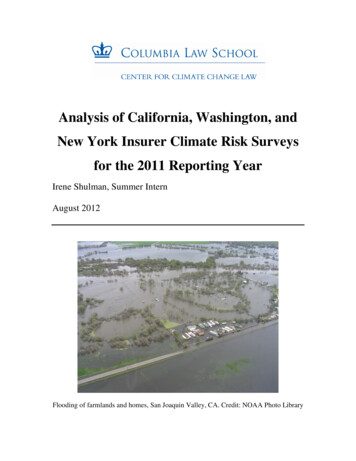
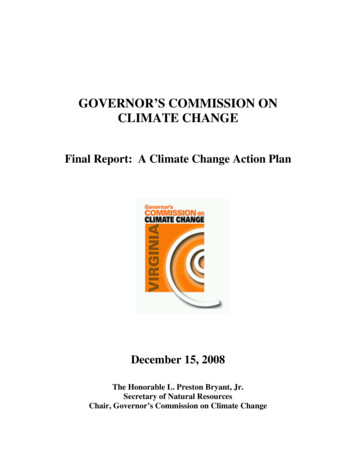
84 JAYANTHA OBEYSEKERA ET AL. Potential increases in temperature, and the variations in precipitation patterns may degradewater quality, exacerbate algae problems, and cause eutrophication of important water bodies.KeywordsRainfall; Temperature; Groundwater; Sea level rise; Water quality; GCM, Downscaling;UncertaintiesTIntroductionhe state of Florida includes more than 1,700 streams and rivers, 7,800 freshwater lakes,700 springs, 11 million acres of wetlands, and numerous freshwater aquifers, all ofwhich play an important role in meeting water needs of both humans and theenvironment (Marella 2015). Water use data in the state, which have been collected by the USGeological Survey, show that the combined fresh and saline water withdrawals have increased465% (over 12,000 million gallons a day) between 1950 and 2010. During the same period, thepopulation has increased by 580% (16 million) (Fig. 3.1 reproduced from Marella 2014).Increased withdrawal of freshwater for human use is triggering significant challenges formaintaining the water supply to environmentally sensitive areas, which are experiencingsignificant pressure from urbanization. The potential decrease in water supply due to futureclimate change, along with the contamination of freshwater aquifers from sea level rise, willexacerbate the challenges in meeting the water supply needs of Florida’s urban, agricultural, andenvironmental sectors.In Florida, 64% of the state's freshwater supply is from groundwater and it is a vital resourceessential to public and private water supply, irrigation, aquaculture, and industrial use.Groundwater is recharged by infiltration of precipitation and seepage from canals, lakes, andstreams. Groundwater flows down a hydraulic gradient and ultimately into wells, canals, streams,lakes, or to the ocean through seeps and springs, thus closing the continuous water cycle betweenland, ocean, and atmosphere (Mwashote et al. 2010, 2013). As groundwater use has increased incoastal areas, so has the recognition that groundwater supplies are vulnerable to overuse,contamination, and climate change impact. Any change in recharge and withdrawal fromgroundwater aquifers due to climate change has the potential to change the water budgets of thevarious parts of the state.Man-made and natural water resources systems in Florida are unique, complex, and diverse.The landscape of Florida varies significantly from north to south, with different patterns andextents of urban, agricultural, and natural systems. The state’s hydrologic systems are influencedby changes in rainfall patterns, evapotranspiration (ET), and sea level—the primary hydrologicdrivers of both surface water and groundwater conditions (both quality and quantity). In addition,the supply and demand of urban, agricultural, and environmental sectors vary from one part ofthe state to another. Consequently, it is not possible to discuss the implications of climate change
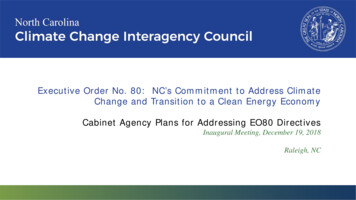
IMPLICATIONS OF CLIMATE CHANGE ON FLORIDA’S WATER RESOURCES 85on water resources in the state as a single entity. There is currently no comprehensive statewideassessment of the potential impacts of climate change on water resources. Implications ofpotential changes to climate are being investigated by numerous institutions, and the number andquality of such studies are evolving rapidly. There have been some pilot efforts to assess theimpacts of climate change on some regions of the state and those are considered to be the bestavailable investigations to date. This chapter presents a summary of such investigations, focusingon some large water resources systems in the state and concluding with a general assessment ofclimate change implications on water quality in Florida.Figure 3.1. Historic total population, freshwater, and saline water withdrawals in Florida 1950–2010(Marella 2014).Major Water Resources Systems in FloridaManagement of water resources in Florida is delegated to five water management districts(WMDs) that include the (Fig. 3.2): (a) South Florida Water Management District (SFWMD);(b) Southwest Florida Water Management District (SWFWMD); (c) St. Johns River WaterManagement District (SJRWMD); (d) Suwanee River Water Management District (SRWMD);and (e) Northwest Florida Water Management District (NWFWMD). In general, the WMDsadminister flood protection, water supply, water quality, and environmental protection through avariety of functions including planning, operations, and regulation. There are numerouswatersheds of varying size in the state; however, this chapter will only cover the current state ofknowledge regarding climate change investigations associated with four large and importantsystems in the state. They include the following regions (maps showing them are provided laterin this chapter): Greater Everglades Ecosystem
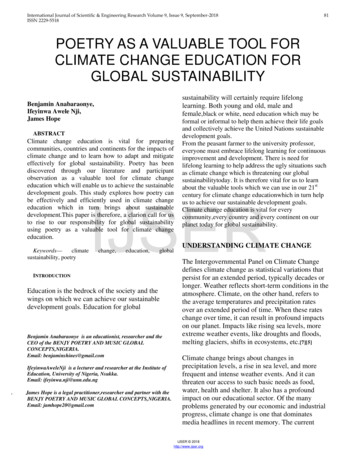
86 JAYANTHA OBEYSEKERA ET AL. Tampa Bay Region St. Johns River Region Suwannee River and Apalachicola River BasinsFigure 3.2. Five water management districts in Florida.Greater Everglades EcosystemBackgroundThe Greater Everglades Ecosystem spans from the Kissimmee River Basin, north of LakeOkeechobee all the way south to Florida Bay; and it includes a national treasure, America’sEverglades. The climate of this ecosystem is strongly seasonal and exhibits significant interannual variability with prolonged drought and wet periods. The water resources system originatesin the upper chain of lakes in the Kissimmee River Basin, and includes Lake Okeechobee, theEverglades Agricultural Area, the Water Conservation Areas, and Everglades National Park. Itis bordered by heavily urbanized areas of Florida’s lower East Coast (Fig. 3.3 showing areasbelow Lake Okeechobee). The natural, urban, and agricultural systems in the region are strongly
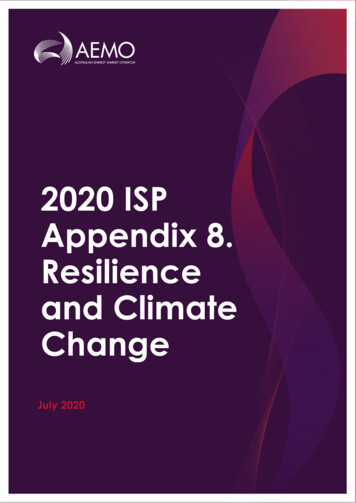
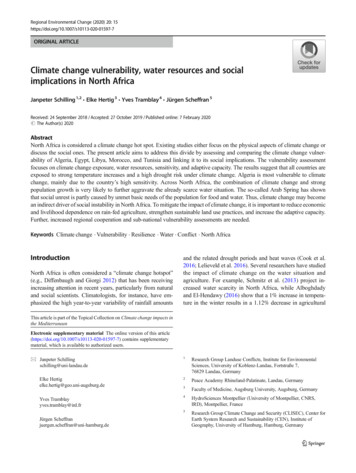
IMPLICATIONS OF CLIMATE CHANGE ON FLORIDA’S WATER RESOURCES 87interconnected in terms of supply and demand for water, and any change in rainfall patterns,evapotranspiration (ET), or sea level can have a significant impact on water quantity and qualityin any or all of the systems. The urbanized lower east coast area has a unique geology due to thepresence of the highly porous and permeable limestone aquifer known as the Biscayne Aquifer.Projected sea level rise will significantly influence saltwater intrusion along the coast affectingnumerous wellfields that supply water to the rapidly expanding population.Implications of Changing ClimateThere have been several attempts to assess the implications of climate change and sea level riseon the Greater Everglades Ecosystem (e.g., Obeysekera et al. 2011). The general approach thathas been used for such investigations is shown in Fig. 3.4 and it includes the detection ofhistorical trends from observations, understanding the role of teleconnections, skill testing ofglobal and regional climate models, and finally, the assessment of impacts on water resourcessystems.Irizarry et al. (2013) evaluated the observed data with the objective of detecting trends in bothtemperature and precipitation in the entire state. The observations consisted of long-term (1892–2008) precipitation and raw temperature records at 32 stations distributed throughout the state.They used several climate metrics based on both averages and extremes. The trend detectiontechniques included the non-parametric Mann-Kendall Trend Test (Kendall 1976), Sen-TheilRegression (Sen 1968), and the nonstationary Generalized Extreme Value distribution fitting forthe extremes. The results showed a general decrease in wet season precipitation, most evidentfor the month of May and possibly tied to a delay in the onset of the wet season. The number ofwet days during the dry season, especially during November through January, were found to haveincreased over the period of record. The number of “dog days” (temperature above 26.7 ºC duringthe wet season) per year has increased in many locations. A decrease in the daily temperaturerange was also observed and it was attributed to an increase in daily minimum temperature.Although there was no attempt to attribute the trends to climate change or anthropogenic causes,“urban heat island” effects were conjectured to have caused observed trends at some locations.In addition, climate teleconnections due to phenomena such as the Atlantic Multi-decadalOscillation (AMO), the Pacific Decadal Oscillation (PDO), and the El Niño-Southern Oscillation(ENSO) have significant effects that are tied to seasonal and decadal trends (see Chapter 16), andit is difficult to separate observed trends into natural versus anthropogenic causes.Following the approach in Fig. 3.4, there have been several attempts to evaluate the skills ofthe general circulation models (GCMs) of both the CMIP3 and CMIP5 suites of models (IPCC2007, 2013). Comparison of simulation results of the late 20th century GCM output to historicaldata has shown that the GCMs do not capture the statistical characteristics of the regional rainfallpatterns and temperature adequately. Due to the coarse resolution of most present-day GCMs,the region of south central Florida is not well represented. Some models do not adequately
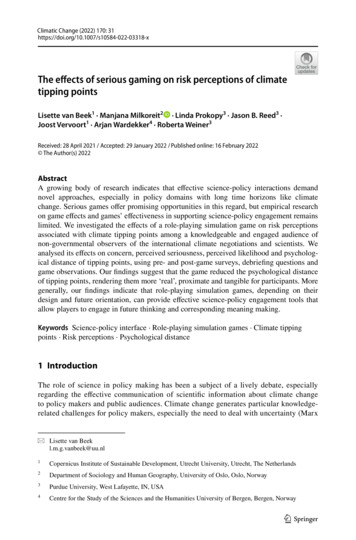
88 JAYANTHA OBEYSEKERA ET AL.represent large areas of the land mass of Florida (Obeysekera et al. 2011). As a consequence, themodels are unable to mimic temporal and spatial patterns resulting from mesoscale phenomenasuch as sea and lake breezes. Furthermore, it is not clear how well such models are able tosimulate teleconnections to global phenomena such as the AMO, the ENSO, and the PDO(Trimble et al. 2006). Such teleconnections include, but are not limited to, wetter (drier) thannormal precipitation during winter months of El Niño years (La Niña years), and wetter (drier)conditions during warm (cold) phase of both AMO and PDO.There have been several attempts to downscale GCMs to produce higher-resolution historicalrainfall and temperature records for water resources investigations. They have included bothstatistical downscaling (Maurer et al. 2007) and dynamical downscaling (Mearns et al. 2012;Stefanova et al. 2012) of temperature, precipitation and other climatic variables. Obeysekera etal. (2011) document the evaluation of 112 finer-resolution (1/8 degree), statistically-downscaledensemble datasets based on 15 climate models of the CMIP3 scenarios B1, A1B, and A2 for theperiod 1950–2009 (Maurer et al. 2007). The analysis of bias-corrected, statistically-downscaleddata showed that the simulation of climatology and the variability of temperature are adequate.However, the precipitation values still showed some biases. The dynamically-downscaled data(NARCCAP) were not much better, as they exhibited significant spatial biases although theymimicked the seasonal patterns of both precipitation and temperature well. The conclusion wasthat, even for dynamically-downscaled data, further bias correction may be necessary. A carefulreview of the downscaled products for Florida indicate that a reasonable range for percent changein annual rainfall is 5% for 2040 and 10% for 2070. For temperature, the corresponding rangefor 2040 is 0.5 to 1.5 C ( 0.8 to 2.4 F) with a median value of 1 C ( 1.6 F). For 2070,a reasonable planning range is 1 to 3 C ( 1.6 to 4.8 F) with a median value of 2 C( 3.2 F) (Obeysekera et al. 2011; Dessalegne et al. 2016)Efforts are underway to assess the CMIP5 suite of GCM models and the correspondingdownscaled datasets. The bias-corrected constructed analogs (BCCA, Maurer et al. 2010) ofprecipitation and daily minimum and maximum temperature projections at 12 km resolution havebeen analyzed (Dessalegne et al. 2016). The analysis included identification of future trends inprecipitation and temperature based on a total of 119 models covering three RCP scenarios forthe period 1950–2099. In an attempt to identify trends in precipitation and temperature, percentchange in precipitation for near future (2025–2055) and far future (2055-2085) as compared tochange in mean annual temperature were computed. Spatial trends in temperature andprecipitation as a function of latitude are shown in Fig. 3.5. The results show that the there is arobust increase in temperature as expected. However, trends in precipitation are scenariodependent, with RCP85 showing the largest average increase up to about 10%. Some models doshow a reduction in precipitation (Fig. 3.5b) and, as with CMIP3 models, precipitation change ismore uncertain than change in temperature. However, in all cases, temperature increases areexpected in the future.
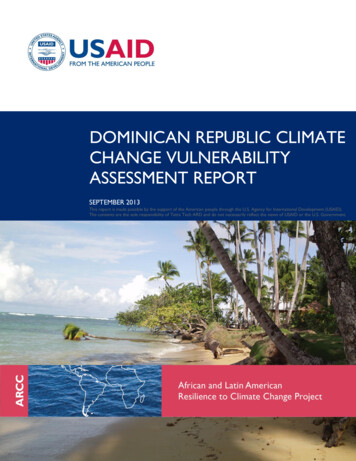
IMPLICATIONS OF CLIMATE CHANGE ON FLORIDA’S WATER RESOURCES 89Figure 3.3. Map of South Florida with primary hydrologic regions and domain simulated by the SouthFlorida Water Management Model (thick black outline); the southeast sub-region of the model domainbelow Lake Okeechobee is modeled using a distributed hydrologic model with a mesh of 3.2 km x 3.2 km(2 mile x 2 mile) cells. This figure shows the region of the Greater Everglades Ecosystem, south of LakeOkeechobee.
90 JAYANTHA OBEYSEKERA ET AL.Figure 3.4. General approach for using climate data and projections for water resources investigations inthe Greater Everglades Ecosystem Region of South Florida (Obeysekera et al. 2011).Sea Level RiseTide gage records show that relative sea level is rising along the entire Florida coastline. Thiscan have significant implications for coastal areas with low relief and highly permeable geology.The implications may include direct flooding of coastal landscape during storms and high-tide(including what is known as “nuisance flooding”), inefficiencies in coastal water control systemsaffecting flood protection, saltwater intrusion into water supply wells, and inundation of naturalsystems such as the Southern Everglades (SFWMD 2009). Sea level estimates based on theUnified Sea Level Rise Projections of the Southeast Florida Regional Climate Change Compactagencies are used for planning purposes (Fig. 3.6). They include at least three scenarios coveringa planning range and a high curve that is intended for evaluating high-risk projects (SFRCCC2015).Evaluation of Climate ScenariosObeysekera et al (2014) focused on general implications of potential changes in futuretemperature, and associated changes in ET, precipitation, and sea levels within the regionalboundary of Southeast Florida. Using a Bayesian approach known as the reliability ensembleaverage (REA) (Tebaldi et al. 2005), Obeysekera et al. (2011) provided probabilistic projections
IMPLICATIONS OF CLIMATE CHANGE ON FLORIDA’S WATER RESOURCES 91of both precipitation and temperature that are used to define scenarios for the water resourcesimpact assessment. Based on this analysis, and the analysis of CMIP5 data sets (Dessalegne etal. 2016), /-10% for precipitation scenarios and the single scenario of 1.5 C for temperaturewere selected for an assumed planning horizon of 2060. The sea level projection, assumed to becoincident with temperature increase, was assumed to be 1.5 ft. Based on the above information,seven modeling scenarios were developed (Table 3.1).Table 3.1. Water resources modeling scenarios based on temperature, precipitation, and sea level riseprojections used for evaluation of climate change impacts on water resources in the Greater EvergladesEcosystem Region of South Florida.Scenario NameTemperatureChangePrecipitationChangeSea Level RiseBASE-RF RF ET-RF ET-RF ETnoC RF ETNo changeNo changeNo change 1.5 C (2.7 F) 1.5 C (2.7 F) 1.5 C (2.7 F) 1.5 C (2.7 F)No change-10% 10%No change-10%-10% 10%No changeNo changeNo change0.46 m (0.81 ft)0.46 m (0.81 ft)0.46 m (0.81 ft)0.46 m (0.81 ft)Coastal CanalLevelsIncreased?NoNoNoYesYesNoYesET Evapotranspiration; RF Rainfall; noC No change in canal maintenance levels.The hydrologic implications of the above scenarios were investigated using the South FloridaWater Management Model (SFWMD 2005). This model simulates groundwater and surfacewater movements, including the complex operations and water management, over the entireGreater Everglades Ecosystem including the heavily urbanized areas of the Lower East Coast(Fig. 3.3), on a gridded mesh with a cell size of 2 miles 2 miles.The extreme rainfall scenarios together with warming show that the water budget of SouthFlorida could be altered significantly, affecting the performance of all sectors (agricultural,ecosystems, and urban). In particular, the -RF ET scenario would dry out the Evergladessignificantly, which would greatly alter its ecosystems and water supply function. One of themajor implications of the reduction in rainfall and the increased ET is that tributary inflows (e.g.from the Kissimmee River basin) would be reduced by a large percentage, causing a significantlowering of Lake Okeechobee levels. The only positive aspect of this scenario would be thesignificant reduction in damaging high flows to estuaries. The infrastructure could handleincreased rainfall, but this may cause considerable harm to the estuarine and wetland ecosystemsin terms of too much water. Depending on the rainfall and ET scenario, the agricultural and urbandemands would be increased or decreased by a significant percentage. In the worst case scenario,the demands not met by the agricultural service areas would increase significantly (by as muchas 50–60 percent). A thorough analysis of the scenarios are available in a series of publishedpapers (Aumen et al. 2015).
92 JAYANTHA OBEYSEKERA ET AL.Figure 3.5. Box and whisker plots of temperature and precipitation change from 1970–2000 to 2055–2085sorted by increasing latitude for the RCP 8.5 Scenario (Obeysekera et al. 2011; Dessalegne et al. 2016).Figure 3.6. Unified sea level rise projections for regional planning purposes (SFRCCC 2015).
IMPLICATIONS OF CLIMATE CHANGE ON FLORIDA’S WATER RESOURCES 93In summary, there are still considerable uncertainties in climate projections of hydrologicdrivers such as precipitation and ET affecting the Greater Everglades region. Consequently, moststudies have employed a scenario approach for impact assessment of climate change. Over thenext 50 years, such scenarios to date cover 1.6 to 4 F (0.5 to 2.2 C ) of temperature increase, 10% change in rainfall, and 13 to 26 inches (0.33 m to 0.66 m) in sea level rise. Hydrologicmodeling using the scenarios demonstrate that if such changes materialize, significant impact tothe water resources of South Florida could occur.Tampa Bay RegionBackgroundTampa Bay is the largest estuary in Florida and extends about 50 km (30 miles) inland from theGulf of Mexico. Tampa Bay Water, a wholesale regional drinking water supplier, operates adiverse water supply system in this region that includes regional well fields, river withdrawalsfrom the Hillsborough and Alafia rivers, and a seawater desalination plant.Within the Tampa Bay region, there are eight major watersheds: the Pithlachascotee, Anclote,Hillsborough, Alafia, Little Manatee, Withlacoochee, Peace, and Manatee river watersheds. Inaddition, an anthropogenically-altered surface conveyance system, the Tampa Bypass Canalsystem, operates as both flood protection and water supply for the City of Tampa and Tampa BayWater. Besides the major river watersheds and the Tampa Bypass Canal, there are various smallercreeks in the region including Bullfrog, Delaney, Pinellas County Coastal creeks, NorthwestHillsborough Creek, and various minor coastal creeks. All of these creeks discharge either to theGulf of Mexico or to Tampa Bay (Geurink and Basso 2013). A variety of land cover types arepresent in the study area, including urban, grassland, forest, agricultural, mined land, water, andwetlands.Average annual rainfall for region from 1989 to 2001 was approximately 1230 mm (48.5inches). The region typically has eight drier months followed by four months of wet summerseason when 50-70% total annual rainfall occurs. Currently, depending on the rainfall andprevailing conditions, ET accounts for 30-90% of the water balance (Geurink and Basso 2013).Accurate prediction of seasonal, interannual, and decadal climate variability, as well as potentiallong-term climate change, are crucial to water resources planning and management in the region.Changes in rainfall frequency, seasonal shifts such as the onset and end of rainfall, as well asincreases in temperatures have important implications for surface and groundwater availability.Higher than average temperatures can significantly change the hydrologic water balance,increasing water losses to the atmosphere through higher ET.The Tampa Bay region is one of the most urbanized regions in Central Florida, and publicwater supply is one of the largest water users in the region. During the 1980s and 1990s, the
94 JAYANTHA OBEYSEKERA ET AL.Tampa Bay region experienced severe drought. This problem was further exacerbated by a 108%increase in population between 1970 and 2000 to over 2 million people. Lack of adequate rainfalland continuous reliance on only the Upper Floridan aquifer for public water supply led todewatering of the region’s wetlands that resulted in significant environmental impact. Theensuing regional conflict and need to balance municipal and agricultural water use with naturalsystem needs resulted in the creation of Tampa Bay Water as a regional water supply utility (seeAsefa et al. 2015 for history). Since then, Tampa Bay Water has diversified its public watersupply sources to include surface water (50-60%), groundwater (30-40%), and desalinated seawater (0-10%) in its portfolio.The shift from an all-groundwater source supply to significant surface water reliance changedthe risk profile for the agency and led to the need to understand the potential impacts of climatechange on water supply and demand. Changes in climate could have important implications forutilities like Tampa Bay Water; e.g., changes in public water supply operations due to changesin the magnitude and seasonality of surface and groundwater availability, changes in wetland andlake ecosystems and associated regulatory programs due to change in ET and precipitation, andimpacts on asset management programs for infrastructure than might be affected by risingtemperatures. In response to these needs, dynamically downscaled CMIP3 GCMs were biascorrected for the Tampa Bay region and used as climatic input for the integrated hydrologicmodel developed for the region by Tampa Bay Water and the Southwest Florida WaterManagement District.Hydrologic ModelThere are strong interactions among surface, subsurface, and ET processes in the Tampa Bayarea due to the complex geology and relatively flat topography in the region (Geurink and Basso2012). In order to understand and predict the dynamic surface–groundwater interactions in thiscomplex system, two regional water management agencies, Tampa Bay Water and the SouthwestFlorida Water Management District, jointly developed an integrated surface/subsurfacehydrologic model for the area. The Integrated Hydrologic Model (IHM) couples the EPAHydrologic Simulation Program-Fortran (HSPF; Bicknell et al. 2001) and the USGSMODFLOW96 (Harbaugh and McDonald 1996) for surface and groundwater modeling,respectively (Geurink et al. 2006). The model is characterized as deterministic, semi-distributed,and semi-implicit with variable time steps and spatial discretization (Ross et al. 2004).Subsequently, Tampa Bay Water developed the Integrated Northern Tampa Bay (INTB) modelapplication using the IHM to improve hydrologic assessment capabilities of West CentralFlorida. The hydrologic model domain for INTB is bordered by the Gulf of Mexico on the west(Fig. 3.7), by the Floridan aquifer flow lines on the north and east, and by a general head boundarycondition at the southern boundary, which located far enough from the area of interest for thisstudy to minimize the influence of the boundary condition (Geurink et al. 2006). The INTB model
IMPLICATIONS OF CLIMATE CHANGE ON FLORIDA’S WATER RESOURCES 95was calibrated and verified for the Northern Tampa Bay Region using hydrologic observationsfrom 1989 to 2006 (Geurink and Basso 2012).Figure 3.7. Map of the Tampa Bay region including the extent of the integrated hydrologic model, thelocations of the streamflow predictions shown, and the CLARReS10 grid. Colored areas indicate thecontributing areas for the streamflow prediction locations. (1 km 0.62 miles)CLARREnCE10 Data ProductsThe CLARREnCE10 dataset was developed by the Florida State University (FSU) Center forOcean Atmospheric Prediction Studies sets/regional-downscaling). The data includes retrospective predictions (historical climateconditions, 1969–2000) and future climate scenario projections (A2 scenario for years 2039–2070) from three CMIP3 GCMs that were dynamically downscaled to 10 km resolution usingthe FSU Regional Spectral Model (RSM) (see Fig. 3.7). The three GCMs selected by FSU fordownscaling were the Community Climate System Model (CCSM), version 3 of the HadleyCentre Coupled Model (HadCM3), and the Geophysical Fluid Dynamics Laboratory (GFDL).Emission scenarios were generated by the Intergovernmental Panel on Climate Change (IPCC)and are described in the IPCC Special Reports on Emission Scenarios (IPCC 2000). Scenarioswere developed that describe different storylines about possible future social, economic,technological, and demographic developments. The emission scenarios have internally consistentrelationships that were used to describe future pathways of greenhouse gas emissions. The A2scenario describes a very heterogeneous world and represents a “high future CO2 emissions"
96 JAYANTHA OBEYSEKERA ET AL.scenario. Projected CO2 concentrations affect the Earth’s radiative energy budget, and thus arethe key forcing input used in global climate model simulations of future conditions.MethodologyGCMs are run at coarse resolution (100- to 200-km (60 to 120-mile) grid cells) to make themcomputationally tractable. As a result, GCMs typically show bias in the model outputs. Regionalclimate models (RCMs) are run at much finer scale (10 to 50-km (6 to 30-mile) grid cells) inorder to capture local scale processes that may not be well-represented by large-scale GCMmodels. However, previous studies have shown there is still a need to bias-correct even highresolution RCM output for the Tampa Bay region in order to accurately reproduce histori
83 CHAPTER 3 Implications of Climate Change on Florida's Water Resources Jayantha Obeysekera1, Wendy Graham2, Michael C. Sukop3, Tirusew Asefa4, Dingbao Wang5, Kebreab Ghebremichael6, and Benjamin Mwashote7 1South Florida Water Management District, West Palm Beach, FL; 2Water Institute and Department of Agricultural and Biological Engineering, University of Florida, Gainesville, FL .