Transcription
Visualization in Bayesian workflowJonah Gabry†Department of Statistics and ISERP, Columbia University, New York, USA.E-mail: jgabry@gmail.comDaniel Simpson†Department of Statistical Sciences, University of Toronto, Canada.Aki VehtariDepartment of Computer Science, Aalto University, Espoo, Finland.Michael BetancourtISERP, Columbia University, and Symplectomorphic, LLC, New York, USA.Andrew GelmanDepartments of Statistics and Political Science, Columbia University, New York, USA.Summary. Bayesian data analysis is about more than just computing a posterior distribution, and Bayesian visualization is about more than trace plots of Markov chains. PracticalBayesian data analysis, like all data analysis, is an iterative process of model building,inference, model checking and evaluation, and model expansion. Visualization is helpfulin each of these stages of the Bayesian workflow and it is indispensable when drawinginferences from the types of modern, high-dimensional models that are used by appliedresearchers.1.Introduction and running exampleVisualization is a vital tool for data analysis, and its role is well established in both theexploratory and final presentation stages of a statistical workflow. In this paper, we arguethat the same visualization tools should be used at all points during an analysis. Weillustrate this thesis by following a single real example, estimating the global concentrationof a certain type of air pollution, through all of the phases of statistical workflow: (a)Exploratory data analysis to aid in setting up an initial model; (b) Computational modelchecks using fake-data simulation and the prior predictive distribution; (c) Computationalchecks to ensure the inference algorithm works reliably, (d) Posterior predictive checksand other juxtapositions of data and predictions under the fitted model; (e) Modelcomparison via tools such as cross-validation.The tools developed in this paper are implemented in the bayesplot R package(Gabry, 2017; R Core Team, 2017), which uses ggplot2 (Wickham, 2009) and is linkedto—though not dependent on—Stan (Stan Development Team, 2017a,b), the generalpurpose Hamiltonian Monte Carlo engine for Bayesian model fitting.†Joint first author
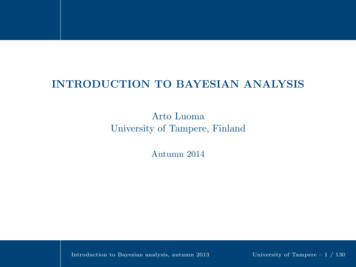
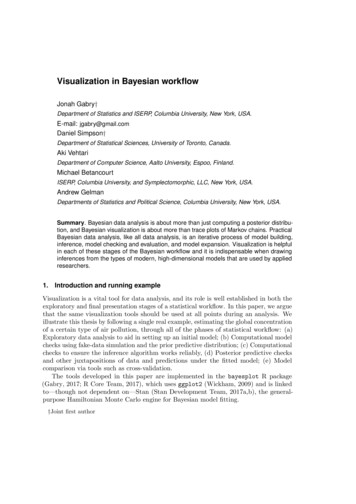
2Gabry et al.(a) The satellite estimates of PM2.5 . The black (b) A scatterplot of log(PM2.5 ) vs log(satellite).points indicate the locations the ground moni- The points are colored by WHO super region.tors.Fig. 1: Data displays for our running example of exposure to particulate matter.In order to better discuss the ways visualization can aid a statistical workflow weconsider a particular problem, the estimation of human exposure to air pollution fromparticulate matter measuring less than 2.5 microns in diameter (PM2.5 ). Exposure toPM2.5 is linked to a number of poor health outcomes, and a recent report estimated thatPM2.5 is responsible for three million deaths worldwide each year (Shaddick et al., 2017).For our running example, we use the data from Shaddick et al. (2017), aggregated tothe city level, to estimate ambient PM2.5 concentration across the world. The statisticalproblem is that we only have direct measurements of PM2.5 from a sparse network of2980 ground monitors with heterogeneous spatial coverage (Figure 1a). This monitoringnetwork has especially poor coverage across Africa, central Asia, and Russia.In order to estimate the public health effect of PM2.5 , we need estimates of thePM2.5 concentration at the same spatial resolution as population data. To obtain theseestimates, we supplement the direct measurements with a high-resolution satellite dataproduct that converts measurements of aerosol optical depth into estimates of PM2.5 . Thehope is that we can use the ground monitor data to calibrate the approximate satellitemeasurements, and hence get estimates of PM2.5 at the required spatial resolution.The aim of this analysis is to build a predictive model of PM2.5 with appropriatelycalibrated prediction intervals. We will not attempt a full analysis of this data, whichwas undertaken by Shaddick et al. (2017). Instead, we will focus on three simple, butplausible, models for the data in order to show how visualization can be used to helpconstruct, sense-check, compute, and evaluate these models.2.Exploratory data analysis goes beyond just plotting the dataAn important aspect of formalizing the role of visualization in exploratory data analysisis to place it within the context of a particular statistical workflow. In particular, weargue that exploratory data analysis is more than simply plotting the data. Instead, we
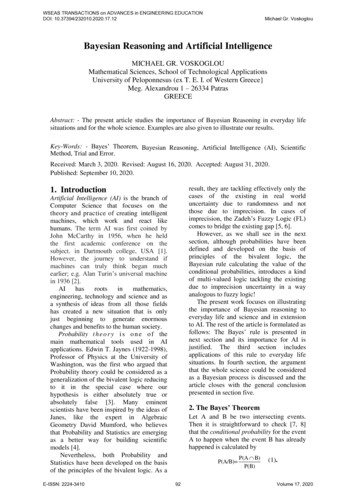
Visualization in Bayesian workflow(a) The WHO super-regions. The pinksuper-region corresponds to wealthy countries. The remaining regions are definedbased on geographic contiguity.3(b) The super-regions found by clusteringbased on ground measurements of PM2.5 .Countries for which we have no ground monitor measurements are colored red.Fig. 2: World Health Organization super-regions and super-regions from clustering.consider it a method to build a network of increasingly complex models that can capturethe features and heterogeneities present in the data (Gelman, 2004).This ground-up modeling strategy is particularly useful when the data that have beengathered are sparse or unbalanced, as the resulting network of models is built knowingthe limitations of the design. A different strategy, which is common in machine learning,is to build a top-down model that throws all available information into a complicatednon-parametric procedure. This works well for data that are a good representation thepopulation of interest but can be prone to over-fitting or generalization error when usedon sparse or unbalanced data. Using a purely predictive model to calibrate the satellitemeasurements would yield a fit that would be dominated by data in Western Europeand North America, which have very different air pollution profiles than most developingnations. With this in mind, we use the ground-up strategy to build a small network ofthree simple models for predicting PM2.5 on a global scale.The simplest predictive model that we can fit assumes that the satellite data productis a good predictor of the ground monitor data after a simple affine adjustment. In fact,this was the model used by the Global Burden of Disease project before the 2016 update(Forouzanfar et al., 2015). Figure 1b shows a straight line that fits the data on a log-logscale reasonably well (R2 0.6). Discretization artifacts at the lower values of PM2.5 arealso clearly visible.To improve the model, we need to think about possible sources of heterogeneity.For example, we know that developed and developing countries have different levels ofindustrialization and hence different air pollution. We also know that desert sand canbe a large source of PM2.5 . If these differences are not appropriately captured by thesatellite data product, fitting only a single regression line could leave us in danger offalling prey to Simpson’s paradox (that a trend can reverse when data are grouped).To expand out our network of models, we consider two possible groupings of countries.The WHO super-regions (Figure 2a) separate out rich countries and divide the remainingcountries into six geographically contiguous regions. These regions have not beenconstructed with air pollution in mind, so we also constructed a different division based
4Gabry et al.(a) The same as Figure 1b, but also showing (b) The same as (a), but the the linear modelsindependent linear models fit within each WHO are fit within each of the cluster regions shownsuper-region.in Figure 2b.Fig. 3: Graphics in model building: here, evidence that a single linear trend is insufficient.on a 6-component hierarchical clustering of ground monitor measurements of PM2.5(Figure 2b). The seventh region constructed this way is the collection of all countries forwhich we do not have ground monitor data.When the trends for each of these regions are plotted individually (Figures 3a, 3b), itis clear that some ecological bias would creep into the analysis if we only used a singlelinear regression. We also see that some regions, particularly Sub-Saharan Africa (red inFigure 3a) and clusters 1 and 6 (pink and yellow in Figure 3b), do not have enough datato comprehensively nail down the linear trend. This suggests that some borrowing ofstrength through a multilevel model may be appropriate.From this preliminary data analysis, we have constructed a network of three potentialmodels. Model 1 is a simple linear regression. Model 2 is a multilevel model whereobservations are stratified by WHO super-region. Model 3 is a multilevel model whereobservations are stratified by clustered super-region.These three models will be sufficient for demonstrating our proposed workflow, butthis is a smaller network of models than we would use for a comprehensive analysis of thePM2.5 data. Shaddick et al. (2017), for example, also consider smaller regions, countrylevel variation, and a spatial model for the varying coefficients. Further calibrationcovariates can also be included.
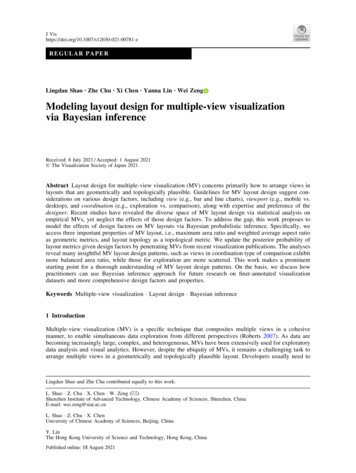
Visualization in Bayesian workflow(a) Vague priors(b) Weakly informative priors5(c) ComparisonFig. 4: Visualizing the prior predictive distribution. Panels (a) and (b) show realizationsfrom the prior predictive distribution using vague priors and weakly informative priors,respectively. Simulated data are plotted on the y-axis and observed data on the x-axis.Because the simulations under the vague and weakly informative priors are so different,the y-axis scales used in panels (a) and (b) also differ dramatically. Panel (c) emphasizesthe difference in the simulations by showing the red points from (a) and the black pointsfrom (b) plotted using the same y-axis.3.Fake data can be almost as valuable as real data for building your modelThe exploratory data analysis resulted in a network of three models: one linear regressionmodel and two different linear multilevel models. In order to fully specify these models,we need to specify prior distributions on all of the parameters. If we specify properpriors for all parameters in the model, a Bayesian model yields a joint prior distributionon parameters and data, and hence a prior marginal distribution for the data. That is,Bayesian models with proper priors are generative models. The main idea in this sectionis that we can visualize simulations from the prior marginal distribution of the data toassess the consistency of the chosen priors with domain knowledge.The main advantage to assessing priors based on the prior marginal distribution forthe data is that it reflects the interplay between the prior distribution on the parametersand the likelihood. This is a vital component of understanding how prior distributionsactually work for a given problem (Gelman et al., 2017). It also explicitly reflects the ideathat we can’t fully understand the prior by fixing all but one parameter and assessingthe effect of the unidimensional marginal prior. Instead, we need to assess the effect ofthe prior as a multivariate distribution.The prior distribution over the data allows us to extend the concept of a weaklyinformative prior (Gelman et al., 2008) to be more aware of the role of the likelihood. Inparticular, we say that a prior leads to a weakly informative joint prior data generatingprocess if draws from the prior data generating distribution p(y) could represent any dataset that could plausibly be observed. As with the standard concept of weakly informativepriors, it’s important that this prior predictive distribution for the data has at least somemass around extreme but plausible data sets. On the other hand, there should be nomass on completely implausible data sets. We recommend assessing how informative theprior distribution on the data is by generating a “flip book” of simulated datasets thatcan be used to investigate the variability and multivariate structure of the distribution.
6Gabry et al.To demonstrate the power of this approach, we return to the multilevel model forthe PM2.5 data. Mathematically, the model will look like yij N(β0 β0j (β1 β1j )xij , σ 2 ), β0j N(0, τ02 ), β1j N(0, τ12 ), where yij is the logarithm of the observedPM2.5 , xij is the logarithm of the estimate from the satellite model, i ranges over theobservations in each super-region, j ranges over the super-regions, and σ, τ0 , τ1 , β0 andβ1 need prior distributions.Consider some priors of the sort that are sometimes recommended as being vague:βk N (0, 100), τk2 Inv-Gamma(1, 100). The data generated using these priors andshown in Figure 4a are completely impossible for this application; note the y-axis limitsand recall that the data are on the log scale. This is primarily because the vague priorsdon’t actually respect our contextual knowledge.We know that the satellite estimates are reasonably faithful representations of thePM2.5 concentration, so a more sensible set of priors would be centered around modelswith intercept 0 and slope 1. An example of this would be β0 N (0, 1), β1 N (1, 1),τk N (0, 1). Data generated by this model is shown in Figure 4b. While it is clear thatthis realization corresponds to a quite mis-calibrated satellite model (especially when weremember that we are working on the log scale), it is quite a bit more plausible than themodel with vague priors.We argue that the tighter priors are still only weakly informative, in that the implieddata generating process can still generate data that is much more extreme than we wouldexpect from our domain knowledge. In fact, when repeating the simulation shown inFigure 4b many times we found that the data generated using these priors can producedata points with more than 22,000µgm 3 , which is a still a very high number in thiscontext.The prior predictive distribution is a powerful tool for understanding the structure ofour model before we make a measurement, but its density evaluated at the measureddata also plays the role of the marginal likelihood which is commonly used in modelcomparison. Unfortunately the utility of the the prior predictive distribution to evaluatethe model does not extend to utility in selecting between models. For further discussionsee Gelman et al. (2017).4.Graphical Markov chain Monte Carlo diagnostics: moving beyond trace plotsConstructing a network of models is only the first step in the Bayesian workflow. Ournext job is to fit them. Once again, visualizations can be a key tool in doing this well.Traditionally, Markov chain Monte Carlo (MCMC) diagnostic plots consist of trace plotsand autocorrelation functions. We find these plots can be helpful to understand problemsthat have been caught by numerical summaries such as the potential scale reductionb (Stan Development Team, 2017b, Section 30.3), but they are not always neededfactor Ras part of workflow in the many settings where chains mix well.For general MCMC methods it is difficult to do any better than between/withinsummary comparisons, following up with trace plots as needed. But if we restrict ourattention to Hamiltonian Monte Carlo (HMC) and its variants, we can get much moredetailed information about the performance of the Markov chain (Betancourt, 2017). Weknow that the success of HMC requires that the geometry of the set containing the bulk
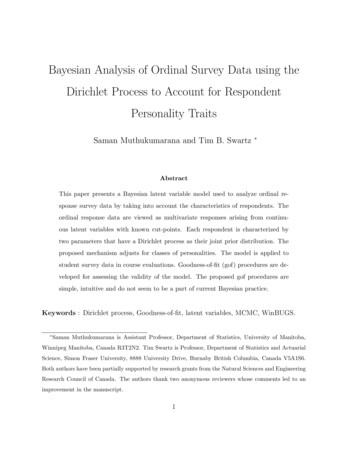
Visualization in Bayesian workflow(a) For Model 3, a bivariate plot of the logstandard deviation of the cluster-level slopes(y-axis) against the slope for the first cluster (xaxis). The green dots indicate starting pointsof divergent transitions. This plot can be madeusing mcmc scatter in bayesplot.7(b) For Model 3, a parallel coordinates plotshowing the cluster-level slope parametersand their log standard deviation log τ1 . Thegreen lines indicate starting points of divergent transitions. This plot can be made usingmcmc parcoord in bayesplot.Fig. 5: Several different diagnostic plots for Hamiltonian Monte Carlo. Models were fitusing the RStan interface to Stan 2.17 (Stan Development Team, 2017a).of the posterior probability mass (which we call the typical set) is fairly smooth. It is notpossible to check this condition mathematically for most models, but it can be checkednumerically. It turns out that if the geometry of the typical set is non-smooth, the pathtaken by leap-frog integrator that defines the HMC proposal will rapidly diverge fromthe energy conserving trajectory.Diagnosing divergent numerical trajectories precisely is difficult, but it is straightforward to identify these divergences heuristically by checking if the error in the Hamiltoniancrosses a large threshold. Occasionally this heuristic falsely flags stable trajectories asdivergent, but we can identify these false positives visually by checking if the samplesgenerated from divergent trajectories are distributed in the same way as the non-divergenttrajectories. Combining this simple heuristic with visualization greatly increases its value.Visually, a concentration of divergences in small neighborhoods of parameter space,however, indicates a region of high curvature in the posterior that obstructs exploration.These neighborhoods will also impede any MCMC method based on local information,but to our knowledge only HMC has enough mathematical structure to be able to reliablydiagnose these features. Hence, when we are using HMC for our inference, we canuse visualization to not just assess the convergence of the MCMC method, but also tounderstand the geometry of the posterior.There are several plots that we have found useful for diagnosing troublesome areasof the parameter space, in particular bivariate scatterplots that mark the divergenttransitions (Figure 5a), and parallel coordinate plots (Figure 5b). These visualizationsare sensitive enough to differentiate between models with a non-smooth typical set and
8Gabry et al.(a) Model 1(b) Model 2(c) Model 3Fig. 6: Kernel density estimate of the observed dataset y (dark curve), with densityestimates for 100 simulated datasets yrep drawn from the posterior predictive distribution (thin, lighter lines). These plots can be produced using ppc dens overlay in thebayesplot package.models where the heuristic has given a false positive. This makes them an indispensabletool for understanding the behavior of a HMC when applied to a particular targetdistribution.If HMC were struggling to fit Model 3, the divergences would be clustered in theparameter space. Examining the bivariate scatterplots (Figure 5a), there is no obviouspattern to the divergences. Similarly, the parallel coordinate plot (Figure 5b) does notshow any particular structure. This indicates that the divergences that are found are mostlikely false positives. For contrast, the supplementary material contains the same plotsfor a model where HMC fails to compute a reliable answer. In this case, the clustering ofdivergences is pronounced and the parallel coordinate plot clearly indicates that all ofthe divergent trajectories have the same structure.5.How did we do? Posterior predictive checks are vital for model evaluationThe idea behind posterior predictive checking is simple: if a model is a good fit we shouldbe able to use it to generate data that resemble the data we observed. This is similar inspirit to the prior checks considered in Section 3, except now we have a data-informeddata generating model. This means we can be much more stringent in our comparisons.Ideally, we would compare the model predictions to an independent test data set, but thisis not always feasible. However, we can still do some checking and predictive performanceassessments using the data we already have.To generate the data used for posterior predictivechecks (PPCs) we simulate from theRposterior predictive distribution p(ỹ y) p(ỹ θ)p(θ y) dθ, where y is our currentdata, ỹ is our new data to be predicted, and θ are our model parameters. Posteriorpredictive checking is mostly qualitative. By looking at some important features of thedata and the replicated data, which were not explicitly included in the model, we mayfind a need to extend or modify the model.For each of the three models, Figure 6 shows the distributions of many replicateddatasets drawn from the posterior predictive distribution (thin light lines) compared to
Visualization in Bayesian workflow(a) Model 1(b) Model 29(c) Model 3Fig. 7: Histograms of statistics skew(yrep ) computed from 4000 draws from the posteriorpredictive distribution. The dark vertical line is computed from the observed data. Theseplots can be produced using ppc stat in the bayesplot package.the empirical distribution of the observed outcome (thick dark line). From these plotsit is evident that the multilevel models (2 and 3) are able to simulate new data that ismore similar to the observed log (PM)2.5 values than the model without any hierarchicalstructure (Model 1).Posterior predictive checking makes use of the data twice, once for the fitting andonce for the checking. Therefore it is a good idea to choose statistics that are orthogonalto the model parameters. If the test statistic is related to one of the model parameters,e.g., if the mean statistic is used for a Gaussian model with a location parameter, theposterior predictive checks may be less able to detect conflicts between the data andthe model. Our running example uses a Gaussian model so in Figure 7 we investigatehow well the posterior predictive distribution captures skewness. Model 3, which useddata-adapted regions, is best at capturing the observed skewness, while Model 2 does anok job and the linear regression (Model 1) totally fails.We can also perform similar checks within levels of a grouping variable. For example,in Figure 8 we split both the outcome and posterior predictive distribution according toregion and check the median values. The two hierarchical models give a better fit to thedata at the group level, which in this case is unsurprising.In cross-validation, double use of data is partially avoided and test statistics can bebetter calibrated. When performing leave-one-out (LOO) cross-validation we usually workwith univariate posterior predictive distributions, and thus we can’t examine properties ofthe joint predictive distribution. To specifically check that predictions are calibrated, theusual test is to look at the leave-one-out cross-validation predictive cumulative densityfunction values, which are asymptotically uniform (for continuous data) if the model iscalibrated (Gelfand et al., 1992; Gelman et al., 2013).The plots shown in Figure 9 compare the density of the computed LOO-PITs (thickdark line) versus 100 simulated datasets from a standard uniform distribution (thin lightlines). We can see that, although there is some clear miscalibration in all cases, thehierarchical models are an improvement over the single-level model.The shape of the miscalibration in Figure 9 is also meaningful. The frown shapesexhibited by Models 2 and 3 indicate that the univariate predictive distributions are too
10Gabry et al.(a) Model 1(b) Model 2(c) Model 3Fig. 8: Checking posterior predictive test statistics, in this case the medians, withinregion. The vertical lines are the observed medians. The facets are labelled by numberin panel (c) because they represent groups found by the clustering algorithm rather thanactual super-regions. These grouped plots can be made using ppc stat grouped in thebayesplot package.
Visualization in Bayesian workflow(a) Model 1(b) Model 211(c) Model 3Fig. 9: Graphical check of leave-one-out cross-validated probability integral transform(LOO-PIT). The thin lines represent simulations from the standard uniform distributionand the thick dark line in each plot is the density of the computed LOO-PITs. Similarplots can be made using ppc dens overlay and ppc loo pit in the bayesplot package.The downwards slope near zero and one on the “uniform” histograms is an edge effectdue to the density estimator used and can be safely discounted.broad compared to the data, which suggests that further modeling will be necessary toaccurately reflect the uncertainty. One possibility would be to further sub-divide thesuper-regions to better capture within-region variability (Shaddick et al., 2017).6.Pointwise plots for predictive model comparisonVisual posterior predictive checks are also useful for identifying unusual points in thedata. Unusual data points come in two flavors: outliers and points with high leverage. Inthis section, we show that visualization can be useful for identifying both types of datapoint. Examining these unusual observations is a critical part of any statistical workflow,as these observations give hints as to how the model may need to be modified. Forexample, they may indicate the model should use non-linear instead of linear regression,or that the observation error should be modeled with a heavier tailed distribution.The main tool in this section is the one-dimensional cross-validated leave-one-out(LOO) predictive distribution p(yi y i ). Gelfand et al. (1992) suggested examining theLOO log-predictive density values (they called them conditional predictive ordinates)to find observations that are difficult to predict. This idea can be extended to modelcomparison by looking at which model best captures each left out data point. Figure 10ashows the difference between the expected log predictive densities (ELPD) for theindividual data points estimated using Pareto-smoothed importance sampling (PSISLOO, Vehtari et al. (2017b,c)). Model 3 appears to be slightly better than Model 2,especially for difficult observations like the station in Mongolia.In addition to looking at the individual LOO log-predictive densities, it is useful tolook at how influential each observation is. Some of the data points may be difficult topredict but not necessarily influential, that is, the predictive distribution does not changemuch when they are left out. One way to look at the influence is to look at the differencebetween full data log-posterior predictive density and the LOO log-predictive density.
12Gabry et al.(a) The difference in pointwise ELPD values(b) The k̂ diagnostics from PSIS-LOO forobtained from PSIS-LOO for Model 3 comparedModel 2. The 2674th data point (the only datato Model 2 colored by the WHO cluster (seeFigure 1b for the key). Positive values indicate point from Mongolia) is highlighted by the k̂diagnostic as being influential on the posterior.Model 3 outperformed Model 2.Fig. 10: Model comparisons using leave-one-out (LOO) cross-validation.We recommend computing the LOO log-predictive densities using PSIS-LOO asimplemented in the loo package (Vehtari et al., 2017a). A key advantage of usingPSIS-LOO to compute the LOO densities is that it automatically computes an empiricalestimate of how similar the full-data predictive distribution is to the LOO predictivedistributionn for each left out point.o Specifically, it computes anR empirical estimate k̂ of10k inf k 0 : D 10 (p q) , where Dα (p q) α 1log Θ p(θ)α q(θ)1 α dθ is thekα-Rényi divergence (Yao et al., 2018). If the jth LOO predictive distribution has a largek̂ value when used as a proposal distribution for the full-data predictive distribution, itsuggests that yj is a highly inferential observation.Figure 10b shows the k̂ diagnostics from PSIS-LOO for our Model 2. The 2674thdata point is highlighted by the k̂ diagnostic as being influential on the posterior. Ifwe examine the data we find that this point is the only observation from Mongolia andcorresponds to a measurement (x, y) (log (satellite), log (PM2.5 )) (1.95, 4.32), whichwould look like an outlier if highlighted in the scatterplot in Figure 1b. By contrast,under Model 3 the k̂ value for the Mongolian observation is significantly lower (k̂ 0.5)indicating that that point is better resolved in Model 3.7.DiscussionVisualization is probably the most important tool in an applied statistician’s toolbox andis an important complement to quantitative statistical procedures. In this paper, we’vedemonstrated that it can be used as part of a strategy to compare models, to identifyways in which a model fails to fit, to check how well our computational methods have
Visualization in Bayesian workflow13resolved the model, to understand the model well enough to be able to set priors, and toiteratively improve the model.The last of these tasks is a little bit controversial as using the measured data to guidemodel building raises the concern that the resulting model will generalize poorly to newdatasets. A different objection to using the data twice (or even more) comes from ideasaround hypothesis testing and unbiased estimation, but we are of the opinion that thedanger of overfitting the data is much more concerning (Gelman and Loken, 2014).In the visual workflow we’ve outlined in this paper, we have used the data to improvethe model in two places. In Section 3 we proposed prior predictive checks with therecommendation that the data generating mechanism should be broader than the distribution of the observed data in line with the principle of weakly informative priors. InSection 5 we recommended undertaking careful calibration checks as well as checks basedon summary statistics, and then updating the model accordingly to cover the deficienciesexposed by this procedure. In both of these cases, we have made recommendations thataim to reduce the danger. For the prior predictive checks, we recommend not cleavingtoo closely to the observed data and instead aiming for a prior data generating processthat can produce plausible data sets, not necessarily ones that are indistinguishablefrom observed data. For the posterior predictive checks, we ameliorate the concerns bychecking carefully for influential measurements and proposing that model extensions beweakly informative extensions that are still centered on the previous model (Simpsonet al., 2017).Regar
Bayesian data analysis is about more than just computing a posterior distribu-tion, and Bayesian visualization is about more than trace plots of Markov chains. Practical Bayesian data analysis, like all data analysis, is an iterative process of model building, inference, model checking and evaluation, and model expansion. Visualization is helpful