Transcription
J Vishttps://doi.org/10.1007/s12650-021-00781-zR E G UL A R P A P E RLingdan Shao Zhe Chu Xi Chen Yanna Lin Wei ZengModeling layout design for multiple-view visualizationvia Bayesian inferenceReceived: 8 July 2021 / Accepted: 1 August 2021 The Visualization Society of Japan 2021Abstract Layout design for multiple-view visualization (MV) concerns primarily how to arrange views inlayouts that are geometrically and topologically plausible. Guidelines for MV layout design suggest considerations on various design factors, including view (e.g., bar and line charts), viewport (e.g., mobile vs.desktop), and coordination (e.g., exploration vs. comparison), along with expertise and preference of thedesigner. Recent studies have revealed the diverse space of MV layout design via statistical analysis onempirical MVs, yet neglect the effects of those design factors. To address the gap, this work proposes tomodel the effects of design factors on MV layouts via Bayesian probabilistic inference. Specifically, weaccess three important properties of MV layout, i.e., maximum area ratio and weighted average aspect ratioas geometric metrics, and layout topology as a topological metric. We update the posterior probability oflayout metrics given design factors by penetrating MVs from recent visualization publications. The analysesreveal many insightful MV layout design patterns, such as views in coordination type of comparison exhibitmore balanced area ratio, while those for exploration are more scattered. This work makes a prominentstarting point for a thorough understanding of MV layout design patterns. On the basis, we discuss howpractitioners can use Bayesian inference approach for future research on finer-annotated visualizationdatasets and more comprehensive design factors and properties.Keywords Multiple-view visualization Layout design Bayesian inference1 IntroductionMultiple-view visualization (MV) is a specific technique that composites multiple views in a cohesivemanner, to enable simultaneous data exploration from different perspectives (Roberts 2007). As data arebecoming increasingly large, complex, and heterogeneous, MVs have been extensively used for exploratorydata analysis and visual analytics. However, despite the ubiquity of MVs, it remains a challenging task toarrange multiple views in a geometrically and topologically plausible layout. Developers usually need toLingdan Shao and Zhe Chu contributed equally to this work.L. Shao Z. Chu X. Chen W. Zeng (&)Shenzhen Institute of Advanced Technology, Chinese Academy of Sciences, Shenzhen, ChinaE-mail: wei.zeng@siat.ac.cnL. Shao Z. Chu X. ChenUniversity of Chinese Academy of Sciences, Beijing, ChinaY. LinThe Hong Kong University of Science and Technology, Hong Kong, China
L. Shao et al.explore different possible layouts through trail and error. Experience and expertise are required to createvisualizations that can effectively facilitate data analysis (Qin et al. 2020).Many authoring tools have been developed to facilitate MV design, such as Tableau1 and Power BI.2 Thetools provide a set of commonly used templates as prototypes for MV layouts, like sales dashboard templates in Tableau. These predefined templates however only cover a small portion of the diverse designspace of MV layouts. Some recent studies aim to reveal the design space of MV layouts, using statisticalanalyses (e.g., Chen et al. 2021c; Al-maneea and Roberts 2019) or interactive dashboard (e.g., Zeng et al.2021a; Chen et al. 2021a) on empirical MV layouts curated from visualization publications. Chen et al.(2021c) revealed some interesting design patterns regarding view composition. For example, it is found thatdesigners tend to position diagram in the center of MVs, and they prefer to adopt simple and perceptuallyaccurate view types.Besides view type, a number of works examine the impacts of other design factors on MV layout design,such as viewport (e.g., Sadana and Stasko 2016; Brehmer et al. 2019; Kister et al. 2017; Langner et al.2019, 2018; Horak et al. 2019), coordination type (e.g., North and Shneiderman 1997; Roberts 2007; L’Yiet al. 2021; Chen et al. 2021b), and expertise and preference of designer (e.g., Pretorius and van Wijk 2009;Grammel et al. 2010). Nevertheless, these studies typically consider MV design from a single perspective,while effective MVs require a comprehensive consideration of all these perspectives. As a result, there is alack of concrete design guidelines specifying geometric (e.g., view size and position) and topologicalproperties of MV layouts. Those existing guidelines (e.g., Wang Baldonado et al. 2000; Qu and Hullman2018) have little to no relevance to the geometric and topological properties.This work aims to fill the gap, by modeling the effects of various design factors, including view,coordination, and designer, on MV layout design via Bayes’ rule. We focus on three important quantitativemetrics for MV layouts, i.e., maximum area ratio (MAR) and weighted average aspect ratio (WAAR) asgeometric metrics, and topology types as a typological metric (Sect. 3.2). To achieve the goal, we firstcomplement a public MV dataset (Chen et al. 2021c) with fine annotations of designer and coordinationinformation (Sect. 5). Viewport is omitted in the annotation and consequently the analysis, since MVs in thedataset are mostly designed for the desktop. We conduct an independence analysis using the Chi-squaredindependence test and confirm that the design factors are independent to each other (Sect. 6.2). Next, weconstruct Bayesian probabilistic inference by updating the posterior probability of layout metrics upon thedesign factors by penetrating MVs in the dataset and utilize Chi-squared significant difference test to furthercheck whether the effects are significant (Sects. 6.3-6.5). Through the quantitative analyses, we revealsome insightful MV layout design patterns. For example, coordination factor has the greatest influence onMV layouts, wherein views of comparison coordination type exhibit more balanced area ratios, while thoseof exploration have more scattered area ratios.The main contributions of this work are summarized below: We complement a public MV dataset with information of designer and coordination type. The dataset isavailable on https://lingdan33.github.io/bayesmvlayout for further research on MV layout design. We construct Bayesian inference models that describe the effects of various design factors on MV layoutdesign based on empirical MVs in the dataset. We reveal some common MV layout design patterns, which can potentially lead to concrete MV designguidelines.2 Related work2.1 Multiple-view visualization (MV)MV is a specific visual data exploration technique that presents two or more views to show differentperspective of data (Wang Baldonado et al. 2000; Roberts 2007). To design MVs, one needs to considerhow many views to be used, what kinds of coordination between views, and how to layout and positionviews in a constrained viewport. The process requires substantial expertise and experience of designers tomanage MVs in plausible layouts (Pretorius and van Wijk 2009; Grammel et al. 2010; Heer et al. icrosoft.com.
Modeling layout design for multiple-view visualization. View A view is formed after data transformation, visual mapping, and view transformation (Card et al.1999). To cope with various input data and analytical tasks, many views types have been designed, e.g.,bar chart, line chart, etc. Views of different types can have distinct geometric properties, includingaspect ratio and view size, as unveiled by a recent study (Chen et al. 2021c). When composing multipleviews into one MV, there can be potential conflicts between preferable aspect ratio and size forindividual view, and the overall geometric plausibility of an entire MV layout. Hence, this workexamines the effects of view factor on MV layouts. Coordination Views in MVs are mostly coordinated, i.e., a view updates its content in response to users’interactions in other views (North and Shneiderman 1997; Scherr 2008). The visualization communityhas identified various coordination types. A basic coordination type is to present the data in variousforms and offer linked interactions across multiple views, which helps users perceive insightfulrelationship and facts from different perspectives. For example, VitalVizor (Zeng and Ye 2018)integrates a spatial map and a metrics view to present spatial and attributive information of urban vitalitysimultaneously. Besides, multiple views can be arranged side-by-side to facilitate comparison (Gleicheret al. 2011; L’Yi et al. 2021). Roberts (2007) presented a taxonomy of coordination types and provideddesign guidelines for MV design based on coordination among views. Yet the guidelines are ratherimplicit. This work aims to provide more concrete MV layout design suggestions based on coordinationtypes. Viewport Many MVs (e.g., Zeng et al. 2021b; Pan et al. 2021; Xia et al. 2020b) have been developed forexploratory data analysis and visual analytics in different application fields. However, most of the MVsare designed for the desktop. With the extensive popularity of mobile devices, VR/AR, and displaywalls, more research has been shifted toward designing visualizations beyond the desktop, e.g., mobiledevices (e.g., Sadana and Stasko 2016; Brehmer et al. 2019), multiple viewport setups (e.g., Horak et al.2019; Langner et al. 2018, 2019), or even distributed servers (e.g., Xia et al. 2020a). These works have acommon basis of MV layout design shall be in line with the viewport. Designer Designers may rely on their experience and expertise to design effective visualizations.Grammel et al. (2010) showed that visualization novices only used simple heuristics and preferredfamiliar view types (e.g., bar chart and pie chart) when constructing visualizations. Pretorius and vanWijk (2009) further reminded designers to think from the user perspective in addition to theirexperience. Nevertheless, no direct evidence has shown how designers, as a factor in the designingprocess, affect MV layout design.This work aims to provide evidence-based guidelines for MV layout design, by exploiting the effects of theabove-mentioned design factors (except viewport) on empirical MV layouts. We opt for Bayes’ rule that hasbeen successfully applied in many other design problems.2.2 Layout designLayout design focuses on finding feasible spatial configuration for a set of interrelated objects. The qualityof layout design can be evaluated from two perspectives: geometry that specifies the position and size ofeach object, and topology that specifies logical relationships between objects (Michalek et al. 2002).Research on layout design spreads in a wide range of applications, including interface design (e.g.,Swearngin et al. 2018; Lee et al. 2020), and architecture (e.g., Yang et al. 2013; Wu et al. 2018). In thiswork, we focus on MV layout that concerns view arrangement in a viewport.The visualization community has proposed guidelines and revealed practices for MV layout design. Forexample, Qu and Hullman (2018) suggested various constraints, validations, and exceptions for consistencyin MVs, while Chen et al. (2021c) conducted an in-depth analysis of composition and configuration patternsof layouts in empirical MVs. It is a general consensus that the design space for MV layout is huge. Manystudies adopt simplified heuristics for MV layout design. Sadana and Stasko (2016) used vertical stacking orgrid-based layouts when design MVs on mobile devices, while Horak et al. (2019) arranged multiple viewsacross viewports by positioning similar views side-by-side. As such, there is an emerging need for modelingthe effects of various considerations on MV layout design. This work makes a contribution in this directionusing Bayesian probabilistic inference.
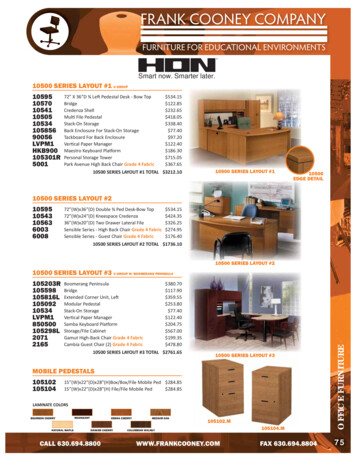
L. Shao et al.2.3 Bayes for designBayes’ theorem is used to describe the probability of an event, given some prior knowledge of conditionsthat could be related to this event. Compared with classical statistics, an unknown fixed parameter value canbe represented as a random variable in Bayes’ theorem. In other words, Bayesian statistics deals exclusivelywith probabilities, so one can use it to determine the optimum decision to take in the face of theuncertainties.Many works in assisting design rely on Bayesian models learned from existing design dataset. Forexample, Talton et al. (2012) employed Bayes’ rule to learn grammar production rules to parse web-pages.Deka et al. (2016) presented a method that can automatically generate mobile UI by Bayesian modelmerging learning from UI data captured by interaction mining. Dudley et al. (2019) demonstrated theeffectiveness of Bayesian optimization in assisting interface design. Following in line with these studies, thiswork also employs Bayes’ rule to infer the effects of design factors on MV layouts, by updating the posteriorprobability distribution of layout properties based on empirical MVs.3 OverviewThis section summarizes design factors for MV layout (Sect. 3.1) and layout metrics considered in the work(Sect. 3.2).3.1 Design factorsFigure 1 presents a typical design process for MV layouts. Given a set of views and predefined coordinations among the views, a designer carefully arranges the views in the target viewport, yielding MVs ofvarious layout design patterns. We formulate the relevant design factors in the following categories. View There have been several view type taxonomies in the history of data visualization (e.g., Lohseet al. 1994; Shneiderman 1996). In this work, we adopt the taxonomy by Chen et al. (2021c) thatcategorizes views into 14 types including 12 chart types of information visualization adopted fromBorkin et al. (2013), along with SciVis and panel. Studies (e.g., Chen et al. 2021c; Al-maneea andRoberts 2019) have shown that different view types typically have distinct layout design patterns, tomaximize space usage and optimize view expressiveness. This work extends these studies with aprobabilistic model that unveils the effects of view types on layout design.ViewViewportCoordination- Bar chart- Exploration- Desktop- Line chart- Focus & Context- Mobile Device.Designer- Preference- Institution.Multiple-View VisualizationFig. 1 Illustration of the design process for MV layouts: given the inputs of multiple views (e.g., bar, line chart), coordination(e.g., exploration, focus ? context), and viewport (e.g., desktop, mobile device), the designer arranges the views in properlayout to achieve effective MVs
Modeling layout design for multiple-view visualization. Coordination Chen et al. (2021b) recently developed a coordination framework that generalizescoordination structures in terms of composition of interactions and data transformations. The frameworkwas built upon a systematic review of coordinations from existing theories and applications.Nevertheless, it is not feasible to derive detailed coordination structures from static MV imagescollected in papers. As such, we adopt a simplified classification by Roberts (2007) that suggests sixcategories of coordination types: (1) overviewþdetail, (2) focusþcontext, (3) difference, (4) master/slave, (5) miniature views (often used in virtual reality), and (6) small multiples. Some coordinationtypes are not exclusive when annotating, while some other coordination types are not available in thedataset. In the end, we formulate categories of coordination types as follows:1. Exploration For MVs in exploration coordination type, each view encodes a different aspect (ordimension) of data. Selection of an object in one view results in other views highlighting the sameobject. From the statistic analysis (see Fig. 4), we find that exploration is the most commoncoordination type.2. Focus þcontext For MVs in focus þcontext coordination type, there is a focused main view thatallows for closer inspection, and the other views are usually used for showing context of the entiredataset.3. Comparison Views of comparison coordination type can be used for presenting different datasets, orthe same dataset in a different context (e.g., different years), or the exact same dataset and contextbut from different angles for comparison and comprehensive presentation of the data. Viewport Various types of viewports, such as desktop and mobile device, have become the primarymeans of accessing information. It is, therefore, becoming increasingly important to develop multipleview visualization that adapt to any viewport (Roberts et al. 2014). However, we find that mostMVs (e.g., Zeng et al. 2021b; Pan et al. 2021) in the MV dataset are designed for the desktop. As such,this work considers the desktop as the sole condition of viewport. We leave it to the future work toconsider other viewport conditions like mobile devices and large displays. Designer MV layout design is a creative process that depends on expertise and preferences ofdesigners (Pretorius and van Wijk 2009; Grammel et al. 2010; Heer et al. 2008). Different designersmay have diverse preferences about choices of view types, and positions and sizes of views, yieldingdifferent layouts. Nevertheless, it is nearly impossible to quantify the expertise levels and preferences ofdesigners. Alternatively, this work analyzes primary institute of designers of a MV, which can beretrieved from the publications, as the condition for designer factor.3.2 Layout metricsGiven a MV of n views, i.e., MV :¼ fvi gni¼1 where vi denotes a view, we measure the following geometricand topological metrics: Geometry Visualization conveys data and information in a limited display space. As such, space utility isa primary consideration for MV layout design. In this work, we access the following two metrics thatreflect area and aspect ratio of space utility.1. Maximum area ratio (MAR) For visualization design, space allocation shall depend on theimportance of data and information. We hypothesize that view areas are affected by the abovementioned design factors. For example, in MVs of focus þcontext coordination type, the focus viewis typically allocated a large space, while the context view is small, leading to a large MAR value. Incomparison, views of comparison coordination type typically have the same size; thus, the value ofMAR will be relatively small. We measure area ratio of the largest view to areas of all views as:maxðwðvi Þ hðvi ÞÞ;MAR ¼ Pni¼1 wðvi Þ hðvi Þ8vi 2 MV;ð1Þwhere wð Þ and hð Þ represent width and height of a view, respectively. MAR ranges in (0,1), where valuestoward 1 indicate that MVs have a view in dominant size.2. Weighted average aspect ratio (WAAR) Proper aspect ratio looks visual aesthetic and can effectivelyclarify a presentation. For instance, artists and architects typically proportion their work toapproximate the golden ratio of approximately 1.6180 (or 13:8). Aspect ratio has also been adopted
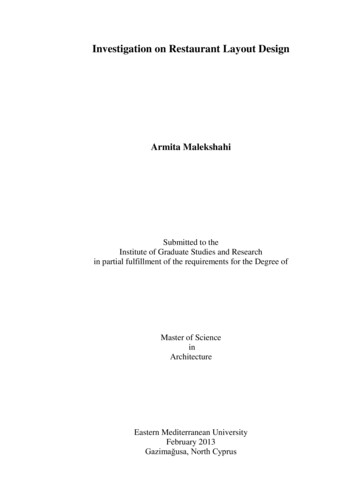
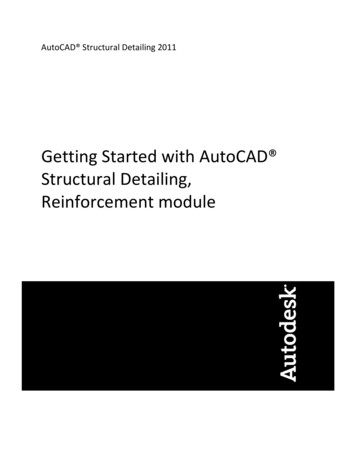
L. Shao et al.for evaluating visualizations, e.g., treemap design (Bederson et al. 2002). Chen et al. (2021c)revealed that views of different types are usually arranged in different aspect ratios. For example,aspect ratio of bar charts usually ranges from 1/7 to 7, while that of line charts usually ranges from 1/5 to 5. As such, this work further examines how aspect ratios are affected by view type and otherdesign factors. Specifically, we use WAAR to emphasize views of larger sizes, in comparison withunweighted aspect ratio used in treemap (Bederson et al. 2002). The metric is measured as: n Xwðvi Þwðvi Þ hðvi Þ Pn:WAAR ¼ð2Þhðvi Þi¼1 wðvi Þ hðvi Þi¼1We figure out that WAAR ranges in [1, 8.5] in the dataset, where close to 1 values indicate that the viewsare in balanced aspect ratios like matrix arrangement. Topology Topological structure of MV layout reflects visual information flow among views (Lu et al.2020). Chen et al. (2021c) figured out about 100 layouts in existing MVs. Yet most of the layouts haveonly one sample, which is not enough for Bayesian analysis. To overcome the deficiency, we summarizethe topology of MV layouts into horizontal, vertical, and hybrid, as illustrated in Fig. 2. Horizontaltopology arranges all views side-by-side horizontally. There are three horizontal layouts identified in thedataset. Similarly, vertical topology arranges all views side-by-side vertically, and only three verticallayouts are identified. Hybrid topology divides the display via slicing-and-dicing, and most layouts are inhybrid topology. We would like to examine whether the topology of view layout is affected by thedesigner, similar to reading where most Western languages go from left to right, while Arabic andHebrew are read from right to left, and some Asian languages are read vertically. We count thefrequency of topology types on conditions of different design factors and construct Bayesian models toexamine the impacts of design factors on the choices of layout topology.4 Bayesian inference for MV layout designThe ultimate goal of this work is to detect and model the effects of design factors on MV layouts. We opt forBayes’ rule to model the design patterns, by inferring the posterior probability of layout metrics givendesign factors observed in empirical MVs.4.1 DefinitionsTo facilitate the discussion, Table 1 introduces common notations adoptedin the work. Here, we define the d-dimensional design space of all possible design factors, C ¼ C1 C2 . . . Cd , where Ci is thedomain of ith design factor. As described in Sect. 3.1, this work considers three-dimensional factors, i.e.,view (C1 ), coordination (C2 ), and designer (C3 ). We learn design patterns from a MV dataset,M ¼ fMV1 ; MV2 ; ; MVm g, and correspondingly the set of layouts L derived from M. This work considers three-perspective layout metrics of MAR, WAAR, and topology, which are denoted as Lmar , Lwaar ,and Ltopo , respectively. Each MV can be encoded as a tuple in the form of (view, coordination, designer).For example, the MV in Fig. 3 is originally encoded asð½table; map; map; grid; bar; point ; ½comparison; exploration ; HKUSTÞ;indicating that the MV comprises one table (Fig. 3a), two maps (Fig. 3b1, b2), one gird (Fig. 3c), one barchart (Fig. 3d), and one point chart (Fig. 3e); the MV has both comparison and exploration coordinationtypes; and its primary institute is HKUST.Topology Horizontal:LayoutVertical:Hybrid:.Fig. 2 This work categorizes MV layouts into three topology types: horizontal, vertical, and hybrid
Modeling layout design for multiple-view visualization.Table 1 Notations and their descriptionsNotationCCiMLDescriptionThe space of possible design factorsOne-dimensional design factorThe set of all MVs collectedThe set of all MV layouts derived from MFig. 3 Annotating coordination types for StreetVizor (Shen et al. 2018). Views b1 and b2 are side-by-side maps forcomparison, thus being labeled as comparison. Views a, b1, b2, c, d, and e explore street views from different perspectives,thus being labeled as explorationNote that each dimensional design factor involves various discrete data values. For example, we identify128 primary institutions in the MV dataset (see Sect. 5.2), i.e., jC3 j ¼ 128 if we consider each individualinstitute. Nevertheless, this will yield excessive discrete data values, hindering Bayesian inference. Weovercome the deficiency by clustering institutes into groups based on continent (see Sect. 6.2). Similarly, wecategorize all possible data values of view dimension (C1 ) by considering if the MV contains a specific viewtype or not, e.g., bar chart. We keep coordination dimension (C2 ) as origin since the number of coordinationdata values is small. In this way, the above tuple can be simplified asðwith bar; ½comparison; exploration ; AsiaÞ:4.2 ModelingThe model is used to explain the probability of events occurring. Given a set of design considerations C, weneed to formulate a predictive probability distribution over the design space of possible MV layouts. Butbefore we formulate a predictive probability distribution, we need to formulate the posterior distribution, jCÞ / PðCjl ÞPðl Þ;Pðlð3Þ Þ is the likelihoodwhere l is a K-dimensional vector which describes the probability of each layout, PðCjl Þ is the prior of MV layouts.of the set of design considerations C given a particular l, and Pðl Prior. In our work, the three variables of design factors (i.e., view, designer, and coordination) are allcategorical. Their observed values conform to a polynomial distribution, so we set the prior to theDirichlet distribution. For the domain of L with K possible categories, we define a K-dimensionalvector l to describe the probability of observing each of the K categories. And we assume that the priordistribution over all values of l is the Dirichlet distribution with parameter a
L. Shao et al. Þ Þ ¼ Dirichletðl jaPðl K PKCak Y ak 1¼ QK k¼1lk :k¼1 Cðak Þ k¼1ð4Þ Likelihood After we label the dataset and make statistics, we know the observation counts for each of theK possible categories. We denote the observation count for the category i with mi and denote the totalcount of the dataset with N. Given a particular l, the likelihood can be calculated as follows!KYNk Þ ¼lmð5ÞPðCjlk :mi m2 :::mk k¼1 to describe the observation count mi . By combining Eqs. 3–5, we canWe define a K-dimensional vector mcalculate posterior probability jCÞ / PðCjl ÞPðl ÞPðl þ m ja Þ¼ Dirichletðl K PC N þ Kk¼1 ak Ylkak þmk 1 :¼ QKk¼1 Cðak þ mk Þ k¼1ð6ÞSimilar to continuous cases, our prior and posterior in the discrete scenario are also conjugate distributions.The Dirichlet prior for discrete attributes has only one parameter: .a Since the number of MV designs in thedataset is limited, we use Laplace smoothing to avoid the condition when predictive probability is calculatedto be 0. We set a to be a vector of K equal numbers (1.0), which constitutes a uniform distribution across allpossible MV layouts. Finally, we integrate our updated belief over all possible values of l to get thepredictive probability for a given layout LiZ ÞPðl jCÞPðLi jCÞ ¼ PðLi jl¼ PKai þ mik¼1 ðakþ mk Þð7Þ:5 Data processingThis work is built upon the MV dataset collected by Chen et al. (2021c). The dataset consists of 360 MVimages collected from publications in IEEE VIS, EuroVis, and IEEE PacificVis conferences 2011–2019.Each MV image comprises two or more views. Type (e.g., bar chart, line chart, etc.) and bounding box(including center position and size) of each view have been marked by the authors. With the information,one can feasibly analyze view type compositions and layout configuration patterns of MV design (Chenet al. 2021c). The work requires additional information of coordination types and designers. We make upthe information by labeling coordination types and designers (Sect. 5.1). Next, we conduct a preliminaryanalysis to reveal characteristics of the dataset (Sect. 5.2).5.1 Dataset constructionIn the MV dataset (Chen et al. 2021c), a view is classified into one of 14 view types, including 12chart types of information visualizations (Borkin et al. 2013) ? SciVis ? panel. However, panels areusually used for controlling visualization parameters or displaying legends and colormaps. It is infeasible toclassify the coordination type of panels with other views. Thus we omit MVs comprising only one view ofinformation visualization or SciVis, along with one or more panels. This process yields 303 MVs for furtheranalysis. Next, we adopt the following annotating strategies for labeling coordination and designer. Annotating coordination Coordination is a mutual relationship among two or more views. A MVconsists of multiple views, and these views can form several coordination relationships. As shown inFig. 3, the StreetVizor system (Shen et al. 2018) employs two map views (b1 and b2) to compare spatial
Modeling layout design for multiple-view visualization.distribution of street views in two different cities. Hence, we annotate the coordination type for views b1and b2 as comparison. Besides the map views, StreetVizor also employs a table view (Fig. 3a) for multiscale navigation and feature filtering, along with three statistic views (Fig. 3c–e) for presentingquantitative measurements. As such, we also annotate the coordination type for views a, b1, b2, c, d, ande as exploration. In this way, coordination types for the MV are labeled as [comparison, exploration].To annotate coordination types, we add a component to the labeling tool developed by Chen et al.(2021c). With the component, users can indicate which views are coordinated, and what is the type ofcoordination. For most MVs, one can directly identify the coordination type among views by looking atthe visualization images. Nevertheless, there are cases that are hard to justify. In such scenarios, we referto the corresponding publication and identify the coordination type by carefully examining thevisualization image’s caption and description in the main text. Annotating designer There are two perspective informations of designer in a MV. First, we can create abipartite graph with set of MV as one part and set of author as another part. An edge between a MV andan author indicates the author is a designer of the MV. However, a MV can be connected to severalauthors, being unsuitable for Bayesian analysis. As such, we opt to generate a bijection graph that mapsone-to-one correspondence between MV and primary institute of the first author, i.e., a MV has one andonly one primary institute. In this way, we can feasibly access the impacts of designers on MV design.We can further cluster primary institutes by properties like continent, to check whether MV design isdependent on geographic location.We add the newly annotated coordination and designer information to the JSON file by Chen e
Modeling layout design for multiple-view visualization via Bayesian inference Received: 8 July 2021/Accepted: 1 August 2021 . like sales dashboard tem-plates in Tableau. These predefined templates however only cover a small portion of the diverse design space of MV layouts. Some recent studies aim to reveal the design space of MV layouts .