Transcription
Botanical Visualization of Huge HierarchiesErnst Kleiberg , Huub van de Wetering†, Jarke J. van Wijk‡Department of Mathematics and Computer ScienceEindhoven University of TechnologyAbstractA new method for the visualization of huge hierarchicaldata structures is presented. The method is based on the observation that we can easily see the branches, leaves, andtheir arrangement in a botanical tree, despite of the largenumber of elements. The strand model of Holton is usedto convert an abstract tree into a geometric model. Nonleaf nodes are mapped to branches and child nodes to subbranches. A naive application of this model leads to unsatisfactory results, hence it is tailored to suit our purposesbetter. Continuing branches are emphasized, long branchesare contracted, and sets of leaves are shown as fruit. Themethod is applied to the visualization of directory structures. The elements, directories and files, as well as theirrelations can easily be extracted, thereby showing that theuse of methods from botanical modeling can be effective forinformation visualization.Keywords: botanical tree, logical tree, huge hierarchy,strands, tree visualization, directory tree, phyllotaxis1 IntroductionAn effective approach to the organization of a large number of items, be it files, staff members or books, is to groupthem and to repeat this step recursively. As a result, hierarchical data structures are ubiquitous. Small hierarchicalstructures are very effective to locate information, but thecontent and organization of large structures is much harderto grasp. A typical use-case is the question ’Why is my diskfull?’. To answer this question in an effective and efficientway, the support offered by interactive visualization, showing both the structure as well as the sizes of individual filesand directories, is almost indispensable.We present a new method for the visualization of hugehierarchical structures. The method is based on a simple e.a.m.kleiberg@stud.tue.nl† wstahw@win.tue.nl‡ vanwijk@win.tue.nlintuition. The term tree is standard for hierarchical data.When we observe botanical trees, we find that the leaves,branches, and their arrangement can easily be extracted, inspite of the very large numbers. Hence, what would happenif we try to visualize hierarchical data as botanical trees?We explore this intuition as follows. In section 2 we discuss related work, both for tree visualization and tree modeling. In section 3 the strand model of Holton [6] is described and adopted as a basis for our method. In section 4this method is tuned to our particular aim. Especially, weshow that files can be visualized more effectively as fruitthan as leaves. Results are shown and discussed in section5, followed by the conclusions in section 6.2 BackgroundMany methods have been developed for the display ofhierarchical information structures, or, for short, trees. Filebrowsers are the best known example, but they are limited in the number of items that can be shown simultaneously. A second important category are node and link diagrams. Within the graph drawing community [13] manyalgorithms have been developed to generate such diagramsin 2D. However, these diagrams do not use display space effectively, hence their applicability is limited to small trees,with at most a few hundred of nodes. The treemap methodof Shneiderman [12] uses a space-filling approach, and cancope with much larger hierarchies. Also, treemaps offer anatural way to visualize additional information via the areaof the rectangles. However, the structural information mayget lost here, although this can be remedied by adding extracues [14].Another escape is to display trees in 3D instead of 2D.We refer to [5] for an overview. The hope is that the extra dimension would give, literally, more space, and thatthis would ease the problem of displaying large structures.This is not without problems, however. Occlusion rendersparts of the model invisible, the depth of lines is hard tograsp. Hence, real time rotation and extra depth cues areindispensable to understand such 3D visualizations of trees.The best known example for 3D visualization of trees is the
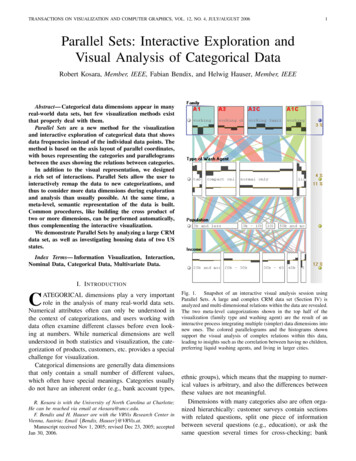
α1β3 Methodα2We first explain in detail the part of the strand modelwe use. Next we adapt it to suit the needs for visualizingdirectory trees.3.1 Strand model of botanical treesλρFigure 1. Stem and two sub-branches.cone tree of Robertson [11], refined and extended by others to display larger structures [7, 2]. However, with thesemethods the number of elements that can be shown simultaneously in a comprehensible way still seems to be limited.We aim at a 3D visualization method that enables theuser to understand the structure of large tree structures aswell as attributes of data. Our inspiration comes from nature: Botanical trees are large, but the elements and their arrangements can still be extracted. How can we tailor methods from botanical modeling to our purposes?The modeling of botanical trees has intensively beenstudied in the graphics community. Besides for scientificcuriosity, it also has direct practical applications. Modeling trees by entering polygons or other geometric objectsdirectly is a tedious job, hence higher level methods are indispensable to generate trees and forests automatically, forinstance for animation purposes. As a result of this research,many methods are available to generate images and modelsof botanical trees, such as fractals [9], texture mapping [1],and L-systems [10]. Especially the L-systems and all theirextensions are an impressive machinery. L-systems enablethe user to model the structure of a wide variety of plantsand trees in a compact way. However, for our applicationthis is not so relevant. The structure of the tree to be generated is determined by the data to be visualized, whereas ingraphics the task is to generate the structure.For our purposes the strand model of Holton [6], or asimilar model used by Devroye and Pruszewski [3], is veryconvenient. It is particularly suitable because it can be tunedeasily to follow the structure of the input hierarchy. Also,the strands enable a simple mapping of the size of elementsinto the radii of branches.In the following sections we elaborate on this. As anexample of a large hierarchical structure we use directorytrees. The aim is the visualization of both the structuralinformation as well as the content, i.e. file type and size.Strands are used to mimic the internal vascular structure of a botanical tree. The smallest branch is assignedone strand and each other branch has a number of strandsthat equals the sum of the strands of the sub-branches. InHolton’s model [6] strands are used to determine the tree’sstructure, branch thickness and length, as well as branching angles between a branch and a sub-branch. Below wegive a recursive function for generating a tree model as a setof cylinders. The model is a simplified version of Holton’smodel, leaving out, for instance, gravity and phototropism.tree(s)stem : cylinder ((0,0,0), (0,λ,0),ρ);if s0 1 then return stem;s1 : *(s-2) 1; s2 : s-s1 ;α1 : α*s 2 /s; α2 : α*s 1 /s;r1 : s1 /s; r2 : s2 /s;return stem T (0, λ, 0) R y (β) Rz ( α1 ) S(r1 ) tree(s1 ) T (0, λ, 0) R y (β) Rz (-α2 ) S(r2 ) tree(s2 );The function tree(s) results in a model with as stem a cylinder with radius ρ and length λ and containing s 0 strands.If s is larger than one the returned model contains the stemplus the transformed model of two sub-trees. The numberof strands for each sub-tree is computed using some probability function which depends, for instance, on the recursion level and is chosen such that the total result looks likea real tree. One step of the recursive function tree is shownin figure 1. The transformation of the first sub-tree consistsof a scaling (S) with a factor r1 equal to the square root ofthe ratio of the corresponding strands. Hence, the area ofthe cross-section of the cylinder is proportional to the number of strands. After scaling, this sub-tree is rotated withan angle α1 about the z-axis (Rz ); the angles α1 and α2 arechosen such that their sum, the angle between the two subtrees, equals a given angle α; furthermore, they are chosensuch that the heaviest of the two sub-trees diverts the leastfrom the stem. Both sub-trees are rotated with an angle βabout the y-axis (R y ). For β often the angle 360/ϕ is usedwhere ϕ (1 5)/2 is the golden section. This is a result of the study of phyllotaxis, the arrangement of leaveson a stem, and is as such also applied in [4, 8] for modelingplants and trees.
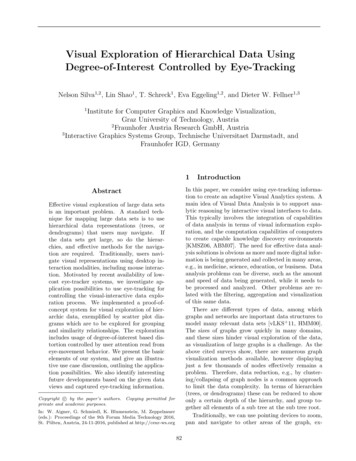
A16B3E1C3F2D10G2 H4J1K1I4L1 M1 N1 O1H4C3F2J1G2K1M1N1E1B3I4O1D10L1Figure 3. Result of dtree1.A16Figure 2. Node and link diagram (t) and corresponding strands model (d).3.2 Strand model of directory treesIn this section we describe how we can use Holton’smodel to create a three-dimensional model of a directorytree. The original model generates a binary tree whereas ingeneral a directory tree is not. However, we again obtaina binary tree by visualizing the directories as continuingbranches: At each branching point a sub-directory is splitoff and the other sub-branch is now a continuation of theparent branch. The order in which the sub-directories aresplit off, is given by their sizes : The largest sub-directoriesare split off first. The top figure of figure 2 shows a nodeand link diagram of a directory tree where the numbers indicate the size of files and directories. In the bottom figurethe corresponding strand model is shown.As in the original model the geometrical properties ofa tree are based on numbers of strands, here we define anumber of strands for a directory, say dir , as follows:XXstrands(d) f.sizestrands(dir ) d dlf flwhere we use the following data-structures for the directorytree.Directory record dl : list of Directory;fl : list of File;File record size : integer;type : String;Hence, a continuing branch of a large directory has manystrands and is represented by a thick and long first segment.This visual cue will help us when browsing a tree lookingfor space consuming files and/or directories.Below we give the recursive function dtree1(d) for thevisualization of a directory tree d. On the deepest level thefunction leaves is called which returns some geometry representing the file list it gets as a parameter. To navigatethrough the directory tree we use the pop function on a listwhich removes the first element of a list and returns thiselement as its result.dtree1(d)stem : cylinder ((0,0,0),(0,λ,0),ρ);if d.dl then return leaves(d.fl);s : strands(d); d1 : d.dl.pop(); d2 : d;s1 : strands(d1); s2 : strands(d 2);G 1 : R y (β) Rz ( αs2 /s) S( s1 /s) dtree1(d1 );G 2 : R y (β) Rz (-αs1 /s) S( s2 /s) dtree1(d2 );return stem T (0, λ, 0) (G 1 G 2 );A first implementation of the function leaves is similar todtree1: At each recursion level a leaf is split off and a stemand a few triangles depicting a stalk and a blade are generated with the same transformations applied as for the subbranches in dtree1. Figure 3 shows a result of the above algorithm. From the figure three visualization problems comeforward : (1) the continuing branches representing a directory can not be followed easily at a branching point and asa result it becomes unclear which sub-branch represents theparent; (2) directories with many sub-directories and/or fileslead to thin and long branches; (3) the leaves tend to clutterand do not give insight. In the following section we tacklethese problems.
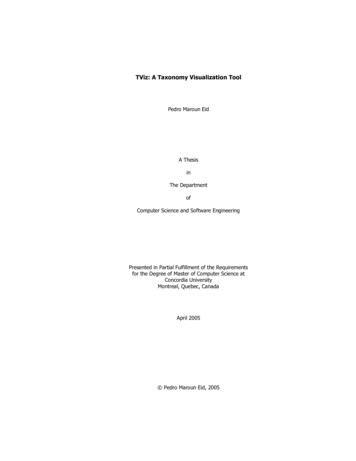
Figure 4. Continuation without (l) and with (r)extrusion.4 Refinements4.1Figure 5. Model without (l) and with (r) contraction.of the strands of d is split off. As a result the length of acontinuing branch is limited to at most λ/ε.Continuing branchesThe visualization of a directory by a continuing branchshould be clearly visible in the three-dimensional model. In[6, 1] sophisticated solutions are given, here we use a simplesolution since we are not interested in modeling a tree but invisualizing directory data. We refine our model by addinga smooth transition between two cylinders. This geometrictransition is simply created by adding an extrusion, along asuitably chosen spine, of the top circle of the parent cylinderto the bottom circle of the next cylinder in the continuingbranch (see figure 4). The difference between the smoothand the abrupt transitions makes clear what the status ofeach branch is. As an extra cue, branches at different levelsin the hierarchy are assigned different colors.dtree2(d,e)stem : cylinder ((0,0,0),(0,λ,0),ρ);if d.dl then return leaves(d.fl);s : strands(d); d1 : d.dl.pop(); d2 : d;s1 : strands(d1); s2 : strands(d2);if e 0 then f : ε*s else f : e;G 1 : R y (β) Rz( αs2 /s) S( s1 /s) dtree2(d1 , 0));G 2 : R y (β) Rz(-αs1 /s) S( s2 /s) dtree2(d2 , f -s1 ));if e 0 then return G 1 G 2else return stem T (0, λ, 0)(G 1 G 2 );Figure 5 shows an example: Long branches are eliminatedwithout sacrificing the clarity of the structure.4.34.2Files as fruitContraction of long branchesWhen for each sub-directory or file a separate stem andsub-branch are used, a large number of those leads to along sequence of stems, visible as a long and thin continuing branch. We improve the behavior of our model inthis respect by conditionally removing the stem in the subbranch of the continuing branch. Effectively, this replacesthe binary tree with a general tree. The function dtree2(d,e)results in a three-dimensional model of a directory tree dwhere only a stem is introduced if e 0. At the highest level dtree2 is called with e 0 indicating that thestem must be drawn, in the continuation of a branch e isset to εstrands(d) indicating that a stem (in the continuingbranch) is only drawn after at least a fraction ε [0, 1]To prevent cluttering of leaves we introduce an icon torepresent a list of files and their sizes. We model this iconas a fruit consisting of a sphere with spots for each file.The positioning of the, possibly different sized, spots on thesphere is done again with a method from botanical modeling. In [4] such a method is given, here we use a lessinvolved method given in [8]. In this last method items areplaced on a sphere using a so-called phi-ball, a sphere that isdivided in as many horizontal slices as there are items (herefiles) to be placed. The area of the slices (and equivalentlytheir height) is proportional to the size of the correspondingfiles. At each of the slices a spot is placed and each sliceis rotated β degrees with respect to the slice above it. Thespots may be represented by disks with an area in proportion
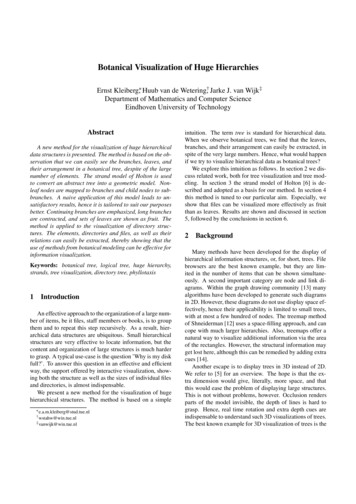
yQdh1hzxOPFigure 6. Phi-ball construction.xOt1Figure 8. Phi-ball with one (l) and many (r)files.BcTzFigure 7. Computation of cone parameters.to the size of the corresponding files. However, planar diskspasted on the sphere look irregular. Mapping of disks to thesurface of the sphere requires many polygons or an involvedtexture generation step. The use of cones is more efficientand leads to an attractive result, especially if the dimensionsand the position of the cones are chosen such that they aretangent to the sphere. Below a function phiball(fl,bot,top)is given that produces a sphere and cones for each file in thelist fl. The bot and top parameters, both in [ 1, 1] indicatewhich part of the sphere is sliced for positioning spots.phiball(fl,bot,top)Psize : f f l f.si ze;P : (0,0,1); O : (0,0,0); h : top; G : ;for each f f lQ : (0,h, 1 h 2 ); c : f.si ze/si ze; t : c2 1;B : (0,0,1/t); T : (0,0,t);G : Rx (-6 POQ)(cone(B, T, c/t)) R y (β)G;dh : (top bot) f.si ze/si ze; h: h dh;return G sphere(O, 1);The sphere is positioned in the origin and has radius 1 (seefigure 6). Each file’s cone has its axis along the z-axis anda hypotenuse with length c equal to the square root of theratio of the file size and the total size of the file list. Fromthis the top (T ) and base point (B) as well as the cone’sradius can be computed (see figure 7). A cone is positionedby rotating it along the x-axis over the angle 6 POQ. In thesubsequent iterations of the loop a cone is rotated along they-axis over β degrees. For β the use of 360/ϕ gives goodresults.With the function phiball the function leaves can be reimplemented by adding a stem to a phi-ball resulting in themodels in figure 8. The use of cones and their parameterization lead to the effect that large files emerge as large, thoughbounded cones, whereas small files appear as small disks.Color is used to indicate the file type. The parameter bot isset slightly higher than -1 in these examples to prevent thestem to obscure file cones.Showing a list of files by means of fruit as a phi-ballenhanced with cones, turned out to structure the massiveinformation in the visualization of directories. The use oficons for showing the information was advised in [2] in thecontext of cone trees. Our solution with phi-balls is alsoviable in that context.5 ResultsFigure 9 shows the results of the refined model andcan be compared to figure 3. The model representsthe C:\Winnt directory on a windows NT machine,the prominently visible ball shows the system32 subdirectory. Each cone with a yellow color on this ball represents a dll file in this folder. The model in this figure iscomprehensive and clean compared to the model in figure3. It is hence feasible to show even larger directory treesin one model. This is shown in figure 10 where the complete C:\ folder of the same machine is shown. The largestand first sub-directory that is split of in this model is the
Figure 9. Final model with contraction, extrusion, and phi-balls.C:\Program Files folder. The large green cone on topof the tree represents a file of more than 500 megabytes inC:\. The total tree consists of 47.551 files in 2.265 folders.Figure 11 shows a model of the same directory but with adifferent setting for α and β. The figures 12 and 13 showthe unix directory of one of the authors. The first directorythat is split off contains a big sub-branch with mostly bluecones representing postscript and pdf files. The phi-ballswith mostly red cones represent directories with image files.Figure 10. Complete hard disk with α 45 andβ 360/ϕ.Three-dimensional models can only be judged fairly inan interactive environment where an inherent problem asocclusion can be overcome by interaction on the model. Allimages were generated with an interactive system we haveimplemented to generate and visualize these models. Realtime performance could be achieved on a modern PC witha 3D-graphics card using some straightforward level of detail methods, such as adaptive accuracy and removal of verysmall elements.Hands-on experience with this system indicated thatusers are intrigued and stimulated by the visualization. Features such as large files (big cones), directories with manyand/or large files (big spheres), and directories with a largeoverall content (thick branches) could easily be spotted.The pattern and color of the cones on the phi-balls providea direct cue for the distribution and type of files. Finally,the resulting trees effectively show the files, the directoriesand their arrangements; in contrast to tree maps where thisinformation is harder to extract.Figure 11. Complete harddisk with α 90 andβ 0.6 ConclusionsWe have presented a new method for the visualizationof huge hierarchical data structures, based on methods from
Figure 12. Unix home-directory.Figure 13. Detail of figure 12.Referencesbotanical modeling, specifically the strand model of Holton[6] and the phi-ball of Lintermann et al. [8]. Naive application of such botanical models gives unsatisfactory results,but we have shown they can be customized to visualize largehierarchical structures in a clear and compact way.Two aspects deserve special attention. Firstly, the conecovered phi-ball is an effective icon for the visualization ofthe properties of a list of items, which we expect to be useful for other applications as well. Secondly, the branchesof the tree and the cones on the phi-ball hardly ever collide, despite the fact that no special measures were takento prevent this. Efficient use of space is an important topicin information visualization. To this end, nowadays mathematical methods (such as hyperbolic scaling), algorithmicmethods (such as the tree map algorithm), and physicallybased models (such as mass-spring models) are used. Themethods of botanical modeling and especially the conceptof phyllotaxis provide a surprisingly simple and very effective alternative solution.We have only just started to apply methods from botanical modeling for information visualization, and expect thatmany other applications can take advantage of this richsource of inspiration. Using our own work as an example, only a part of Holton’s original strand model has beenused. Texture and gravity could for instance be used to visualize other aspects of the data, such as the creation dateof files and directories; for other types of hierarchies theparametrization of for instance branching angles to the levelof hierarchy could be beneficial. In summary, natura artismagistra.[1] Jules Bloomenthal. Modeling the mighty maple. InB. A. Barsky, editor, Computer Graphics (SIGGRAPH’85 Proceedings), volume 19, pages 305–311, 1985.[2] Jeromy Carriere and Rick Kazman. Interacting withhuge hierarchies: Beyond cone trees. In Proceedingsof the IEEE Symposium on Information Visualization,pages 74–81, oct 1995.[3] Luc Devroye and Paul Kruszewski. The botanicalbeauty of random binary trees. In F. Brandenburg,editor, Graph Drawing 95, pages 166–177. SpringerVerlag, 1995.[4] Deborah R. Fowler, Przemyslaw Prusinkiewicz, andJohannes Battjes. A collision-based model of spiralphyllotaxis. In Edwin E. Catmull, editor, ComputerGraphics (SIGGRAPH ’92 Proceedings), volume 26,pages 361–368, July 1992.[5] Ivan Herman, Guy Melançon, and M. Scott Marshall.Graph visualisation and navigation in information visualisation. In B. Falcidieno and J. Rossignac, editors,Eurographics, 1999.[6] Matthew Holton. Strands, gravity and botanical treeimagery. Computer Graphics Forum, 13(1):57–67,March 1994.[7] Hideki Koike and Hirotaka Yoshihara. Fractal approaches for visualizing huge hierarchies. In Pro-
ceedings of the 1993 IEEE Symposium on Visual Languages, pages 55–60, 1993.[8] Bernd Lintermann and Oliver Deussen. Interactivemodeling of plants. IEEE Computer Graphics and Applications, 19(1):56–65, January/February 1999.[9] Benoit B. Mandelbrot. The Fractal Geometry of Nature. W.H. Freeman & Company, New York, NY,USA, 1977.[10] Przemyslaw Prusinkiewicz, Aristid Lindenmayer,James S. Hanan, et al. The algorithmic beauty ofplants. Springer-Verlag, New York, 1990.[11] George G. Robertson, Jock D. Mackinlay, and Stuart K. Card. Cone trees: Animated 3D visualizationsof hierarchical information. In Proceedings of ACMCHI’91 Conference on Human Factors in ComputingSystems, Information Visualization, pages 189–194,1991.[12] Ben Shneiderman. Tree visualization with tree-maps:A 2-D space-filling approach. ACM Transactions onGraphics, 11(1):92–99, January 1992.[13] Ioannis G. Tollis, Giuseppe Di Battista, Peter Eades,and Roberto Tamassia. Graph Drawing: Algorithmsfor the Visualization of Graphs. Prentice Hall, 1999.[14] Jarke J. van Wijk and Huub van de Wetering. Cushiontreemaps - visualization of hierarchical information.In G. Wills and D. Keim, editors, Proceedings 1999IEEE Symposium on Information Visualization (InfoVis’99), pages 73–78, Oct 1999.
We present a new method for the visualization of huge hierarchical structures. The method is based on a simple e.a.m.kleiberg@stud.tue.nl † wstahw@win.tue.nl ‡ vanwijk@win.tue.nl intuition. The term tree is standard for hierarchical data. When we observe botanical trees, we find that the leaves, branches, and their arrangement can easily .