Transcription
Visual Exploration of Hierarchical Data UsingDegree-of-Interest Controlled by Eye-TrackingNelson Silva1,2 , Lin Shao1 , T. Schreck1 , Eva Eggeling1,2 , and Dieter W. Fellner1,31Institute for Computer Graphics and Knowledge Visualization,Graz University of Technology, Austria2Fraunhofer Austria Research GmbH, Austria3Interactive Graphics Systems Group, Technische Universitaet Darmstadt, andFraunhofer IGD, Germany1IntroductionIn this paper, we consider using eye-tracking information to create an adaptive Visual Analytics system. Amain idea of Visual Data Analysis is to support analytic reasoning by interactive visual interfaces to data.This typically involves the integration of capabilitiesof data analysis in terms of visual information exploration, and the computation capabilities of computersto create capable knowledge discovery environments[KMSZ06, ABM07]. The need for e ective data analysis solutions is obvious as more and more digital information is being generated and collected in many areas,e.g., in medicine, science, education, or business. Dataanalysis problems can be diverse, such as the amountand speed of data being generated, while it needs tobe processed and analyzed. Other problems are related with the filtering, aggregation and visualizationof this same data.There are di erent types of data, among whichgraphs and networks are important data structures tomodel many relevant data sets [vLKS 11, HMM00].The sizes of graphs grow quickly in many domains,and these sizes hinder visual exploration of the data,as visualization of large graphs is a challenge. As theabove cited surveys show, there are numerous graphvisualization methods available, however displayingjust a few thousands of nodes e ectively remains aproblem. Therefore, data reduction, e.g., by clustering/collapsing of graph nodes is a common approachto limit the data complexity. In terms of hierarchies(trees, or dendrograms) these can be reduced to showonly a certain depth of the hierarchy, and group together all elements of a sub tree at the sub tree root.Traditionally, we can use pointing devices to zoom,pan and navigate to other areas of the graph, ex-AbstractE ective visual exploration of large data setsis an important problem. A standard technique for mapping large data sets is to usehierarchical data representations (trees, ordendrograms) that users may navigate. Ifthe data sets get large, so do the hierarchies, and e ective methods for the navigation are required. Traditionally, users navigate visual representations using desktop interaction modalities, including mouse interaction. Motivated by recent availability of lowcost eye-tracker systems, we investigate application possibilities to use eye-tracking forcontrolling the visual-interactive data exploration process. We implemented a proof-ofconcept system for visual exploration of hierarchic data, exemplified by scatter plot diagrams which are to be explored for groupingand similarity relationships. The explorationincludes usage of degree-of-interest based distortion controlled by user attention read fromeye-movement behavior. We present the basicelements of our system, and give an illustrative use case discussion, outlining the application possibilities. We also identify interestingfuture developments based on the given dataviews and captured eye-tracking information.Copyright c by the paper’s authors. Copying permitted forprivate and academic purposes.In: W. Aigner, G. Schmiedl, K. Blumenstein, M. Zeppelzauer(eds.): Proceedings of the 9th Forum Media Technology 2016,St. Pölten, Austria, 24-11-2016, published at http://ceur-ws.org82
Visual Exploration of Hierarchical Data Using Degree-of-Interest Controlled by Eye-Trackingpand/collapse nodes, or adjust the level of abstraction [GST13]. However, several problems may arisewith the mouse navigation, zoom and expand collapsestrategies. When the user pans a graph, the mouseclick can be anywhere on the graph, including emptyparts of it; also, when the user stops panning, themouse cursor is “parked“ somewhere in the visualization, and no useful information can be inferred regarding the user intents.Existing eye-tracking devices allow to track the fixation areas of a user in front of a display. Amongothers, eye-trackers are often used for evaluation purposes, or to experimentally study human visual attention. In our work we are interested in the question,if eye-tracking information can benefit the visual dataexploration process, in addition or as an alternative tostandard interaction approaches. Nowadays, we canuse a ordable eye-tracker devices [SZCJ16], like theEyeTribe system1 to monitor the behaviors of the userswhile exploring a visualization. According to our experience, the device allows a useful tracking of the usergazing on specific regions and individual nodes, on acomparably large tree to be explored.We present a concept and preliminary implementation of an approach to apply eye-tracking for the purpose of supporting visual exploration of large graphs.Our assumption is that the user gaze indicates areasof interest in a tree, and consequently we can use thisinformation to dynamically expand or compress partsof the tree. Furthermore, we can also capture a visualhistory of the exploration process during which a userexplores a tree view, with applications for example of‘replaying’ analysis sessions or documenting interesting findings done along the way. This paper is our firststep towards an experimental system by which we canexplore design alternatives for eye-based interactionand visualization, as well as to conduct user studies.2studies for capturing user eye movements as an inputmechanism to drive system interaction.Etemadpour et al. [EOL14] address eye-movementtracking on user studies regarding the accomplishmentof typical analysis tasks for projected multidimensionaldata, such as tasks that involve detecting and correlating clusters. The authors examine and draw conclusions on how layout techniques produce certain characteristics that change the visual attention pattern.In lab-based user experiments using eye-movementstracking, large and complex gaze trajectory data setsare generated. There is work which develops toolsto help understand eye-movement patterns [BKR 14].These should support the definition and explorationof a large number of areas-of-interest (AOIs). Eyemovement tracking data is usually analyzed using different methods [HNA 11] and visualization techniques[BKR 14]. Our work follows an AOI-based approach.One important question refers to the justificationof why should one use eye-movement tracking and notjust the typical pointing devices, such as, the mouse.Many past studies debate the correlation between eyemovement tracking and mouse movements. Thesestudies presented values from as high as 84% (in astudy from 2001) [CAS01], to 69% [Coo06], to as lowas 32% [RFAS08] (in a study from 2008) of correlationbetween eye and mouse movements. These results areusually dependent on the design of the user interfaces.Another relevant discussion is centered on the manyadvantages of using eye-movement tracking analysisand on how to perform a correct eye-movement tracking evaluation [JK03]. Eye-movement tracking allowsfor a fast and continuous tracking of the interest of theusers in real time, allowing the detection of moments ofconfusion, indecision and high interest regions [GW03].Also, previous studies discuss an important link between cognitive processes and eye-movements [Hay04].The accuracy of eye-movement tracking can be kepthigh by designing a user interface where the size ofthe areas of interest is big enough and in accordanceto the eye-tracker characteristics and the experimentsetup. More and more, new eye-trackers are also lessa ected by negative technical factors, e.g., the users’head movements that usually reduce the accuracy ofthe eye-tracker device and calibration difficulties.Related WorkWe briefly provide an overview of possible applicationsof eye tracking in evaluation, and as an interactionmodality. We also discuss visualization of hierarchicdata and degree-of-interest techniques.2.1Eye-Tracking and Applications2.2Eye-movement tracking is a method that is used tostudy, among others, usability issues in Human Computer Interaction (HCI) contexts. Pool and Ball[PB05] give an introduction to the basics of eyemovement technology, and present key aspects andmetrics of practical guidance in usability-evaluation1 https://theeyetribe.comHierarchy Visualization and Focus-andContextIn this work we consider visualization of hierarchicdata. While hierarchies arise in many contexts, oneprominent use of hierarchies is in data clustering. Generally, hierarchical graphs together with one of themany clustering techniques [MRS08] can form beneficial tools for the visual exploration of large data sets.(accessed 09/2016)83
Visual Exploration of Hierarchical Data Using Degree-of-Interest Controlled by Eye-TrackingThis visual exploration can be done in the form oftrees (or dendrograms), due to their potential for visual abstraction [CdART12]. In a hierarchical clustering, users may chose the level of detail by which theyexplore data. Areas more close to the root containmore aggregate information, and areas closer to theleafs include more detail data.An e ective interaction technique for navigatinglarge visualization spaces is to control the level of detail information shown throughout a given visualization. Furnas [Fur86] defines a degree of interest function (DOI-function) where to each node in the graphstructure an interest score is defined. This score inturn is used to expand important areas while reducing other less important areas. Lamping et al. [LR96]demonstrated a focus context (fisheye) scheme for visualizing and manipulating large hierarchies. Generally, the expansion or reduction can operate on di erent aspects, e.g., on the geometric, semantic or dataoriented level. Previous work [PGB02] was done regarding the dynamic re-scaling of branches of the treeto best fit the available screen space with an optimized camera movement. Concerning the aspect ofdeveloping adaptive visualizations, an important survey [CK15] was presented that highlights many techniques for emotion-driven detection, measurement andadaptation, among others. These are very relevant forour concept of adaptation based on degree-of-interest.3Input to the clustering is a distance matrix betweenthe set of scatter plots. The latter is obtained making use of image features, which have been shown towork well for the comparison of scatter plots [SvLS12].More precisely, we compute a 25-dimensional intensityhistogram for each plot. Then, we use the Euclideandistance between histograms to compute the distance(average linkage) of each plot. Using these visual features, the scatter plots can be arranged hierarchically(e.g., in a tree or circular layout) and the explorationfor visually similar plots becomes more efficient.3.2Typically, there are a large number of scatter plotviews for a high-dimensional data set, these viewsgrows quadratically with the number of data dimensions. Specifically, an n-dimensional numeric data setcan be represented in n (n2 1) distinctive views using two distinctive dimensions. To facilitate the exploration, we take the computed feature vectors ofthe scatter plots and apply a hierarchical clusteringto structure the plots based on their visual similarities. Thus, we receive a structured representation ofthe space of scatter plots that arranges similar scatterplots spatially close. To create the hierarchy structure,we compute the average distance (average linkage) ofeach scatter plot and build a dendrogram tree, whichcontains all scatter plots on the leaf node level, seeFigure 3. As usual, the dendrogram height describesthe similarity (histogram distance) of the scatter plots.Concept for Visual Exploration ofHierarchical Data Guided by EyeTracking3.3Next, we introduce our concept (Figure 1) for exploring hierarchical data based on degree-of-interest,guided by eye tracking. We will exemplify our conceptby using scatter plots as the leaf elements in the hierarchy, which are to be explored by a user. The hierarchy is created by a hierarchical clustering algorithmusing feature-based similarity between scatter plots.Our approach relies on eye-tracking to determine thedegree-of-interest, which in turn distorts (i.e., magnifies/compresses) the hierarchy display.3.1Considered Application:Scatter PlotsHierarchical Layout of Scatter PlotsDegree of Interest for Navigation of theHierarchyThe above described dendrogram provides a usefulspatial organization of the input space (scatter plots).Yet, the tree may still be large and complex, especiallyif we have a large number of leaf and internal nodesto inspect and compare. Hence, we introduce spatialdistortion to enlarge parts of the tree currently beinglooked at by the user, while visually aggregating theremainder of the tree. To this end, we apply eye tracking using an EyeTribe (see Section 1) setup to trackuser gazes. Specifically, we measure the user attention on the tree nodes to compute a degree-of-interest(DOI) score for the elements of the dendrogram. Initially, we show the overall dendrogram using semanticzoom to fit the whole hierarchy onto the display space.From there, the user starts the graph exploration fromany point in the view space. While the user navigatesthrough the view space, the eye tracker captures thegaze path. When the user explores specific branchesof the tree or local nodes, the eye gaze path and eyefixation durations are recorded for each link and nodeof the tree. Therefore, besides a measure of interestHierarchy ofFor the exploration of complex data sets, target visualization techniques such as scatter plots, parallel coordinates or glyph representations can be used to discover interesting findings in the data. In our approach,we rely on a set of scatter plot visualizations to represent all pairwise combinations of a high-dimensionaldata set. To explore a potentially large set of scatter plots hierarchically, we apply hierarchic clustering.84
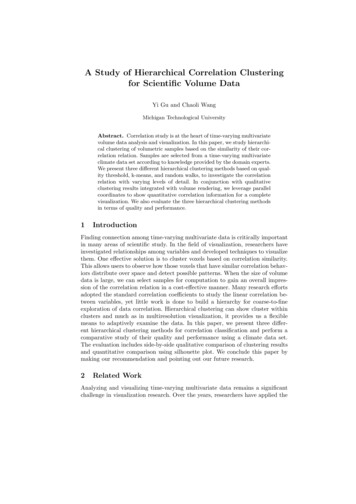
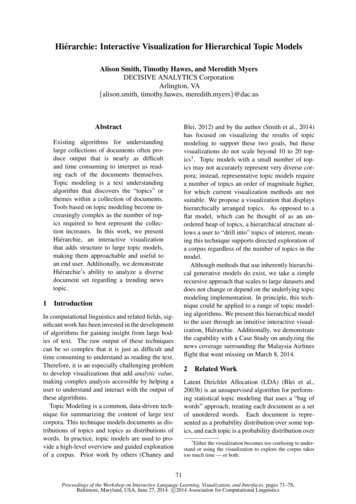
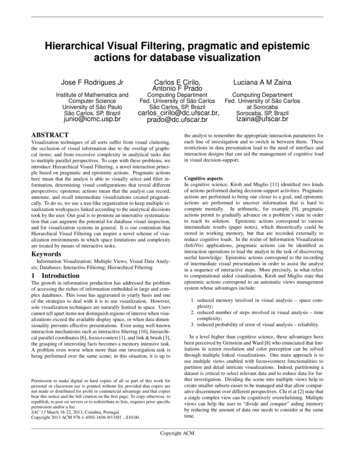
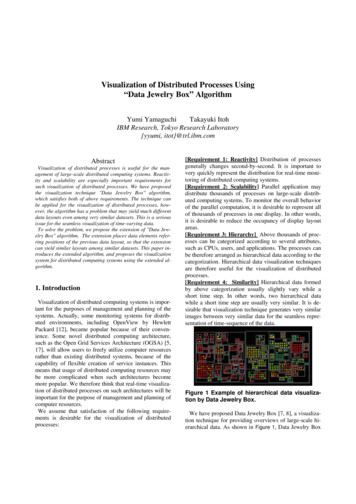
Visual Exploration of Hierarchical Data Using Degree-of-Interest Controlled by Eye-Trackingbased on similarity between scatter plots, we can nowupdate interest metrics based on time and number ofvisits to a node.Potentially, this recording can also be done for local parts of the scatter plots, i.e., tracking if the useris dedicating more viewing time to certain local areasin a plot. Such analysis may be useful to detect e.g.,correlations, dense areas or clusters in a given plot.Each scatter plot involves the representation of variables (for x and y axes respectively), the interest of theuser on these variables (axis) can also be tracked. Inthe next section, we apply the current eye gaze location in order to focus the display using semantic zoom.Conceptually, more applications are possible (see alsoSection verview of dendrogram areas visited so far (see Figure2 for a gaze history view). This view allows to keeptrack of visited and unvisited areas, and constitutesinput for further data analysis (see also Section 5).Figure 2: Gaze History Mock-up: It can be activatedin the navigation panel. The user can track tree areasexplored so far by an overlaid trace path (red line). Itserves as a global map of explored/unexplored areas,and it is used for further analysis (see Section 5).UsingWe apply eye-movement information to allow the userto navigate through a hierarchy of clusters of scatterplots using semantic zoom. We define an eye-trackingmode, which if enabled, controls the expansion and collapsing of sub-trees in the display based on eye fixation. Specifically, the area where the user looks at is visually expanded, revealing the scatter plots under thesub-tree. The neighboring (remaining) sub-trees arerepresented using just node and link symbols. Whilethey do not show particular scatter plots, this reducedrepresentation is still indicating basic data propertieslike number of scatter plots represented, or structureof the similarity relationships within the dendrogram.3.5Benefits of Our ApproachWe did informal, preliminary tests of our proposednavigation with 10 users. The feedback so far was positive, both to the semantic zoom mode and the gazehistory view. The navigation was considered as rathersmooth, and users can navigate without larger difficulties. Just by looking slightly away in the tree view, thecorresponding movement is initiated in a very intuitiveway. This facilitates the entire process of exploring thedata in the tree, i.e., the view panning is synchronizedwith the field of view and the eye-movements of theuser. When the user stops using the eye-based navigation, attention information starts to be collectedagain (eye-gaze duration on each area-of-interest) andit is the basis for the analysis of user interest detectionand possible subsequent recommendation of interesting views. Note that in our concept we consider onlygaze-based navigation. Of course, we can rely in addition on mouse/keyboard input to facilitate navigation,e.g., for labeling, saving views/bookmarking, etc.4Implementation and ApplicationTo test our approach, we developed a proof-of-conceptallowing the exploration of a large tree (dendrogram).Figure 1: Concept: Exploration of large scatter plotspaces. The user eye-gaze is detected, leading to anexpansion of the focused sub-tree (center rectangle).The remaining data is shown using a node-link representation (context, outside center rectangle).4.1System ImplementationIn our tree visualization, the leaf nodes are composedof visual representations of the data, i.e., scatter plotswith pairs of data attributes. We use our own modified version of the JUNG system [OFWB03] for thetree visualization. We made changes on the adjustment of the lens size in the view space and positioning of the lens, now they are controlled by user eye-When the user stops the eye-tracking mode, the application goes back to a state where it tracks only theuser interest on each specific node, i.e. eye-gaze duration on each node (no pan control). We also show an85
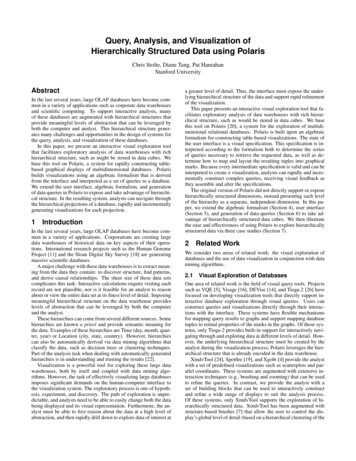
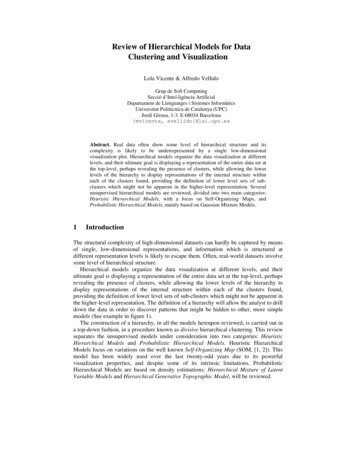
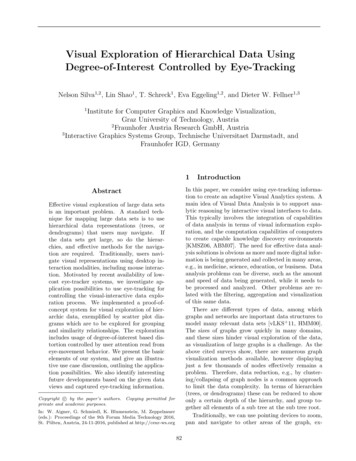
Visual Exploration of Hierarchical Data Using Degree-of-Interest Controlled by Eye-Trackingmovements and updated in real-time. We created acustomized tree layout to display color-coded nodesaccording to the computed similarity distance measure(darker color lower similarity), and also the abilityto display visual representations of the data on the leafnodes, i.e, scatter plots.The initial preset for DOI specification is the calculated similarity distance between scatter plot images.For this calculation, we make usage of a basic descriptor from the Java Image Processing Cookbook 2 that isbased on the average calculation of 25 color triples foreach image. After performing the comparison betweeneach image using the descriptors, we create a distancematrix with the computed distances between all images. This matrix is handed out to an agglomerativehierarchical clustering algorithm [Beh16].We tested our system with several hierarchical trees.Here, we illustrate the application of a hierarchical treeexploration of our data set. At the root and top subtrees we can find information about clusters of similarscatter plots, and at the leafs we find individual scatter plots. For this proof-of-concept we use a dendrogram comprising 269 scatter plots (leaf nodes) and 536edges. Figure 3 shows a zoomed in view of the tree,the color-coded nodes according to distance similarityof the scatter plots, and the circular zooming lens (ingray color). In the navigation panel (top-right corner),we can get an overview of the entire tree size and respective available view space. The current view size(depending on the zoom level) and location is denotedby a white rectangle. The lens can be used to perform a close zoom into the scatter plot image, and itcan be used to activate the display of a di erent visualrepresentation of the data.4.2Our data set is retrieved from the Eurostat 3 datarepository, which provides a collection of data setscontaining information on EU related topics (e.g.,economy, population and industry). We use a preprocessed data set from preliminary work [SSB 15],which contains 27 statistical attributes from 28 EUcountries showing temporal changes over time.All navigation actions presented in the following examples illustrate a typical usage of our navigation system. Figure 4 shows an example of an ideal view overa small data portion, where the user is able to see themajority of the data. Practically, for larger data setsusers will often have a more narrow view over the entire tree, depicted in Figure 5 with the 3 narrow views.Figure 4: Ideal Case: Users can view several clustersof related scatter plots at once. Due to limitations ofdisplay space, this is often not possible, hence the needfor adaptive visualization for navigation.The navigation order (view sequence) followed bythe user on these narrowed views can be random, itmight just follow the similarity distance measures (depicted by the color-coded node rectangles). Figure 5,shows that the user first moved to view V1, where agroup of interesting clustered scatter plots is visible(Figure 6). In view V1, the system detects a high gazeduration and infers that the interest is on one of thescatter plots (marked with ”*”). After an in-depthinspection of this area, the user navigates to a viewV2 (Figure 7) over another group of clustered scatterplots. The next most interesting and similar scatterplot (yellow color) is occluded in view V2 and it isonly visible in view V3 (Figure 8).It might take time until an interesting scatter plot(view V3) is spotted by the user. Also, there mightexist other interesting scatter plots in another part ofthe tree, in a more far, and yet hidden location, e.g.,Figure 9.Figure 3: Zoomed-in view of the hierarchical tree. Themouse wheel can be used to: increase/decrease the lensmagnifying ratio; increase/decrease the size of the circular zooming lens (gray circle) by clicking and dragging its border. A navigation panel (top-right corner)gives an overview of the actual position in the tree.2 JavaApplication3 Statistical Office of the European Union (http://ec.europa.eu/eurostat). Accessed 09/2016.Image Processing Cookbook (http://goo.gl/FBXbjp)86
Visual Exploration of Hierarchical Data Using Degree-of-Interest Controlled by Eye-TrackingFigure 7: View 2: The user moves to a new location,but misses an interesting scatter plot that is occludedon a top location.Figure 5: In practice, users may have limited viewsover a large space that must be explored. Therefore,the views (V1, V2, V3) might be limiting and not following an ideal sequence of exploration that would leadto finding interesting factors and to the creation of auseful mental model while exploring the data set. Wetake the eye-gaze duration time in account to inferabout the interest of the user.Figure 8: View 3: User navigates to this location andfinds an interesting scatter plot related to view V1.information presented, but also to capture longer sequences of visual exploration. The analysis of suchcaptured data presents manifold opportunities to enhance the analysis process. For example, similar toprevious work on navigation recommendations for exploring hierarchical graphs [GST13], approaches couldbe developed to suggest what new parts of the treeshould be explored next by the user.For now, our user focus model considers all elementsof the tree (inner nodes and scatter plots). Given sufficient tracking resolution, we may apply the degreeof-interest concept also locally within a focused scatterplot. There are numerous ways to heuristically compute interest measures from eye-gaze fixations, fixationsequences, and gaze recurrences. Examples includelearning relevance of local patterns, or deducing datagroups of interest to a given user or analysis session.In the future, we hope to leverage such informationand detect important aspects of the analysis problemat hand (e.g., whether there is exploratory or confirmatory analysis going on in a given session), or detectthe level of user expertise. Depending on this infor-Figure 6: View 1: Realistic view of a first set of scatterplots. The user is focused on a set of scatter plots andunaware of other interesting locations of the tree.In summary, our example merely demonstratessome of the challenges associated with the explorationof large graphs. The duration of the gazes can be usedto expand or collapse sub-trees and hence provide amore organized (less cluttered) overview of the data,reducing the risk of getting lost in the exploration oflarge dendrogram trees. However, our measures computed directly from the location of the gazes are onlya first step to control the views. We plan to collectdata about the eye-movement scan paths and respective eye-gaze durations, as well as recurrences to develop more adaptive hierarchy views.5Discussion and ExtensionsWe implemented a proof-of-concept system for whichwe see numerous extension possibilities. First, our solution allows not only to adjust the amount of visual87
Visual Exploration of Hierarchical Data Using Degree-of-Interest Controlled by Eye-Tracking6ConclusionWe presented a concept for visual exploration of hierarchically organized data, that relies on eye-trackingto steer the level of resolution shown. We assumethat long gaze fixation times indicates user interestand hence can be used as a proxy to control the visualdisplay of large data. Our e ort extends previous workby a new user interface, allowing the navigation andthe setting of the degree-of-interest to be determinedby eye-movements, and it can be applied on both desktop screens or larger displays (e.g., using wearable eyetrackers). We applied this idea to the specific problemof comparing scatter plot diagrams, and hence supporta type of meta-visualization: the elements in the treeare complex objects (visualizations). To this end weapplied dendrogram computation based on image features, an approach which may help to overview largeamounts of data views by grouping these for similarity. We have shown illustrative use cases for how eyetracking can enhance a hierarchical data visualization,by mapping eye-gazes to degree-of-interest representations. Yet, our work is in an early stage and wesee ample areas for future work. Future work includeshigh gaze-tracking precision on each node, refinementof interaction operations, view recommending, adaptive visual representations, and analysis provenance visualization. Finally, evaluation of our approach shouldbe done in comparison to non-eye-tracking controlsto qualitatively or quantitatively assess strengths andweaknesses of the approach.Figure 9: View 4: In a more far location (from V1, V2and V3) the user notices that there is another interesting scatter plot worth investigation.mation, the system may adapt its presentation andfunctionality accordingly. Also, a view recommendermodule may prevent the user from repetitively goingto already examined areas in the display, suggesting instead, previously unseen parts of the view space, basedon analysis of the eye-movement (scan) path. To thatend, it is interesting to ask how one can do suggestions of other scatter plots to be explored, e.g., basedon visual or data-driven similarities.Another idea is to choose adaptively di erent visualrepresentations on the nodes based on advanced interest measure computation. For example, in our currentvisualization approach (scatter plots) we might wantto change dynamically between scatter plots, table representation, parallel coordinates visualization, or regression or clusters models computed for a given scatter plot. Also, an interest function should be adaptivealso regarding time, e.g., during a longer or repeatedanalysis cycle. Such interest functions might take intoaccount di erent objectives, e.g., the user might wantto explore the most dissimilar clusters of scatter plots,or explore all scatter plots that have a certain shape.Depending on these objectives the interest functionmight need to be adjusted.ReferencesWe also mention that our gaze path visualizationcould be enhanced to work as an overview tool torepresent explored/unexplored regions. A gaze pathmight eventually serve as a visual history of a wholeexploration process. Therefore, we may extend a givengaze path by annotating certain views visited (e.g.,scatter plot thumbnails) at certain points in the gazepath (e.g., exceptionally long or short fixation times).Appropriate visual design might communicate a wholeanalysis session in a single image, which would be avaluable tool for reproducibility and communicationof analysis sessions.[ABM07]Wolfgang Aigner, Alessio Bertone, and SilviaMiksch. Tutorial: Introduction to Visual Analytics, pages 453–456. Springer Berlin Heidelberg, Berlin, Heidelberg, 2007.[Beh16]Lars Behnke. Implementation of an agglomerative hierarchical clustering algorithm in java.,09 2016.[BKR 14]T. Blascheck, K. Kurzhals, M. Raschke,M. Burch, D. Weiskopf, and T. Ertl. Stateof-the-Art of Visualization for Eye TrackingData. In R. Borgo, R. Maciejewski, and I. Viola, editors, EuroVis - STARs. The Eurographics Association, 2014.[CAS01]Mon Chu Chen, John R. Anderson, andMyeong Ho Sohn. What can a mouse cursor tell us more?: Correlation of eye/mousemovements on web browsing. In CHI ’01 Extended Abstracts on Human Factors in Computing Systems, CHI EA ’01, pages 281–282,New York, NY, USA, 2001. ACM.[CdART12] Stéphan Clémençon, Héctor de Arazoza, Fabrice Rossi, and Viet-Chi Tran. Hierarchi-88
Visual Exploration of Hierarchical Data Using Degree-of-Interest Controlled by Eye-Trackingcal clustering for graph visualization. CoRR,abs/1210.5693, 2012.[CK15]Daniel Cernea and Andreas Kerren. A survey of technologies on the rise for emotionenhanced interaction. Journ
2.2 Hierarchy Visualization and Focus-and-Context In this work we consider visualization of hierarchic data. While hierarchies arise in many contexts, one prominent use of hierarchies is in data clustering. Gen-erally, hierarchical graphs together with one of the many clustering techniques [MRS08] can form bene-