Transcription
TViz: A Taxonomy Visualization ToolPedro Maroun EidA ThesisinThe DepartmentofComputer Science and Software EngineeringPresented in Partial Fulfillment of the Requirementsfor the Degree of Master of Computer Science atConcordia UniversityMontreal, Quebec, CanadaApril 2005 Pedro Maroun Eid, 2005
CONCORDIA UNIVERSITYSchool of Graduate StudiesThis is to certify that the thesis preparedBy:Pedro Maroun EidEntitled:TViz: A Taxonomy Visualization Tooland submitted in partial fulfillment of the requirements for the degree ofMaster of Computer Sciencecomplies with the regulations of the University and meets the accepted standards with respect to originalityand quality.Signed by the final examining committee:ChairDr. Vasek ChvatalExaminerDr. Sudhir MudurExaminerDr. Nematollaah ShiriCo-supervisorDr. Volker HaarslevCo-supervisorDr. Peter GrogonoApproved byChair of Department or Graduate Program DirectorDr. Nabil Esmail, DeanFaculty of Engineering and Computer Science
AbstractTViz: A Taxonomy Visualization ToolPedro Maroun EidThe Semantic Web is an emerging science in the world of computer informationprocessing. RACER, a robust semantic web engine, represents the core of a semantic websystem. The engine offers various inference services that return information about a givenontology, for instance, to compute its associated taxonomy of concept names. Thetaxonomy is generated in a form called the “TBox subsumption hierarchy” although it isnot necessarily a true hierarchy. Since humans are more comfortable reading a graphicalstructure than a textual one, RACER needs a visualization tool in order to visualizetaxonomies after processing them. Also, a graph delivers statistical information inaddition to its easy interaction capabilities.In this thesis, we present TViz, a tool capable of visualizing large numbers ofnodes representing the TBox subsumption hierarchy, using the Cone Tree layout. TViz,customized for taxonomy visualizations, gets its input from a text file that is created afterstreaming the information from RACER. TViz consists of three components: (1) a parserthat parses the information obtained from the RACER server using a specific grammar,(2) an engine that simplifies and changes the non-hierarchical structure into a hierarchicaltree, and (3) a graphics engine that graphs the hierarchical tree using the Cone Treelayout. The graphics engine handles the graphics, the user interface, and tools and iswritten using OpenGL and GLUI multiplatform libraries. TViz implements useful toolsfor an easy exploration of a dense environment such as the Compass, the Local View andthe Information Window and is implemented using standard C/C multiplatformlibraries.iii
AcknowledgementsI take this opportunity to thank all those who accompanied me all through these years ofstudy as well as provided me with moral, intellectual, and financial help.A special thanks to my great supervisors Dr. Peter David Grogono, Computer Graphics,and Dr. Volker Haarslev, Semantic Web, for their support, guidance, and encouragementtowards the realization of this research thesis.And, finally, many thanks to the Concordia Community, my great and lovely homeMontreal, and all my friends, fellow students, and supporting family.iv
Dedication“Do not follow where the path may lead.Go, instead, where there is no pathand leave a trail,”Ralph Waldo EmersonTo Chawki, Josette, Georges, and Honorée Claris with all my love and appreciation.v
Table of ContentsTable of Figures. viiiTable of Tables . ixTable of Equations . x1Introduction. 11.1 Objective . 11.2 Approach. 21.3 Background . 41.3.1 Hyperbolic Trees. 51.3.2 Tree Maps . 71.3.3 Cone Trees . 81.3.4 Other Techniques . 91.3.5 Summary . 111.4 A First Attempt . 121.5 Current version. 152The Parser. 162.1 The Grammar . 162.2 The Symbol Table. 202.2.1 The Structure. 212.2.2 Triples . 223The Cone Tree . 243.1 The Cone Tree Structure. 243.1.1 The Hierarchy . 24vi
3.1.2 The Layout . 263.1.2.1The Cone Base Radius . 273.1.2.23D Node Position. 283.2 The Cone Tree Interface . 313.2.1 The Tree Graph. 323.2.2 OpenGL Picking. 333.2.3 Local Node View . 343.2.4 Node Searching. 344The Grapher . 364.1 The Main View . 364.2 The Main View GLUI Controls. 394.3 The Compass. 424.4 The Local View. 434.5 The Information window and the Console. 454.6 The Driver Program . 475Stress Generator. 496Test Case . 517User Output . 548Future Work. 569Conclusion . 6010 References. 61vii
Table of FiguresFigure 1: System scalability and dataset size. 5Figure 2: A graph in 3D Hyperbolic space (H3). 6Figure 3: Tree Map Layout and Enclosure Property . 7Figure 4: The 3D StepTree Application. 7Figure 5: Cone Tree layout . 8Figure 6: Zarrad's TBox Visualization Tool . 9Figure 7: OilViz3D Prototype for a 179 nodes tree. 10Figure 8: Previous version of TViz. 13Figure 9: a Triple example. 16Figure 10: The Symbol Table . 21Figure 11: A Triple . 22Figure 12: Carrière and Kazman. 28Figure 13 : Main View of “galen.tree” . 37Figure 14: The GLUI Controls Window. 39Figure 15: The Compass Window (local). 42Figure 16: The Compass Window (general). 42Figure 17: The Local View Window . 44Figure 18: The Information Window. 45Figure 19: The Console Window. 46Figure 20: TViz: A Taxonomy Visualization Tool. 55Figure 21: TViz: A Taxonomy Visualization Tool 2. 55viii
Table of TablesTable 1: Grammar used to parse the tree files . 17Table 2: Lexer definitions. 18Table 3: Sorted Sequence. 25Table 4: Test Node Specifications . 51Table 5: Performance Table. 52Table 6: Frame Rates . 53ix
Table of EquationsEquation 1: Carrière and Kazman and our version. 27Equation 2: Calculating Positions. 29Equation 3: Maximum Circumference. 30Equation 4: Initial Radius . 30x
1 Introduction1.1 Objective"The Semantic Web is an extension of the current web in which information isgiven well-defined meaning, better enabling computers and people to work incooperation." -- Tim Berners-Lee, James Hendler, Ora Lassila, The Semantic Web,Scientific American, May 2001.The Semantic Web is the combination of large amounts of information andmeanings to create an efficient representation of data that can be shared among machines.This is useful mostly to allow machines to efficiently find the information required byweb users. The Semantic Web is mainly composed of four components: ontologies,semantic web engines, knowledge bases, and agents. “An ontology defines the commonwords and concepts (meanings) used to describe and represent an area of knowledge, andso standardizes the meanings.” [32] An ontology is processed using the semantic engine’sinference services to yield a consistent knowledge base. A knowledge base is a formalversion of the ontology. Users will then interact with the engine, through an agent, whichcarries their query and retrieves the relevant data from the engine. Ontology creators nowneed some tool that gives them an idea about the overall structure of their ontologies inorder to verify whether or not they are well elaborated and meaningful. The ontology ispassed to the semantic engine which reveals the consistency and the latter produces anassociated knowledge base. A knowledge base is normally constituted of two importantparts: the ABox and the TBox. The ABox, standing for Assertional knowledge box, holdsinformation about individuals or instances of concepts. The TBox, standing for1
Terminological knowledge box, holds information about the concepts and thesubsumption hierarchy information. The best way to know if the representation of theoriginal ontology is correct or to look at whatever data it holds is to examine some kindof representation of that TBox. The semantic web engine has a function that streams theTBox subsumption hierarchy. This stream is then dumped into a text file, known by theextension “.tree”. This text file can contain many thousands of nodes and can be as largeas one gigabyte. The user will eventually get confused when reading this large text file.The dataset size of a manual interaction of a user trying to figure out this set’s relations orconnections is known to be at most 30 nodes [10]. So, eventually, there is a need for atool that shows this dataset visually along with the connections between its nodes. Also, itwould be used to deliver some statistics about the nodes to be graphed like theconcentration of nodes on different levels.1.2 ApproachThe goal of this research is to visualize a huge number of nodes which represent asemantic structure. This structure is generated by RACER, a semantic web engine that isgiven an ontology as input and after processing it yields a non-hierarchical tree-likerepresentation. A node in this tree-like structure may have multiple parents. Theimplementation of this project was performed using a component based design. First, aparser was created that parses the input according to a specific grammar. This input, ifcorrect, would be available in a table called the “symboltable” using a list data structure.The symboltable holds a set of triples as defined by the requirements of the input andaccumulates all information concerning a certain concept in its corresponding triple node2
in the symboltable. A triple is defined to be a record that holds information about thenode, its parents, and its children. Next, the symboltable is processed by the engine of theapplication and is checked for logical consistency; the structure should be changeable to ahierarchical entity. This non-hierarchical structure is then converted to a hierarchical treethat will be used in the layout algorithm. This is done by removing all the factors thatmake it non-hierarchical, e.g. any multiple inheritance should be made to follow a singleparent. Finally, this hierarchical entity is graphed in a certain layout. One of the bestlayouts suitable for huge hierarchies is the Cone Tree hierarchical layout [14]. This layoutmodels the nodes, their parents and their children in a cone shaped layout.The main layer that binds all the components of the project is the “Grapher”. Thiscode has the function of passing an input data file representing the tree to the parserwhich in turn parses the input, that is, it checks the input for lexical and grammaticalerrors, and as a result, stores it in the symboltable. Then the “Grapher” passes this table tothe Cone Tree Interface where it is processed and made hierarchical. The Cone TreeInterface initializes a Cone Tree Structure with static attributes, ready to be graphed.Finally, the display function of the “Grapher” graphs the tree and maintains a userinterface to allow users to perform some common user tasks for browsing and exploringthe tree. Some tools are added to the main hierarchy viewer to make users comfortablewith their exploration. The idea of these tools came from the needs that adventurers havewhen they go on any common exploration of an unfamiliar region. The three mostimportant things these explorers would need to have are a map, a locator that gives themtheir location and a datasheet that specifies specific data about important points to lookfor. Using the same kind of reasoning, tools for the system were created and these3
include: the Compass which acts as a locator, the Local View which acts as a detailedview of the node in focus, and the Information Window that displays some text info aboutthe actions users are taking and the node that they are focused on. Many more featuresare implemented in the main viewing window, for example, picking and searching for aspecific node. As a final step to test the whole, a synthetic data generator, called the“Stress Generator”, was created to stress the application and detect its limits. Finally, atest application was created to test multiple instances of the Stress Generator on TViz.These resulted in a set of output values which are presented for usability statistics. All ofthese are discussed further in this thesis.1.3 BackgroundPrevious research that is relevant to this project concentrated mainly on thedisplay of large hierarchies in 3D computer graphics. Various methods were suggested indifferent technical papers, in addition to many cognitive studies, that deal with the humanmind’s understanding of graphical and especially large graphical structures. A lot ofefficient algorithms and layouts work very well in 2D, however, concerning the capacityof nodes to be displayed, it is obvious that 3D can visualize much more; so 3Dvisualization was adopted. Previous research suggests efficient layouts for displayinghuge hierarchies ( 1000 nodes). Now it is clear that one can fit many more nodes into thespace using 3D rather than 2D, however, the question is, will there be usercomprehension of this dense visual space? Using a specific layout, the graph can bevisualized in a structured way. The idea is to visualize something useful but to be carefulnot to overtax the user’s cognitive processing capabilities. In the following, we review4
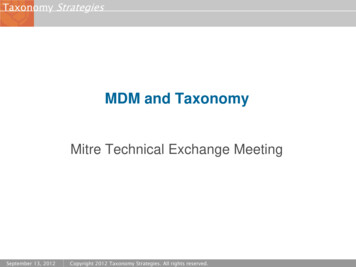
most of the commonly used graphing layouts and methods to visualize large datasets in astructured way along with similar research that was conducted around the same topic.1.3.1 Hyperbolic TreesThe Hyperbolic tree layout, anew and well known layout to displaylarge hierarchies as explained by Hong[17], draws very large structures, up toaround 120,000 nodes. Hyperbolictrees have been under study since 1995by Lamping et al. [19]. A pioneer inFigure 1: System scalability and dataset sizehyperbolic trees is Tamara Munzner[10 and 20]. Munzner, in 2000, developed a highly stable system; referred by H3, as herPhD implementation. H3 mainly graphs internet hyperlink structures of websites. Itscaled to datasets of over 100,000 nodes by carefully choosing a spanning tree as a layoutbackbone. As a performance rating, H3 displayed 110,000 edges in 12 seconds givenDFS input [11]. The scalability of H3 with respect to other existing systems is shown inFigure 1 taken from [10]. As Munzner described, larger trees tend to display as largeneighborhoods instead of the global overview which might lead to cognitivedisorientation of the user. Hyperbolic trees have innovative algorithms; they are simplestructures that make it fast and easy to process large hierarchies. The main idea behindhyperbolic trees is to map the hierarchical structure onto a hyperbolic function or onhyperbolic space. H3 uses a projective model to project the infinite space onto finite 3D5
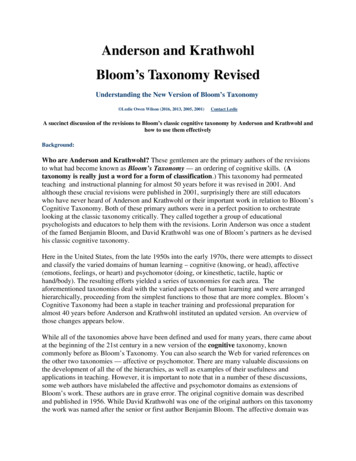
Euclidean space. Another model would be the conformal model, also called Poincarédisc, which preserves angles while plotting the connecting lines onto arcs.The projective model distorts angles whilekeeping lines straight as shown in Figure 2also courtesy of [10]. It allows the encodinginto 4x4 matrices that can be used to representhyperbolic transformations. The main reasonfor using this model is to allow 4x4 matrixoperations to be done using the optimized 3DFigure 2: A graph in 3D Hyperbolic space(H3)libraries on modern computers and graphicsprocessors. This mapping behaves as a Focus Context view that shows the local connections of the parents and children of the nodein focus while still giving some information about the general layout of the tree. Farnodes appear packed on the circumference. All what is in between has a kind ofinterpolation effect due to the hyperbolic function mapping. Hyperbolic trees have to begraphed using hyperbolic space in 3D or hyperbolic functions in 2D. Although they arefast and can manage the visualization of many nodes, they tend to disorient users becausethe layout does not give them a sense of where their position is with respect to the wholespace or tree. The root node would appear similar to any child node with the samenumber of children.6
1.3.2 Tree MapsTree Maps, another famous2D layout introduced in 1991 byJohnson et al. [12], divide the spaceof each node among its children andthen subdivide recursively until thewhole screen space represents theFigure 3: Tree Map Layout and Enclosure Propertygiven nodes as shown in Figure 3[33]. However, this layout is best used in software visualizations and business. Someimplementations of tree maps have been realized in 3D and these allow the viewing oflayers representing the underlying levels as shown in Figure 4 [31].The drawback in this layout is that it does notpresent connections between the nodes. Thislayout optimizes the use of the available space butit makes it much harder for the viewers tounderstand the relational structure of the wholeentity. Tree Maps are considered to be anFigure 4: The 3D StepTree Applicationenclosure kind of graphing since they includesub-nodes in the node space of their parents usually represented by rectangular areas foroptimized area use.7
1.3.3 Cone TreesCone Trees [14] has been initiated in 1991 by Robertson et al. It has been underdevelopment for many years and many improvements have been suggested.Figure 5: Cone Tree layoutCone Trees give a straightforward hierarchical representation of the entity in question.They do not alter any of the visual hierarchy representing the semantic meaning of thetext. This property is very appealing visually and logically to the user. The drawbackusing this kind of layout is that it is harder to graph nodes in 3D than it is in 2D so thealgorithms are a little more complicated and take more time in processing. The largestnumber of nodes graphed for a directory structure using the Cone Tree layout given byCarrière and Kazman in [15] is 5000 and, as the authors described, the far nodes withrespect to the viewer’s eye are no longer identifiable starting with datasets larger than1000 nodes. Tulip, “a huge graphs visualization framework” [16], is being developed inthe University of Bordeaux 1, France since late 2002. Tulip is built to handle 1,000,0008
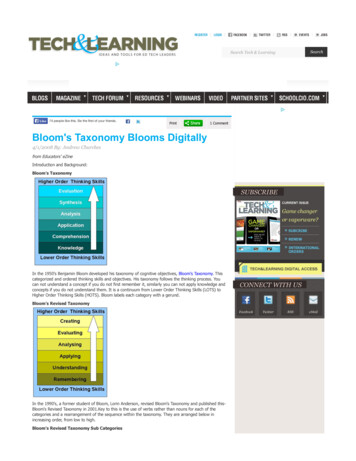
elements theoretically and is able to visualize 110,000 nodes representing a UNIX filesystem in less than a second as stated by the author. Tulip implements an improvement tothe Carrière and Kazman algorithm by finding the optimal enclosing circle that is anamelioration to the enclosing circle used in the Carrière and Kazman algorithm. Findingthe optimal enclosing circle is a special case of the general “Smallest enclosing ball”problem as described in [16] and is out of the scope of our research.1.3.4 Other TechniquesMany other techniques described in different technical papers [25 – 30] have beendeveloped but either they present too much information which makes users unable toclearly reach their objectives or the nodes are drawn in a non-hierarchical layout, whichis not what cognitive science recommends for the understanding of graphs andinformation visualizations. These can only be used by experienced users and eventuallythey will also face problems using it.Figure 6: Zarrad's TBox Visualization Tool9
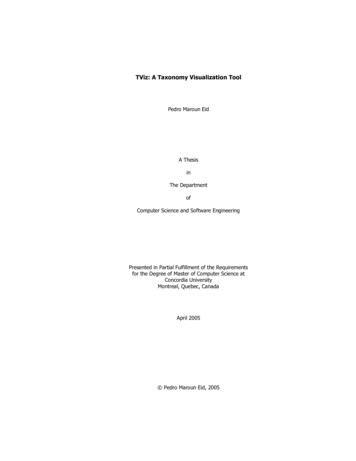
Concerning the study of visualizing semantic web taxonomies, some research hasbeen done in the field. Some visualize RDF-based information and ontologies such as in[5 and 6] and others conducted the same research but with unsatisfying results for largedatasets. Zarrad [7], in his master thesis, tried to visualize the same datasets but using alayer layout structure in 2D. He encountered some obvious problems such as cluttering,dense spaces and cognitively unreadable graphs when the datasets exceeded 200 nodes asshown in Figure 6 taken from his research thesis.Figure 7: OilViz3D Prototype for a 179 nodes treeSome other work is also being done in parallel to this study in ManchesterUniversity. The work involves the same subject and is closely related to this thesis.Khalid [34] is working on the same concept but with a different approach. The10
implemented visualization program, OilViz3D presented in Figure 7, has been integratedinto OilEd . After testing the prototype, we noticed that the layout might grow infinitelyin Euclidean space which makes it hard and sometimes impossible for users to perceivelarge graphs. A spring embedder algorithm is used to stabilize the graph according toconnections and densities of nodes after the tree is drawn with the appropriateconnections between the children. This stabilization procedure, after reaching itsbalanced state, should give the smallest possible tree. Moreover, their graph explorationtechnique is slow since the user can only browse by hierarchy jumping from the parent tothe child and vice versa. This technique needs more computational resources than otheravailable exploration techniques and becomes worse as users browse deeper in largetrees. Hence, it does not take advantage of the powerful graphics hardware currentlypresent in modern computers. Also, OilViz3D does not implement tools such assearching and picking. It uses OpenGL and Java for rendering the graph.1.3.5 SummaryOur review summarized the works and the different methods used to visualizelarge datasets. The applications already created to visualize semantic web taxonomies donot accomplish their task in an efficient way with large datasets and there is room forbetter tools. More elaborate methods for graphing large datasets have been discussedsuch as the Hyperbolic Tree, the Tree Map, and the Cone Tree layouts. As a first attemptto our solution, another kind of implementation was tried and is discussed in thefollowing section. Later, we adopted the Cone Tree layout for its capability to handlevery large datasets in very little time as compared to the other layouts. It also conservesthe look of the hierarchical structure and allows easy graph manipulation and exploration.11
This layout needs a hierarchical dataset; to solve this problem, we had to change the nonhierarchical entity into a hierarchical one. The way this will be executed will be discussedlater in this thesis.1.4 A First AttemptPrevious versions to our current solution were constructed as part ofexperimentation that led to the final result of this research. Basically the parsercomponent had very little changes throughout the versions because it was well definedsince the beginning. Previous versions all questioned the effectiveness of the resultinggraph layout or visualization. The two previous versions were fruitful experiments butinsufficient towards reaching the goal of our research. These experiments had problemsin their effectiveness as a viewing layout and were unusable for large trees. A lot ofcluttering resulted along with immense processing times because of the graph layout thatwas not using the screen space effectively and the recursive algorithms that overexploitedsystem memory. Studies and changes were made until the current version was consideredto be a good tool for visualizing TBox subsumption hierarchies created by RACER.One of the previous versions was a 2D connected graph that represents thetaxonomy in question. In this layout, the nodes were put on random positions on thescreen, and connecting lines linked the nodes together. This graph layout was a testplatform for more research to have a lookout of common problems we could encounter. Itshowed to be unreadable in the case of more than around 30 nodes. Another layout had tobe considered for our goal of efficiently visualizing around 15,000 nodes.12
Another version then was thought of and realized. Since the taxonomy starts withtop and ends with bottom, the whole layout could be represented as a circle in 2D or as asphere in 3D. The top node would be
make it non-hierarchical, e.g. any multiple inheritance should be made to follow a single parent. Finally, this hierarchical entity is graphed in a certain layout. One of the best layouts suitable for huge hierarchies is the Cone Tree hierarchical layout [14]. This layout models the nodes, their parents and their children in a cone shaped layout.