Transcription
New Hampshire Groundwater Level MonitoringApril 2022New Hampshire Geological Survey29 Hazen Drive, PO Box 95Concord, New Hampshire 03302-0095May 6, 2022
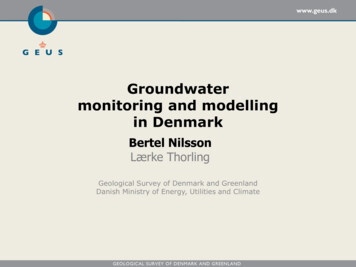
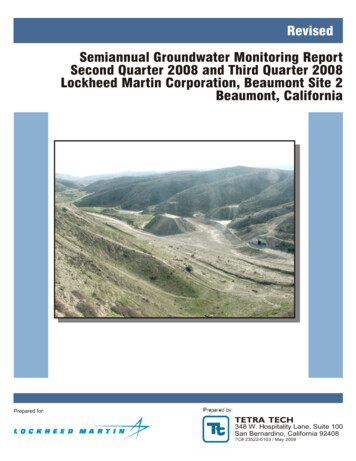
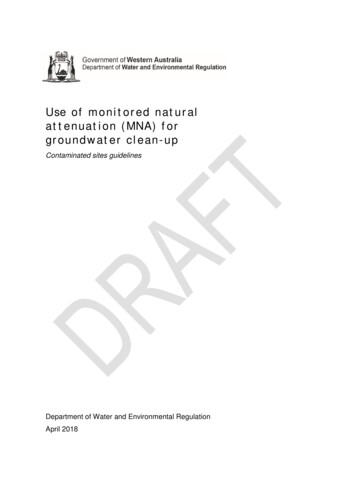
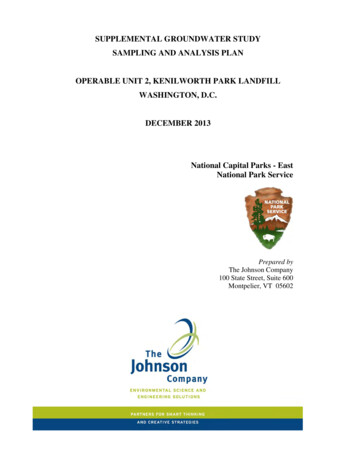
GROUNDWATER CONDITIONS SUMMARYNew Hampshire state-wide average temperature and precipitation were slightly above normal in April2022. State-wide average precipitation in New Hampshire for the month of April was 117% of normal1,according to data from the Northeast Regional Climate Center (NRCC). Most of southern and westernNew Hampshire received below normal to normal precipitation amounts, while most of northern NewHampshire received normal to above normal precipitation amounts. Percent of normal precipitation inNew Hampshire determined from Quantitative Precipitation Estimates provided by National WeatherService’s Advanced Hydrologic Prediction Service (AHPS) ranged from lows of 50 to 75% of normal inNewport and Claremont in western New Hampshire, to highs of 200 to 300% of normal in an area northof the White Mountains. Figure 1 shows the distribution of percent of normal April precipitation acrossNew Hampshire from AHPS.According to the U.S. Drought Monitor map for New Hampshire released on April 28, 2022, the extent ofareas in New Hampshire designated as abnormally dry have contracted since last month. ModerateDrought (D1) through Exceptional Drought (D4) conditions are not present in New Hampshire.Abnormally Dry (D0) conditions now cover 2.5% of the State, a large decrease from the 35.9% of theState designated as abnormally dry at the end of March 2022. All of southern and central NewHampshire, and most of northern New Hampshire (97.5% of the state) are not designated as AbnormallyDry (D0). The areas designated as Abnormally Dry (D0) includes the northern limit of Coos County alongthe Canadian border and an area in northwestern Grafton County along the Vermont border. Figure 2shows the locations and intensity of current classified drought conditions in New Hampshire.Figures 1 and 2 show the monthly status of groundwater levels for both bedrock and overburden wellsin the New Hampshire Geological Survey’s Groundwater Level Monitoring Network (GWLMN). TheGWLMN currently includes 11 bedrock and 19 overburden observation wells, all of which are measuredmonthly by hand near the end of each month. Bedrock wells are installed into bedrock and overburdenwells are installed in the unconsolidated materials above bedrock. Using the monthly handmeasurements, monthly medians and percentile statistics are calculated. Only wells with a period ofrecord (POR) of 10 years or more for all months of the year are placed within statistical categories of:low, below normal, normal, above normal, and high (symbols dark red through blue, corresponding to 10, 10-25, 25-75, 75-90, and 90 percentile classes, respectively). The current monthly readings aresummarized in Figures 1 and 2, and in Table 1 for all 30 wells in the network. The current depth togroundwater for each well along with the annual hydrographs showing the monthly statistical analysisare shown in the following figures. Additional plots showing the prior 24-months of groundwatermeasurements along with the “normal range” of the 25th to 75th percentile is shown for each well withPOR 10 years.1Based on the most recent 30-year normal period, currently 1991 – 2020.
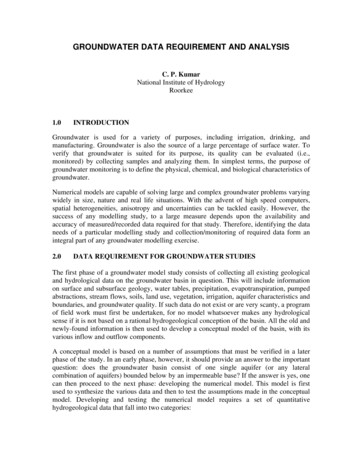
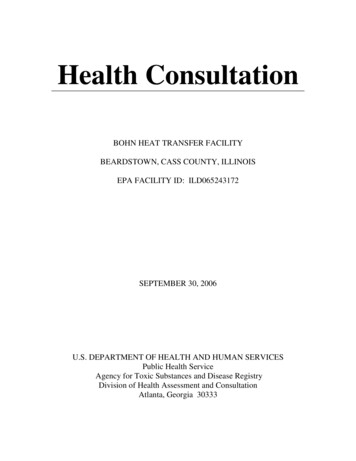
The April 2022 monthly well measurements show groundwater levels vary across the State from low tohigh levels, as indicated in Table 1. High ( 90th Percentile) groundwater levels were recorded in thedeep bedrock wells in Concord and Stewartstown. Above Normal (75th to 90th Percentile) groundwaterlevels were recorded in the overburden wells in Greenfield and Nashua. Below Normal (10th to 25thPercentile) levels were recorded in the two overburden wells in Newport, the bedrock well in Hooksett,and the shallow bedrock well in Kingston. Low ( 10th Percentile) groundwater level was recorded in theoverburden well located in Lancaster. The remaining wells are at normal (25th to 75th Percentile) levelsfor the month of April.Of the five wells with 10 years POR: both the shallow and deep bedrock wells (SOWB-02 and SOWB01) in Rindge are near the highest levels recorded in April to date; the replacement overburden well inConcord (CVW-02.1) is above the median value for April; the overburden well in Barrington (BBW-53) isat the median level for April; and the bedrock well in Northwood (NWWB-01) is at the lowest levelrecorded in April to date.Groundwater level in Nashua continues to be at a high level for April. The groundwater level in theNashua well (NAW-218) continues to be affected by dams on Pennichuck Brook related to a watersupply reservoir. Planned replacement of NAW-218 with a new overburden well is expected to becompleted by summer 2023.NOTES:For further information of the New Hampshire Geological Survey’s groundwater level monitoringnetwork, please visit the NHGS information page at the USGS National Ground-Water MonitoringNetwork Portal or Groundwater - NH DES.The annual and 2 year hydrograph plots and monthly statistics tables were created with R version 4.1.3using a modified version of the Hydrologic AnalySis Package (HASP) provided by USGS. The HASP opensource code is available at the USGS-R/HASP page on Github.If you are interested in receiving the monthly New Hampshire Groundwater Level Monitoring report byemail, please contact Michael.W.Howley@des.nh.gov to be added to the email distribution list.
Figure 1. Groundwater Monitoring Network showing groundwater levels relative to statistical envelopescalculated over each well’s period of record (POR) and percent normal precipitation map for April 2022(National Weather Service – Advanced Hydrologic Prediction Service).
Figure 2. Groundwater Monitoring Network showing groundwater levels relative to statistical envelopescalculated over each well’s period of record (POR) and drought areas according to data released by theU.S. Drought Monitor on April 28, 2022.
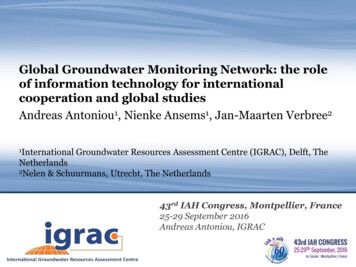
Table 1. Summary of groundwater levels sorted by well type. 90 Percentile, High75 – 90 Percentile, Above Normal25 – 50 Percentile, Normal10 -25 Percentile, Below Normal 10 Percentile, Low 10yr POR, Not AnalyzedWellADW-14TownAlbanyWell typeOverburdenScreenedor 233.363.37Not 57-6240.9441.13Not 826.2826.28Normal0.000.14Depth toWater(ft)4.55MonthlyAverage(ft)4.11Current StatusNormalDeparturefrom ldOverburden66-6859.1260.93Above 27.11Above Normal0.840.25NFW-53New 01New NewportOverburden54-565.774.86Below 94Below 0015.6616.27Above Normal0.610.25EAWB-01East B-02East KingstonBedrock70-32320.8420.63Below .23Below 59Not 13.89Not .60Not 30316.0517.62Normal1.571.40** All Time High or Low level for current month
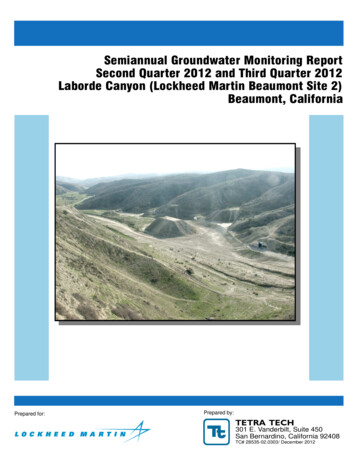
Site ID: ADW-14Current data value: 4.55 on 04/22/2022Period of Record Monthly Statistics for ADW-14Depth to water, feet below land 3.8426Note: Highlighted values in the table indicate closest statistic to the most recent measurement.
Site ID: ADW-15Current data value: 6.07 on 04/22/2022Period of Record Monthly Statistics for ADW-15Depth to water, feet below land 4.6026Note: Highlighted values in the table indicate closest statistic to the most recent measurement.
Site ID: BBW-53POR 10 YearsCurrent data value: 3.36 on 04/25/2022
Site ID: CBW-34Current data value: 11.27 on 04/22/2022Period of Record Monthly Statistics for CBW-34Depth to water, feet below land c13.7813.2212.8312.4111.8611.6110.0726Note: Highlighted values in the table indicate closest statistic to the most recent measurement.
Site ID: CTW-73Current data value: 7.20 on 04/21/2022Period of Record Monthly Statistics for CTW-73Depth to water, feet below land hPOR26Note: Highlighted values in the table indicate closest statistic to the most recent measurement.
Site ID: CVW-02.1POR 10 YearsCurrent data value: 40.94 on 04/26/2022
Site ID: CVW-04Current data value: 15.75 on 04/26/2022Period of Record Monthly Statistics for CVW-04Depth to water, feet below land Dec19.8018.8718.4617.7316.4615.9115.2855Note: Highlighted values in the table indicate closest statistic to the most recent measurement.
Site ID: DDW-46Current data value: 38.09 on 04/28/2022Period of Record Monthly Statistics for DDW-46Depth to water, feet below land .6239.4139.1638.7537.9937.6527MonthPOR29Note: Highlighted values in the table indicate closest statistic to the most recent measurement.
Site ID: EPW-90Current data value: 26.28 on 04/28/2022Period of Record Monthly Statistics for EPW-90Depth to water, feet below land .0129.6429.3128.4027.2725.8614MonthPOR16Note: Highlighted values in the table indicate closest statistic to the most recent measurement.
Site ID: FKW-01Current data value: 9.97 on 04/25/2022Period of Record Monthly Statistics for FKW-01Depth to water, feet below land 0.038.6151MonthPOR53Note: Highlighted values in the table indicate closest statistic to the most recent measurement.
Site ID: GSW-75Current data value: 59.12 on 04/24/2022Period of Record Monthly Statistics for GSW-75Depth to water, feet below land .8862.8062.3060.3059.6958.7726MonthPOR26Note: Highlighted values in the table indicate closest statistic to the most recent measurement.
Site ID: LCW-01Current data value: 2.20 on 04/26/2022Period of Record Monthly Statistics for LCW-01Depth to water, feet below land hPOR44Note: Highlighted values in the table indicate closest statistic to the most recent measurement.
Site ID: LLW-19Current data value: 13.02 on 04/22/2022Period of Record Monthly Statistics for LLW-19Depth to water, feet below land 1713.9613.3712.3611.5110.9827MonthPOR27Note: Highlighted values in the table indicate closest statistic to the most recent measurement.
Site ID: NAW-218Current data value: 26.27 on 04/25/2022Period of Record Monthly Statistics for NAW-218Depth to water, feet below land .0428.6428.2227.5227.1826.0854MonthPOR53Note: Highlighted values in the table indicate closest statistic to the most recent measurement.
Site ID: NFW-53Current data value: 18.45 on 04/22/2022Period of Record Monthly Statistics for NFW-53Depth to water, feet below land .3119.1318.8818.7118.4918.0928MonthPOR27Note: Highlighted values in the table indicate closest statistic to the most recent measurement.
Site ID: NLW-01Current data value: 5.28 on 04/25/2022Period of Record Monthly Statistics for NLW-01Depth to water, feet below land 9014.4610.807.946.264.683.6069MonthPOR72Note: Highlighted values in the table indicate closest statistic to the most recent measurement.
Site ID: NPW-03Current data value: 5.77 on 04/25/2022Period of Record Monthly Statistics for NPW-03Depth to water, feet below land hPOR27Note: Highlighted values in the table indicate closest statistic to the most recent measurement.
Site ID: NPW-06Current data value: 6.32 on 04/25/2022Period of Record Monthly Statistics for NPW-06Depth to water, feet below land hPOR27Note: Highlighted values in the table indicate closest statistic to the most recent measurement.
Site ID: OXW-38Current data value: 34.57 on 04/22/2022Period of Record Monthly Statistics for OXW-38Depth to water, feet below land .0835.8835.7235.0834.5333.5926MonthPOR26Note: Highlighted values in the table indicate closest statistic to the most recent measurement.
Site ID: CVWB-01Current data value: 18.68 on 04/26/2022Period of Record Monthly Statistics for CVWB-01Depth to water, feet below land .9221.2419.9719.7019.5617.4713MonthPOR13Note: Highlighted values in the table indicate closest statistic to the most recent measurement.
Site ID: CVWB-02Current data value: 12.83 on 04/26/2022Period of Record Monthly Statistics for CVWB-02Depth to water, feet below land .8614.9014.2613.2512.4912.3313MonthPOR13Note: Highlighted values in the table indicate closest statistic to the most recent measurement.
Site ID: DDWB-01Current data value: 15.66 on 04/28/2022Period of Record Monthly Statistics for DDWB-01Depth to water, feet below land Dec19.5819.4519.3318.1417.1516.5515.6312Note: Highlighted values in the table indicate closest statistic to the most recent measurement.
Site ID: EAWB-01Current data value: 21.77 on 04/25/2022Period of Record Monthly Statistics for EAWB-01Depth to water, feet below land .3122.8522.7022.0421.9621.8613MonthPOR13Note: Highlighted values in the table indicate closest statistic to the most recent measurement.
Site ID: EAWB-02Current data value: 20.84 on 04/25/2022Period of Record Monthly Statistics for EAWB-02Depth to water, feet below land Dec22.6822.5822.1721.6620.7320.4420.3213Note: Highlighted values in the table indicate closest statistic to the most recent measurement.
Site ID: HTW-05Current data value: 48.01 on 04/25/2022Period of Record Monthly Statistics for HTW-05Depth to water, feet below land Dec51.8149.8049.3048.2147.1046.2744.5356Note: Highlighted values in the table indicate closest statistic to the most recent measurement.
Site ID: NWWB-01POR 10 YearsCurrent data value: 4.71 on 04/25/2022
Site ID: RGWB-01POR 10 YearsCurrent data value: 12.25 on 04/24/2022
Site ID: RGWB-02POR 10 YearsCurrent data value: 14.96 on 04/24/2022
Site ID: SOWB-01Current data value: 11.55 on 04/21/2022Period of Record Monthly Statistics for SOWB-01Depth to water, feet below land .5116.8916.0715.2815.0114.5412MonthPOR13Note: Highlighted values in the table indicate closest statistic to the most recent measurement.
Site ID: SOWB-02Current data value: 16.05 on 04/21/2022Period of Record Monthly Statistics for SOWB-02Depth to water, feet below land .7023.6019.3018.4517.0214.4013MonthPOR13Note: Highlighted values in the table indicate closest statistic to the most recent measurement.
Figures 1 and 2 show the monthly status of groundwater levels for both bedrock and overburden wells in the New Hampshire Geological Survey's Groundwater Level Monitoring Network (GWLMN). The GWLMN currently includes 11 bedrock and 19 overburden observation wells, all of which are measured monthly by hand near the end of each month.