Transcription
A Technical Framework for Business Dashboards.The pRED Portfolio dashboard as an example.2016 European Spotfire User Group Meeting, BaselChristian BlumenroehrPharma Research and Early DevelopmentpRED Informatics, Solution Delivery & ArchitectureRoche Innovation Center Basel
The problem & its solutionThe business benefitsIntegration of Spotfire reportsDemo (with dummy data)The technical implementationThe framework applied to other dashboards
The problem Portfolio data are available at different places users lost track Files are sent via e-mail later access to outdated dataCustom reporting appCustom reporting app
The solution Build a dashboard that provides a unique access pointCustom reporting appCustom reporting app
The business benefits Single point of truth Improved support for senior pRED Leadership decisions around:– Portfolio prioritization– Investment decisions– Partnering decisions– Risk management 7 points of access for portfolio reporting combined into one, deliveringconfidence in validity of data. Improved data quality through increased portfolio visibility. Usage statistics– "how many reports are viewed?", "how does the usage evolve overtime?", "what reports/report types are used the most?“ Easy to use Central access management, thus increasing security
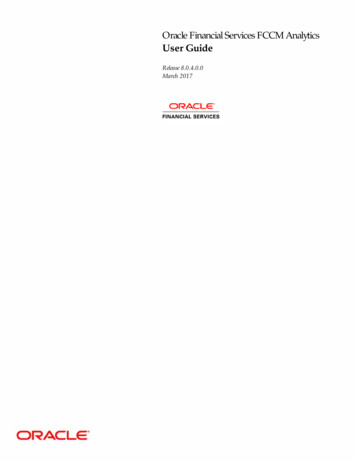
The dashboardReport type, title, representative picture. On mouse over: description & data refresh rateThe dashboard currently consists of 55 reports. Each report is representedby a "portlet"
The dashboardAll portlets are grouped in report categories each consisting ofOfficial PDF reports stamped by the Portfolio Management groupDynamic visualizations of portfolio metrics and analyses via Spotfire and BO based on live dataStatic reports in MS Office formatsCustom reporting applications
The dashboard
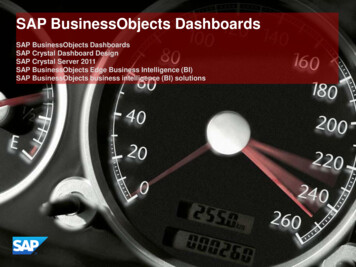
Central access managementUsers see only what they are allowed to seeIn the Admin UI:– Add, modify categories– Add, edit, re-categorize reports– Grants access by Role– Roles managed by Active Directory groupsAD Group MembershipSpotfireGroupsSpotfireGroupsRole 1GroupsBOBOGroupsAccess matrixReportsSpotfireReportReportSpotfireSpotfire ReportBO ReportBO ReportCust. Rep. App1 GroupCust. Rep. App2 GroupSharePoint GroupsRole 3Category ACategory B. . .Role 2CategoriesCategory C
Integration of Spotfire reports (Kerberos-based) SSO no login required Scheduled updates immediate access Use the „options” parameter to the webplayer url hide various sections like Header, Toolbar, Close button etc. Use configuration ysis.aspx?file /foo/bar&options 2-0,4-0 set page, filters, is.aspx?file /foo/bar&options 2-0,4-0&configurationBlock SetPage(pageTitle “MyPage");
Demo (with dummy data and reports ondevelopment environment) Navigation Search Favorites Mashups Responsive design Admin Interface
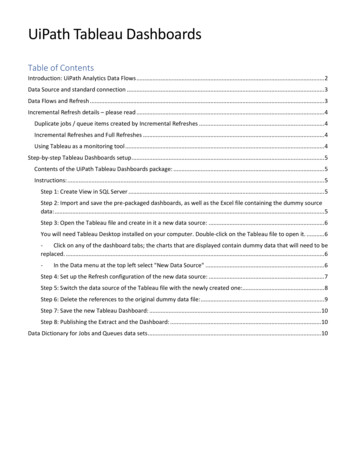
Technical ImplementationADMINThe dynamic reports are embeddedin the web application via iFrames(Spotfire & BO), and static reportsare stored on SharePoint (.xls, .ppt)USERPersonalized dashboardDisplay specific reportsCreate mashupsSSOHTML5/CSSConfigure reportsManage default dashboardManage access rolesAngularJSSSO*SSO*MOGATERoche’s«Identity &Access» dataREST ight and fast open-source serverallowing to use of full JavaScript stack forboth client and server.MongoDBLightweight, easy to scale, schema less ,document database for storing thedashboard and user personalization inJSON format. No report data are stored!* : only on IE, basic authentication fallback on other browsers
Technical Implementation MEAN : The acronym "MEAN" stands for"MongoDB Express.js AngularJS Node.js" and represents a group oftechnologies which are known to synergize well together; it is a free and opensource JavaScript software stack for building dynamic web sites and webapplications.
Technical Implementation Why using MEAN ?o Single language from top to bottom ( performance gains in both the softwareitself and in the productivity of developers)o Single data format JSON is used for transferring data ( simple approach, easierimplementation, debugging and database administration)o Flexibility in deployment platformo Node.js's huge module libraryo Open source, modern and popular Using Sails.js instead of Express.js : Sails.js is a realtime MVC Framework forNode.js, it is based on Express.js but has a higher level of abstractiono Node.js ships with a very basic set of http libraries.o Express.js wraps those http libraries and helps to enable things like routing,static serving, sessions, cookies, etc. But it really knows nothing about the DB.o Sails.js wraps express and provides another higher level for doing things likeconnecting to the DB, auto-generating input pages, etc.o Sails.js provides easy mechanism to create REST APIs
The framework applied to other dashboards This framework is not bound to portfolio data Can be applied to all kinds of reporting dashboards New instance: Clinical Development Dashboard
AcknowledgementspRED Strategy & Portfolio Team pRED Informatics TeamRoche ADMD TeamOdile ChomienneSebastien FournierAdam ChwilkowskiMarina NeumuellerAlison WillardMarcin BorkowskiKenny NiedworokMichal KolackiAlan RogersonKamil Kuliczkowsk
Doing now what patients need next
Using Sails.js instead of Express.js: Sails.js is a realtime MVC Framework for Node.js, it is based on Express.js but has a higher level of abstraction o Node.js ships with a very basic set of http libraries. o Express.js wraps those http libraries and helps to enable things like routing, static serving, sessions, cookies, etc. But it .