Transcription
801CHAPTER21The GPLOT ProcedureOverview 801About Plots of Two Variables 802About Plots with a Classification Variable 803About Bubble Plots 803About Plots with Two Vertical Axes 804About Interpolation Methods 805Concepts 805Parts of a Plot 805About the Input Data Set 806Missing Values 807Values Out of Range 807Sorted Data 807Logarithmic Axes 807Procedure Syntax 807PROC GPLOT Statement 808BUBBLE Statement 809BUBBLE2 Statement 815PLOT Statement 818PLOT2 Statement 828Examples 834Example 1: Generating a Simple Bubble Plot 834Example 2: Labeling and Sizing Plot Bubbles 835Example 3: Adding a Right Vertical Axis 837Example 4: Plotting Two Variables 839Example 5: Connecting Plot Data Points 842Example 6: Generating an Overlay Plot 844Example 7: Filling Areas in an Overlay Plot 846Example 8: Plotting Three Variables 847Example 9: Plotting with Different Scales of Values 851Example 10: Creating Plots with Drill-down for the Web 853OverviewThe GPLOT procedure plots the values of two or more variables on a set ofcoordinate axes (X and Y). The coordinates of each point on the plot correspond to twovariable values in an observation of the input data set. The procedure can also generatea separate plot for each value of a third (classification) variable. It can also generatebubble plots in which circles of varying proportions representing the values of a thirdvariable are drawn at the data points.The procedure produces a variety of two-dimensional graphs including
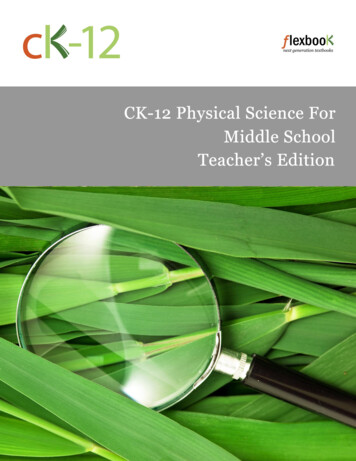
802About Plots of Two Variables4Chapter 213 simple scatter plots3 overlay plots in which multiple sets of data points display on one set of axes3 plots against a second vertical axis3 bubble plots3 logarithmic plots (controlled by the AXIS statement).In conjunction with the SYMBOL statement the GPLOT procedure can produce joinplots, high-low plots, needle plots, and plots with simple or spline-interpolated lines.The SYMBOL statement can also display regression lines on scatter plots.The GPLOT procedure is useful for3 displaying long series of data, showing trends and patterns3 interpolating between data points3 extrapolating beyond existing data with the display of regression lines andconfidence limits.About Plots of Two VariablesPlots of two variables display the values of two variables as data points on onehorizontal axis (X) and one vertical axis (Y). Each pair of X and Y values forms a datapoint.Figure 21.1 on page 802 shows a simple scatter plot that plots the values of thevariable HEIGHT on the vertical axis and the variable WEIGHT on the horizontal axis.By default, the PLOT statement scales the axes to include the maximum and minimumdata values and displays a plus sign ( ) at each data point. It labels each axis with thename of its variable or an associated label and displays the value of each major tickmark.Figure 21.1Scatter Plot of Two Variables (GR21N04(a))The program for this plot is in Example 4 on page 839. For more information onproducing scatter plots, see “PLOT Statement” on page 818.
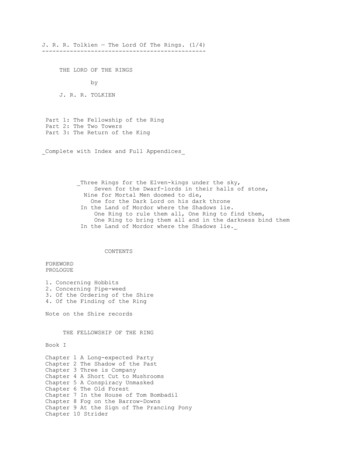
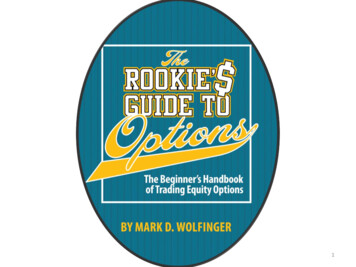
The GPLOT Procedure4About Bubble Plots803You can also overlay two or more plots (multiple sets of data points) on a single set ofaxes and you can apply a variety of interpolation techniques to these plots. See “AboutInterpolation Methods” on page 805.About Plots with a Classification VariablePlots that use a classification variable produce a separate set of data points for eachunique value of the classification variable and display all sets of data points on one setof axes.Figure 21.2 on page 803 shows multiple line plots that compare yearly temperaturetrends for three cities. The legend explains the values of the classification variable,CITY.Figure 21.2Plot of Three Variables with Legend (GR21N08(a))By default, plots with a classification variable generate a legend. In the code thatgenerates the plot for Figure 21.2 on page 803, a SYMBOL statement connects the datapoints and specifies the plot symbol that is used for each value of the classificationvariable (CITY). The program for this plot is in Example 8 on page 847. For moreinformation on how to produce plots with a classification variable, see “PLOTStatement” on page 818.About Bubble PlotsBubble plots represent the values of three variables by drawing circles of varyingsizes at points that are plotted on the vertical and horizontal axes. Two of the variablesdetermine the location of the data points, while the values of the third variable controlthe size of the circles.Figure 21.3 on page 804 shows a bubble plot in which each bubble represents acategory of engineer that is shown on the horizontal axis. The location of each bubble inrelation to the vertical axis is determined by the average salary for the category. Thesize of each bubble represents the number of engineers in the category relative to thetotal number of engineers in the data.By default, the BUBBLE statement scales the axes to include the maximum andminimum data values and draws an unlabeled circle at each data point. It labels each
804About Plots with Two Vertical Axes4Chapter 21axis with the name of its variable or an associated label and displays the value of eachmajor tick mark.Figure 21.3Bubble Plot (GR21N01)The program for this plot is in Example 1 on page 834. For more information onproducing bubble plots, see “BUBBLE Statement” on page 809.About Plots with Two Vertical AxesPlots with two vertical axes have a right vertical axis that can3 display the same variable values as the left axis3 display left axis values in a different scale3 plot a second dependent (Y) variable, thereby producing one or more overlay plots.In Figure 21.4 on page 805 the right axis displays the values of the verticalcoordinates in a different scale from the scale that is used for the left axis.
The GPLOT ProcedureFigure 21.44Parts of a Plot805Plot with a Right Vertical Axis (GR21N09)The program for this plot is in Example 9 on page 851. For more information on howto produce plots with a right vertical axis, see “PLOT2 Statement” on page 828 and“BUBBLE2 Statement” on page 815.About Interpolation MethodsIn addition to these graphs, you can produce other types of plots such as box plots orhigh-low-close plots by specifying various interpolation methods with the SYMBOLstatement. Use the SYMBOL statement to3 connect the data points with straight lines3 specify regression analysis to fit a line to the points and, optionally, display linesfor confidence limits3 connect the data points to the zero line on the vertical axis3 display the minimum and maximum values of Y at each X value and mark themean value, display standard deviations that connect the data points with lines orbars, generate box plots, or plot high-low-close stock market data3 specify that a pattern fill the polygon that is defined by data points3 smooth plot lines with spline interpolation3 use a step function to connect the data points“SYMBOL Statement” on page 226 describes all interpolation methods.ConceptsParts of a PlotSome terms used with GPLOT procedure are illustrated in Figure 21.5 on page 806and Figure 21.6 on page 806.
806About the Input Data Set4Chapter 21Figure 21.5GPLOT Procedure TermsFigure 21.6Additional GPLOT Procedure TermsAbout the Input Data SetThe input data set that is used by the GPLOT procedure must contain at least onevariable to plot on the horizontal axis and one variable to plot on the vertical axis.Typically, the horizontal axis shows an independent variable (time, for example), andthe vertical axis shows a dependent variable (temperature, for example). Variables can
The GPLOT Procedure4Procedure Syntax807be character or numeric. Graphs are automatically scaled to the values of the characterdata or to include the values of numeric data, but you can control scaling withprocedure options or with associated AXIS statements.Missing ValuesIf the value of either of the plot variables is missing, the GPLOT procedure does notinclude the observation in the plot. If you specify interpolation with a SYMBOLdefinition, the plot is not broken at the missing value. To break the plot line or area fillat the missing value, use the PLOT statement’s SKIPMISS option. SKIPMISS isavailable only with join or spline interpolations.Values Out of RangeExclude data values from a graph by restricting the range of axis values with theVAXIS or HAXIS options or with the ORDER option in an AXIS statement. Whenan observation contains a value outside of the specified axis range, the GPLOTprocedure excludes the observation from the plot and issues a message to the log.If you specify interpolation with a SYMBOL definition, by default values outside ofthe axis range are excluded from interpolation calculations and as a result may changeinterpolated values for the plot. Values that are omitted from interpolation calculationshave a particularly noticeable effect on the high-low interpolation methods: HILO, STD,and BOX. In addition, regression lines and confidence limits will represent only part ofthe original data.To specify that values out of range are included in the interpolation calculations, usethe MODE option in a SYMBOL statement. When MODE INCLUDE, values that falloutside of the axis range are included in interpolation calculations but excluded fromthe plot. The default (MODE EXCLUDE) omits observations that are outside of theaxis range from interpolation calculations. See the MODE option of the SYMBOLstatement in “SYMBOL Statement” on page 226 for details.Sorted DataData points are plotted in the order in which the observations are read from thedata set. Therefore, if you use any type of interpolation that generates a line, sort yourdata by the horizontal axis variable.Logarithmic AxesIf your data contain logarithmic values or if the data values vary over a wide rangeor contain large values, you may want to specify a logarithmic axis for the horizontal orvertical axis. Logarithmic axes can be specified with the AXIS statement optionsLOGBASE and LOGSTYLE . See “AXIS Statement” on page 162 for a completediscussion.Procedure SyntaxAt least one PLOT or BUBBLE statement is required. A PLOT2 orBUBBLE2 statement can be used in conjunction with a PLOT or BUBBLE statement.Global statements: AXIS, FOOTNOTE, LEGEND, PATTERN, SYMBOL, TITLEReminder: The procedure can include BY, FORMAT, LABEL, WHERE, and NOTEstatements.Supports: RUN-group processing Output Delivery System (ODS)Requirements:
808PROC GPLOT Statement4Chapter 21PROC GPLOT DATA input-data-set ANNOTATE Annotate-data-set GOUT libref. output-catalog IMAGEMAP output-data-set UNIFORM ;BUBBLE plot-request(s) /option(s) ;BUBBLE2 plot-request(s) /option(s) ;PLOT plot-request(s) /option(s) ;PLOT2 plot-request(s) /option(s) ;PROC GPLOT StatementIdentifies the data set that contains the plot variables. Optionally specifies uniform axis scaling forall graphs as well as annotation and an output catalog.Requirements:An input data set is required.SyntaxPROC GPLOT DATA input-data-set ANNOTATE Annotate-data-set GOUT libref. output-catalog IMAGEMAP output-data-set UNIFORM ;OptionsANNOTATE Annotate-data-setANNO Annotate-data-setspecifies a data set to annotate all graphs that are produced by the GPLOTprocedure. To annotate individual graphs, use ANNOTATE in the action statement.See also: Chapter 10, “The Annotate Data Set,” on page 403DATA input-data-setspecifies the SAS data set that contains the variables to plot. By default, theprocedure uses the most recently created SAS data set.See also: “SAS Data Sets” on page 25 and “About the Input Data Set” on page 806GOUT libref. output-catalogspecifies the SAS catalog in which to save the graphics output that is produced bythe GPLOT procedure. If you omit the libref, SAS/GRAPH looks for the catalog inthe temporary library called WORK and creates the catalog if it does not exist.See also: “Storing Graphics Output in SAS Catalogs” on page 49IMAGEMAP output-data-setcreates a SAS data set that contains information that can be used to implement adrill-down plot. IMAGEMAP can be used only if the PLOT or PLOT2 statementsare used, and the PLOT or PLOT2 statement must use the HTML option or theHTML LEGEND option or both.The Imagemap information is used in the HTML file that references the graph. Itdetermines where the drill-down hot zones are, and it links those hot zones to other
The GPLOT Procedure4BUBBLE Statement809files or images. If HTML is used on the PLOT or PLOT2 statement, the plot pointsare defined as hot zones, unless AREA is also used, in which case there are not plotpoints and the areas between plot lines are defined as hot zones. If HTML LEGEND is used, the legend symbols are defined as hot zones. Information for the links isstored in the variables referenced by the HTML and HTML LEGEND options.See also: “Customizing Web Pages for Drill-down Graphs” on page 100UNIFORMspecifies that the same axis scaling is used for all graphs that are produced by theprocedure. By default, the range of axis values for each axis is based on the minimumand maximum values in the data and, therefore, may vary from graph to graph andamong BY groups. Using the UNIFORM option forces the value range for each axis tobe the same for all graphs. Thus, if the procedure produces multiple graphs with bothleft and right vertical axes, the UNIFORM option scales all of the left axes the sameand all of the right axes the same, based on the minimum and maximum data values.In addition, UNIFORM forces the assignment of SYMBOL statements for thecategory variable without regard to the BY-group variable, and, if a legend isgenerated, makes the legend the same across graphs.BUBBLE StatementCreates bubble plots in which a third variable is plotted against two variables represented by thehorizontal and vertical axes; the value of the third variable controls the size of the bubble.At least one plot request is required.Global statements: AXIS, FOOTNOTE, TITLERequirements:DescriptionThe BUBBLE statement specifies one or more plot requests that namethe horizontal and left vertical axis variables and the variable that controls the size ofthe bubbles. This statement automatically3 centers each circle at a data point that is determined by the values of the verticaland horizontal axes variables3 scales the axes to include the maximum and minimum data values3 labels each axis with the name of its variable or associated label3 displays each major tick mark value3 draws circles for values that are located within the axes.You can use statement options to control axis scaling, draw reference lines, modifythe appearance of axes, control the display of the bubbles, and specify annotation.In addition, you can use global statements to modify axes (AXIS statement), and addtext to the graph (TITLE, NOTE, and FOOTNOTE statements). You can also use theAnnotate data set to enhance the plot.SyntaxBUBBLE plot-request(s) /option(s) ;option(s) can be one or more options from any or all of the following categories:3 bubble appearance options:BCOLOR bubble-color
810BUBBLE Statement4Chapter 21BFONT fontBLABELBSCALE AREA RADIUSBSIZE multiplier3 plot appearance options:ANNOTATE Annotate-data-setCAXIS axis-colorCFRAME background-colorCTEXT text-colorFRAME NOFRAMEGRIDNOAXIS3 horizontal axis options:AUTOHREFCHREF reference-line-colorHAXIS value-list AXIS 1.99 HMINOR number-of-minor-ticksHREF value-listHZEROLHREF line-type3 vertical axis options:AUTOVREFCVREF reference-line-colorLVREF line-typeVAXIS value-list AXIS 1.99 VMINOR number-of-minor-ticksVREF value-listVREVERSEVZERO3 catalog entry description options:DESCRIPTION ’entry-description’NAME ’entry-name’Required Argumentsplot-request(s)each specifies the variables to plot and produces a separate graph. All variables mustbe in the input data set. Multiple plot requests are separated with blanks. A plotrequest must have this form:y-variable*x-variable bubble-sizeplots the values of two variables and draws a circle (bubble) at each data point.The value of the third variable determines the size of the bubble.y-variablevariable plotted on the left vertical axis.
The GPLOT Procedure4BUBBLE Statement811x-variablevariable plotted on the horizontal axis.bubble-sizevariable that dictates the size of the bubbles. Bubble-size must be numeric. Ifthe value of bubble-size is positive, bubbles are drawn with a solid line; if it isnegative, bubbles are drawn with a dashed line.OptionsOptions in a BUBBLE statement affect all graphs that are produced by thatstatement. You can specify as many options as you want and list them in any order.ANNOTATE Annotate-data-setANNO Annotate-data-setspecifies a data set to annotate plots that are produced by the BUBBLE statement.See also: Chapter 10, “The Annotate Data Set,” on page 403AUTOHREFdraws reference lines at all major tick marks on the horizontal axis.AUTOVREFdraws reference lines at all major tick marks on the vertical axis.BCOLOR bubble-colorspecifies the color for the bubbles. If you omit the BCOLOR option, the first color inthe colors list is used for the bubble color.Featured in: Example 2 on page 835 and Example 3 on page 837BFONT fontspecifies the font to use for bubble labels. See Chapter 6, “SAS/GRAPH Fonts,” onpage 125 for details on how to specify font. If you omit the BFONT option, a fontspecification is searched for in this order:1 the FTEXT option in a GOPTIONS statement2 the default hardware font.See also: The BLABEL option for information on the location and color of labels.Featured in:Example 2 on page 835BLABELlabels the bubbles with the values of the third variable. If the variable has a format,the formatted value is used. By default, bubbles are not labeled.The procedure normally places labels directly outside of the circle at 315 degreesrotation. If a label in this position does not fit in the axis area, other 45-degreeplacements (that is, 45, 135, and 225 degrees) are attempted. If the label cannot beplaced at any of the positions (45, 135, 225, or 315 degrees) without being clipped,the label is omitted. However, labels may collide with other bubbles or previouslyplaced labels.Labels display in the color specified by the CTEXT option. If you omit CTEXT ,the default is the first color in the colors list.Featured in:Example 2 on page 835BSCALE AREA RADIUSspecifies whether the bubble-scaling proportion is based on the area of the circles orthe radius measure. By default, BSCALE AREA.The value that is assigned to the BSCALE option affects how large the bubblesappear in relation to each other. For example, suppose the third variable value istwice as big for one bubble as it is for another. If BSCALE AREA, the area of the
812BUBBLE Statement4Chapter 21larger bubble will be twice the area of the smaller bubble. If BSCALE RADIUS, theradius of the larger bubble will be twice the radius of the smaller bubble and thelarger bubble will have more than twice the area of the smaller bubble.BSIZE multiplierspecifies an overall scaling factor for the bubbles so that you can increase or decreasethe size of all bubbles by this factor. By default, BSIZE 5.Featured in:Example 2 on page 835 and Example 3 on page 837CAXIS axis-colorCA axis-colorspecifies the color for the axis line and all major and minor tick marks. By default,the procedure uses the first color in the colors list.If you use the CAXIS option, it may be overridden by1 the COLOR option in an AXIS definition, which in turn is overridden by2 the COLOR suboption of the MAJOR or MINOR option in an AXISdefinition.Featured in:Example 2 on page 835 and Example 3 on page 837CFRAME background-colorCFR background-colorfills the axis area with the specified color. If the FRAME option is also in effect, theprocedure determines the color of the frame according to the precedence list given forthe FRAME option description.CHREF reference-line-colorCH reference-line-colorspecifies the color for reference lines that are requested by the HREF andAUTOHREF options. By default, these reference lines display in the color of thehorizontal axis.CTEXT text-colorC text-colorspecifies the color for all text on the axes, including tick mark values, axis labels, andbubble labels.If you omit the CTEXT option, a color specification is searched for in this order:1 the CTEXT option in a GOPTIONS statement2 the default, the first color in the colors list.If you use the CTEXT option, it overrides the color specification for the axis labeland the tick mark values in the COLOR option in an AXIS definition that isassigned to the axis.If you use CTEXT , the color specification is overridden in this situation: if youalso use the COLOR suboption of a LABEL or VALUE option in an AXISdefinition that is assigned to the axis, that suboption determines the color of the axislabel or the color of the tick mark values, respectively.CVREF reference-line-colorCV reference-line-colorspecifies the color for reference lines that are requested by the VREF andAUTOVREF options. By default, these reference lines display in the color of thevertical axis.DESCRIPTION ’entry-description’DES ’entry-description’specifies the description of the catalog entry for the plot. The maximum length forentry-description is 40 characters. The description does not appear on the plot. By
The GPLOT Procedure4BUBBLE Statement813default, the procedure assigns a description of the form BUBBLE OFvariable*variable variable.The entry-description can include the #BYLINE, #BYVAL, and #BYVARsubstitution options, which work as they do when used on TITLE, FOOTNOTE, andNOTE statements. For more information, refer to the description of the options onpage 262, and “Substituting BY Line Values in a Text String” on page 266. The40-character limit applies before the substitution takes place for these options; thus,if in the SAS program the entry-description text exceeds 40 characters, it istruncated to 40 characters, and then the substitution is performed.The descriptive text is shown in the "description" portion of each of the following:3 in the Results window3 among the catalog-entry properties that you can view from the Explorer window3 in the Table of Contents that is generated when you use CONTENTS on anODS HTML statement (see “Linking to Output through a Table of Contents” onpage 86), assuming the GPLOT output is generated while the contents page isopen3 in the Description field of the PROC GREPLAY windowFRAME NOFRAMEFR NOFRspecifies whether a frame is drawn around the axis area. The default is FRAME;however, if the V6COMP option is in effect on the GOPTIONS statement, the defaultis NOFRAME. If you also use a BUBBLE2 or PLOT2 statement and your plottingstatements have conflicting frame specifications, FRAME is used.For the frame color, a specification is searched for in this order:1 the CAXIS option2 the COLOR option in the AXIS definition assigned to the vertical axis3 the COLOR option in the AXIS definition assigned to the horizontal axis4 the default, the first color in the colors list.To fill the axis area with a background color, use the CFRAME option.GRIDdraws reference lines at all major tick marks on both axes. You get the same resultwhen you use all of these options in a BUBBLE statement: AUTOHREF,AUTOVREF, FRAME, LVREF 34, and LHREF 34. The line type for GRID is 34.The line color is the color of the axis.HAXIS value-list AXIS 1 . . . 99 specifies major tick mark values for the horizontal axis or assigns an AXIS definition.See the HAXIS on page 824 option for a description of value-list. If you assign anAXIS definition that does not currently exist, the option is ignored. By default, theprocedure scales the axis and provides an appropriate number of tick marks.Note: If data values fall outside of the range that is specified by the HAXIS option, then by default the outlying data values are not used in interpolationcalculations. 4See also: “About the Input Data Set” on page 806 for more information on valuesout of range.Featured in:Example 2 on page 835HMINOR number-of-minor-ticksHM number-of-minor-ticksspecifies the number of minor tick marks that are drawn between each major tickmark on the horizontal axis. Minor tick marks are not labeled. The HMINOR
814BUBBLE Statement4Chapter 21option overrides the NUMBER suboption of the MINOR option in an AXISdefinition. You must specify a positive number.Featured in: Example 1 on page 834HREF value-listdraws one or more reference lines perpendicular to the horizontal axis at points thatare specified by value-list. See the HAXIS on page 824 option for a description ofvalue-list.See also: CHREF on page 812 for a description of color specifications for referencelines.HZEROspecifies that tick marks on the horizontal axis begin in the first position with avalue of zero. The HZERO request is ignored if negative values are present for thehorizontal variable or if the horizontal axis has been specified with the HAXIS option.LHREF line-typeLH line-typespecifies the line type for drawing reference lines that are requested by theAUTOHREF or HREF option. Line-type can be 1 through 46. By default, LHREF 1,a solid line. See Figure 8.22 on page 249 for examples of available line types.LVREF line-typeLV line-typespecifies the line type for drawing reference lines that are requested by theAUTOVREF or VREF option. Line-type can be 1 through 46. By default, LVREF 1,a solid line. See Figure 8.22 on page 249 for examples of available line types.NAME ’entry-name’specifies the name of the catalog entry for the graph. The maximum length forentry-name is eight characters. The default name is GPLOT. If the specified nameduplicates the name of an existing entry, SAS/GRAPH software adds a number to theduplicate name to create a unique entry, for example, GPLOT1.NOAXISNOAXESsuppresses the axes, including axis lines, axis labels, all major and minor tick marks,and tick mark values.VAXIS value-list AXIS 1.99 specifies the major tick mark values for the vertical axis or assigns an AXISdefinition. See the HAXIS on page 824 option for a description of value-list.Featured in: Example 2 on page 835 and Example 3 on page 837VMINOR number-of-minor-ticksVM number-of-minor-ticksspecifies the number of minor tick marks that are drawn between each major tickmark on the vertical axis. Minor tick marks are not labeled. VMINOR overrides theNUMBER suboption of the MINOR option in an AXIS definition. You must specifya positive number.Featured in: Example 2 on page 835VREF value-listdraws one or more reference lines perpendicular to the vertical axis at points thatare specified by value-list. See the HAXIS on page 824 option for a description ofvalue-list.See also: CVREF on page 812 for a description of color specifications for referencelines.
The GPLOT Procedure4BUBBLE2 Statement815VREVERSEspecifies that the order of the values on the vertical axis should be reversed.VZEROspecifies that tick marks on the vertical axis begin in the first position with a zero.The VZERO request is ignored if the vertical variable either contains negative valuesor has been ordered with the VAXIS option or the ORDER option in an AXISstatement.Controlling the Display of BubblesThe BUBBLE statement draws circles only for values that are located within theaxes. Observations with values that lie outside of the axis area are not plotted. If abubble size value causes a bubble to overlap the axis, the bubble is clipped against theaxis line. The bubbles for the highest axis value and lowest axis value may be clippedunless you modify the axes in either of the following ways:3 by offsetting the first and last values3 by adding values to the range that is represented by the axis.Specify the range of values on an axis with the HAXIS or VAXIS option, or withAXIS definitions.To add a right vertical axis, use a BUBBLE2 statement.BUBBLE2 StatementCreates a second vertical axis on the right side of a graph produced by an accompanying BUBBLEor PLOT statement. A second dependent variable can be plotted against this axis.You cannot use the BUBBLE2 statement alone. You can use it only witha BUBBLE or PLOT statement. At least one plot request is required.Global statements: AXIS, FOOTNOTE, TITLERequirements:DescriptionThe BUBBLE2 statement specifies one or more plot requests that namethe horizontal and right vertical axis variables and the variable that controls the size ofthe bubbles. This statement automatically3 scales the axes to include the maximum and minimum data values3 labels each axis with the name of its variable or an associated label3 displays each major tick mark value3 draws circles for values that are located within the axes.You can use statement options to control right vertical axis scaling, draw referencelines on the right vertical axis, control the display of the bubbles, and specify annotation.In addition, you can use global statements to modify the axes (AXIS statement), andadd text to the graph (TITLE, NOTE, and FOOTNOTE statements). You can also usethe Annotate data set to enhance the plot.SyntaxBUBBLE2 plot-request(s) /option(s) ;option(s) can be one or more options from any or all of the following categories:
816BUBBLE2 Statement4Chapter 213 bubble appearance options:BCOLOR bubble-colorBFONT fontBLABELBSCALE AREA RADIUSBSIZE multiplier3 plot appearance options:ANNOTATE Annotate-data-setCAXIS axis-colorCFRAME background-colorCTEXT text-colorFRAME NOFRAMEGRIDNOAXIS3 vertical axis options:AUTOVREFCVREF reference-line-colorLVREF line-typeVAXIS value-list AXIS 1.99 VMINOR number-of-minor ticksVREF value-listVREVERSEVZERORequired Argumentsplot-request(s)each specifies the variables to plot and produces a separate graph. All variables mustbe in the input data set. Multiple plot requests are separated with blanks. A plotrequest must have this form:y-variable*x-variable bubble-sizeplots the values of two variables and draws a circle (bubble) at each data point.The value of the third variable determines the siz
bars, generate box plots, or plot high-low-close stock market data specify that a pattern fill the polygon that is defined by data points smooth plot lines with spline interpolation use a step function to connect the data points "SYMBOL Statement" on page 226 describes all interpolation methods. Concepts Parts of a Plot