Transcription
Performance screens for schoolimprovement: Teacher tenure reformin New York CitySusanna Loeb, Luke C. Miller, James WyckoffStanford University/CALDERUniversity of Virginia / CALDERThanks to Joanna Cannon, Keely Alexander and Anne-Marie Hoxie(NYCDOE) for facilitating access to the data and answering questionsabout the tenure policy.
Teacher tenure Tenure history NJ first tenure law 1909; NY 1917; CA 1921; MI, PA WI 1937 48 states Contentious then, contentious now Policy on two tracks Eliminate tenure GA: eliminated 2001, reinstated 2003ID: passed 2011, voters repealed 2012SD: passed 2012, voters upheld, will eliminate by 2016FL: eliminated in 2011; NC: will eliminate by 2018 Make more rigorous More than half the states require meaningful evaluation 20 states require student test performance 25 states have multiple categories for evaluation
New York City tenure policyTenure decisions: approve, extend or deny(principal recommends, superintendent decides) AY 2009-10 Classroom obs, evals of teacher work products, annual S/D/U ratings Teacher data reports (value-added measures for some teachers); in-classassessments aligned with NY standards District guidance: “tenure in doubt”, “tenure likely”; rationale for cases thatcountered district guidance AY 2010-11 All teachers rated as highly effective, effective, developing, ineffective District performance flags, but no guidance AY 2011-12 Same as before except value-added measures not available in time AY 2012-13 Same as before with State provided growth scores and growth ratings replacinglocal value-added measures
Tenure reform research questions Tenure decisions How did tenure rates change following reform? Workforce composition Are teachers with certain attributes more likely to beaffected by the policy? How did the composition of those continuing to teach inNYC change following reform? School differences How have schools varied in their tenure decisions and thesubsequent behaviors of their teachers?
Data All tenure NYC decisions 2007-08 to 2012-13 Outcomes of each decisionPrincipal ratings of teachers for tenureOfficial guidance from NYCDOE for decisionVariety of other data related to tenure decision Administrative data Teacher: race/ethnicity, value-added, SAT scores,preparation route Students: achievement, race/ethnicity, poverty School: AYP status, grade level, enrollment
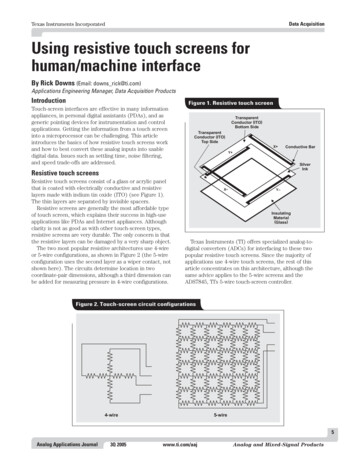
How did tenure rates change following reform?100%Percent of Decisions80%60%New tenure -11Extend2011-122012-13
Which teachers were affected by the policy?Attributes of teachers by tenure decision,2010-11 to 38%URatedDRatedLowAttd5.722.237.1-0.129of 505a SD in 46942.211.16.7490248* Value added results for only 2010-11.Extend v. Approve: p 0.05Extend v. Deny: p 0.05
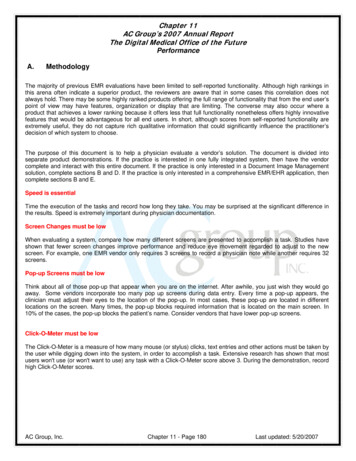
How have schools varied in tenure decisions?50100150 but more than 70 percentof schools approve fewerthan 80 percent of teachers.0Frequency200250Differences in schools’ use of extensions,2009-10 to 2012-13 (N 4, 80% of schools)0.2.4.6.81Proportion ApprovedTenure g 4.14.20.081-0.066-0.1520.086-0.042-0.093Extend v. Approve: p 0.01FreeLunchReduced MathLunch AchieveExtend v. Deny: p 0.05ELAAchieve
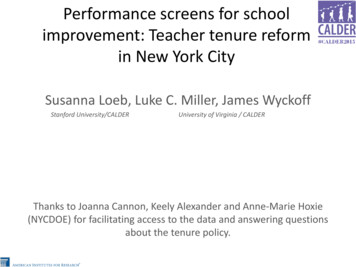
How did the composition of continuingteachers change following reform?Attrition behavior of extended teachers the followingyear, 2010-11 & 2011-12Proportion of Teachers10.80.60.40.20Same SchoolTransferApprovedExtendedExit
How did the composition continuing teacherschange following reform?Teacher attrition behavior and the relationship withextensions, 2010-11 & 2011-12ExtendSchool Fixed EffectPrincipal 7**(9.38) 6,351Exit(5)0.055**(9.07)Morethan a 50% increase intransfer and exit rates 8,8557,9416,3518,855(6)0.038**(3.50) 7,941Notes: ** p .01. T-statistics in parentheses. Standard errors clustered at school level. All regressions include only teachers with Extend orAccept tenure outcomes.a Models also includes school-level student variables: math and ELA achievement, race/ethnicity, free/reduced-price lunch eligibility.
Which teachers replaced extended leavers?Mean School Difference in Teacher Effectiveness between Proxy Replacementand Extended Leavers in Schools with Extended Leavers, 2010-11 and 2011-12Extended Leaver StatusAll Extended leaversExtended transfersExtended exitersPrincipal FinalEffectiveness Rating .298*0.1190.181*0.037Note. Proxy replacement teachers are all teachers hired at the school in 2009 and 2010.Only schools with an extended leaving teacher in 2011 or 2012 included in allcomparisons. Positive values indicate on average within schools average value forreplacement pool exceeds that for the Extended leavers. Comparing extended leavers toproxy replacements: *** p 0.001, ** p 0.01, * p 0.05.
Summary Tenure outcomes: The percentage of teachers approved fortenure fell from 94% to 56% and the percentage havingprobationary period extended increased from 4% to 41%. Widespread use: More than 70% of schools approve fewerthan 80% of teachers with lower approval rates in schools withfewer white and more black students. Improving performance: Extended teachers transfer andvoluntarily exit at rates that are more than 50% higher thanthose approved. Linked to performance: Proxy replacements out-performextended leavers as judged by principals and VAM.
Next StepsTenure reform in NYC is one of several policies availableto principals to improve the quality of teaching. Tenure reform Teacher evaluations 80 minute professional development period New teacher mentoringWe are exploring the ways in which principalsdifferentially employ these policies to improve earlycareer teacher effectiveness, both throughcompositional change and improvements in humancapital.
Appendix Slides
Which teachers were affected by the policy?Teacher DensityMath value added of approved and extended teachers,2010-11-4-202Teacher Math Value AddedTenure DecisionApproveExtend4
How did the composition continuing teacherschange following reform?Attributes of extended teachers by attrition behavior,2010-11 & 2011-12VAMELAVAMMathSATMathSame School-0.091 145482530486539253267Attrition StatusSATLASTVerbal Cert ExamPreparation PathwayTFAIndiv. Eval.Attrition Status College Rec NYCTFSame 13.69.037.717.73.5Notes: ** p 0.01, * p 0.05, p 0.1 – compares same school to transfer/exit
Which teachers were affected by the policy?Tenure decision by final principal effectiveness rating,2010-11 to ly 16.1Deny81.11.60.20.0% teachers2.329.242.615.3N3023,8205,5682,006
improvement: Teacher tenure reform in New York City Susanna Loeb, Luke C. Miller, James Wyckoff Stanford University/CALDER University of Virginia / CALDER Thanks to Joanna Cannon, Keely Alexander and Anne-Marie Hoxie (NYCDOE) for facilitating access to the data and answering questions about the tenure policy.