Transcription
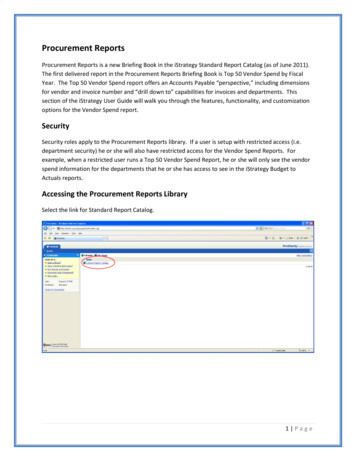
03 0672329026 ch03.qxd6/21/061:51 PMPage 23CHAPTER3Creating Basic Reports with theSAP Query ToolIn this chapterThe SAP Query Tool24Creating a Basic List Query by Using the SAP Query ToolReviewing the Options on Each of the Five Basic ScreensModifying an SAP QuerySaving a Query38Maintaining Queries38372430
03 0672329026 ch03.qxd246/21/061:51 PMPage 24Chapter 3 Creating Basic Reports with the SAP Query ToolThis chapter describes how to create basic list SAP reports by using the SAP Query tool. Itintroduces everything you need to know to create basic list type reports in any applicationmodule of SAP. The step-by-step setup of this chapter makes it easy for any user, regardlessof technical skill level, to create custom reports by using the SAP Query tool.Helpful HintAlthough it is recommended that you create SAP query reports live in your production environment, while youare learning how to use SAP, it is important that you practice in your test quality assurance client so you do notcause any problems in your production environment.The SAP Query Tool3The SAP Query tool, in its standard form, is designed so that an end user with no technicalskills can create a report from scratch. It has five basic screens that an end user can gothrough to create a report. Each of the screens performs a function, and the end user cannavigate between the screens by using navigational arrows on the Application toolbar. Theseare the five basic screens: Title, Format (Screen 1)—You use this screen to give a report a name. Select Field Group (Screen 2)—You use this screen to select the field groups that contain fields you want to include in your report. Select Field (Screen 3)—You use this screen to select the fields from the field groupsyou want to include in your report. Selections (Screen 4)—You use this screen to add any additional fields to your report’sselection screen to further specify your report output upon execution. Basic List Line Structure (Screen 5)—You use this screen to define what you wantthe report to look like.Creating a Basic List Query by Using the SAPQuery ToolThe most frequent comment I hear from fellow SAP customers is that they want the abilityto extract their own information. It is empowering to know that you can go into SAP andselect the data you want and have it come out formatted and sorted in the manner youchoose. This section walks you through how to create a basic list report by using the SAPQuery tool. The following sections explain all the options on the screens used to create thequery report.To create a basic list query by using the SAP Query tool, follow these steps:1. Log in to your SAP client where your query reports will be created. (Best practice dictates that they be maintained in your live Production client.)
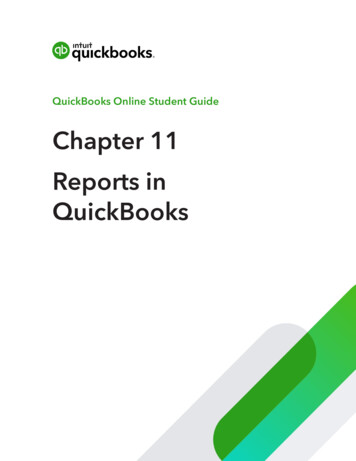
03 0672329026 ch03.qxd6/21/061:51 PMPage 25Creating a Basic List Query by Using the SAP Query Tool252. Navigate to the Maintain Queries Initial screen by using the transaction code /nSQ01.Beginning with R/3 release 4.6A, SAP offers a graphical version of the SAP Query tool,called the Graphical Query Painter; if you have not used the SAP Query tool, theGraphical Query Painter is set as your default. To turn off the Graphical Query Painterand learn to create easy step-by-step reports by using the SAP Query tool, selectSettings, Settings and then deselect the Graphical Query Painter check box.3. The title bar lists the query group you are currently in. For example, your title barmight read Query from User Group ZTEST: Initial Screen. If you are assigned to multiple query groups, press F7 to see a list of all of them.4. As discussed in Chapter 1, “Getting Started with the SAP R/3 Query Reporting Tools,”it is recommended that you create your queries in the standard query area. Ensure thatyou are in the standard query area by selecting Environment, Query Areas and thenselecting Standard Area.5. In the Query field, type DLS QUERY 01 where DLS is your initials) as the name forthe query you are creating, and then click the Create button (see Figure 3.1).Figure 3.1The main screen ofthe SAP Query toollists all the queriesavailable in the designated query group.6. The InfoSets of User Group ZTEST window appears, listing all the available InfoSets(that is, data sources) for your query group. Because you created only one (in my example, I called it ZTEST), in Chapter 2, “One-Time Configuration for Query Tool Use,”it will be the only one listed. Select the InfoSet you created (ZTEST, in my example)and then click the green check mark button.7. The Create Query Title Format screen appears. This screen allows you to save thebasic formatting specifications for your query, including the name (title) and any notes3
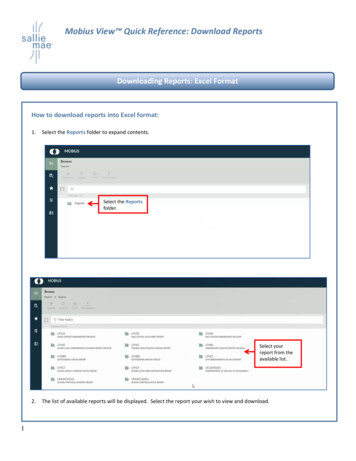
03 0672329026 ch03.qxd266/21/061:51 PMPage 26Chapter 3 Creating Basic Reports with the SAP Query Toolyou want to store for the query. The only required field is the Title (long reportdescription). For this example, fill in only the Title field, as shown in Figure 3.2, andthen click Save. (For my example, I used the title (DLS) SAP Query Exercise #01.)Navigational arrowsFigure 3.2The Application toolbar for the SAP Querytool contains navigational arrows thatpermit you to navigate between thescreens of the query.38. Navigate to the next screen in the SAP query creation process by selecting the NextScreen (white navigational arrow) button from the Application toolbar. (You can use thenavigational arrows to navigate between the different screens of the SAP Query tool.)The Select Field Group screen appears, listing all the Field groups available withinyour InfoSet. Figure 3.3 shows this screen with the field groups Flight Schedule[SPFLI], Flight Demo Table [SFLIGHT], and Flight Booking [SBOOK] listed.9. Place a check mark next to each field group from which you want to include fields inyour report. Navigate to the next screen in the SAP query creation process by selectingthe Next Screen (white navigational arrow) button on the Application toolbar. TheSelect Field screen appears, showing a list of all the available fields in the selected fieldgroups.10. Place a check mark next to each field that you want to include in your report. You canuse the Page Up and Page Down keys to navigate between all the fields (see Figure3.4). Select the Next Screen (white navigational arrow) button from the Applicationtoolbar to open the Selections screen, which lists all the fields you have selected.
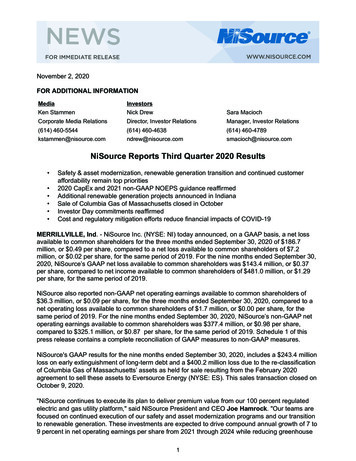
03 0672329026 ch03.qxd6/21/061:51 PMPage 27Creating a Basic List Query by Using the SAP Query Tool27Figure 3.3All the field groupslisted at the top rightof the InfoSet screenduring configurationof the InfoSet arelisted on this screen.3Figure 3.4All the fields listed inthe field groups atthe top right of theInfoSet screen duringconfiguration arelisted here.Page down to endSingle page downPage up to topSingle page up11. If desired, add any of the fields to the selection screen that will be presented when youexecute your report. You can add a field to the Selections screen by placing a checkmark next to each one (see Figure 3.5).
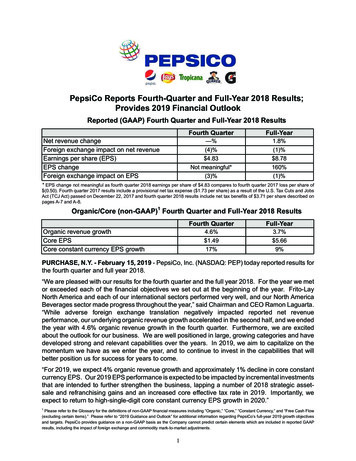
03 0672329026 ch03.qxd286/21/061:51 PMPage 28Chapter 3 Creating Basic Reports with the SAP Query ToolFigure 3.5Having fields availableon the report’s selection screen gives youthe ability to specifyyour report outputupon execution.312. Click the Basic List button from the Application toolbar to create an SAP basic listquery. The Basic List Line Structure screen appears, showing a list of the fields youselected to include in your report.13. For each field, specify the line and sequence number as you want them to appear onyour report. Also use this screen to indicate sort order, totals, and counts, if needed.Start by entering the line and sequence numbers, like the ones shown in Figure 3.6.Figure 3.6Basic output optionsare defined on theSAP Query tool BasicList Line Structurescreen.
03 0672329026 ch03.qxd6/21/061:51 PMPage 29Creating a Basic List Query by Using the SAP Query Tool29N OTEYou can use Figure 3.6 as follows: Line column—The values in this column correspond to the line numbers the fieldswill appear on in the report. Sequence column—The numbers in this column determine the order of the fieldsfor the line. Sort column—This column dictates the order in which the data will be sorted. Line Structure box—After you click the Save button, a preview of the formatappears in the Line Structure box at the bottom of the screen.14. For this example, proceed directly to the report by pressing F8, which causes the reportto execute.15. As with almost all other reports in SAP, when you execute this report, you see thereport’s selection screen. Specify any criteria for the output of your report. Notice thatany fields indicated on the Selections screen are included on your selection screen,under the heading Program Selections (see Figure 3.7).Execute buttonFigure 3.7Selection screensenable you to furtherspecify report output.16. Select the F8 Execute button on your Application toolbar (it looks like a clock) to display your finished report. Your report output appears; it should look similar to what isshown in Figure 3.8. (Keep in mind that the actual values vary by organization: Theoutput of the report corresponds to the specification entered on the Basic List LineStructure screen.)3
03 0672329026 ch03.qxd306/21/061:51 PMPage 30Chapter 3 Creating Basic Reports with the SAP Query ToolFigure 3.8In SAP 4.6 and higher,by default, yourreport displays in theSAP List Viewer.3Reviewing the Options on Each of the FiveBasic ScreensThe following sections serve as a reference of what options are available on each of the fivebasic screens of the SAP Query tool.The Title, Format ScreenThe Title, Format screen, shown in Figure 3.9, is where you insert the basic data about yourreport, including its title and the format in which you want it displayed. The Title, Formatscreen stores the basic report processing options for your report. For organizational purposes, it is a good idea to enter the name of the user who created the report in the Notessection of this screen. The following sections describe the options available on this screen.Figure 3.9The Title, Formatscreen.
03 0672329026 ch03.qxd6/21/061:51 PMPage 31Reviewing the Options on Each of the Five Basic Screens31List FormatBy default, on execution, a report is displayed in the SAP List Viewer (refer to Figure 3.8).The options listed in the List Format section apply only if you change the output format toappear in a text file or ABAP list. List Format options available on the Title, Format screenallow you to designate the line and column width of your report.You use the Lines field to specify the number of lines to be output on one page for a listgenerated by the query. The default is blank, which outputs a continuous list on a singlepage. You can use the Lines field to enter the number of lines to be output on a single page.If you do not want page breaks, you should leave this field empty. The Columns field storesthe number of columns per line. This field determines the maximum number of charactersthat can be displayed on one line of the list created by the query. Lines exceeding this lengthare broken. The maximum number permitted is 255. The number entered in the Columnsfield should be the closet estimation possible, because it helps determine the printed layoutof the report. For example, if you set all reports to be the maximum of 255 so that all yourcolumns fit on a single line, your printed report may contain very small text to accommodateall 255 columns. Again, these settings are required only if the output format is a text file oran ABAP list. (See the section “Output Format” on the next page.)Special AttributesThe Special Attributes section allows you to specify whether the report should run with avariant. (Variants are introduced in Chapter 6, “Using Reporting Selection Screens:Advanced Skills.”) You use the Change Lock check box to indicate whether you want otherusers to be able to make changes to your query. By default, this check box is unmarked, indicating that any other user in your query group who has the appropriate authorizations canmake changes to your report. To prevent this, select this check box for each new query youcreate.Table FormatYou use the options listed in the Table Format section only if you change the output formatto appear in a table. (See the section “Output Format.”) You use the Columns field in theTable Format box to indicate the maximum number of characters for the width of a tableview control if you select your data to be viewed as a table. You can use table view controlsto display the data of single-line basic lists, statistics, and rankings in a special format. Thisspecification affects only the visible width, and the table control may contain more datacolumns than are visible in a single R/3 window.Print ListThe Print List box includes the With Standard Title check box, which you use to indicatewhether you want your output to include the standard title that you specified at top of thescreen, in the Title field. By default, this box is selected. You use the No. of Characters LeftMargin box to specify how many characters to save room for at the left side of the page inthe printed report, in case you want to have room for binding or punched holes.3
03 0672329026 ch03.qxd326/21/061:51 PMPage 32Chapter 3 Creating Basic Reports with the SAP Query ToolOutput FormatUpon report execution, your report is displayed in the SAP List Viewer format (refer toFigure 3.8). The Output Format options allow you to have a report’s data output in differentformats. The default setting is SAP List Viewer, which is a screen that appears very similarto a Microsoft Excel worksheet and is the standard for all reports in SAP version 4.6C andhigher. The options available in this box are described in Table 3.1.Specifying an output option on the Title, Format screen of the SAP Query tool ensures thatwhen the report is executed, it will be displaye
The SAP Query tool, in its standard form, is designed so that an end user with no technical skills can create a report from scratch. It has five basic screens that an end user can go through to create a report. Each of the screens performs a function, and the end user can navigate between the screens by using navigational arrows on the Application toolbar. These are the five basic screens .