Transcription
Dimensions of Data Quality:Toward Quality Data by DesignY. Richard WangLisa M. GuarascioAugust 1991IFSRC Discussion Paper #CIS-91-06Composite Information Systems LaboratoryE53-320, Sloan School of ManagementMassachusetts Institute of Technology30 Wadsworth StreetCambridge, Mass. 02139AT1TN: Prof. Richard WangTel. (617) 253-0442Fax. (617) 734-2137Bitnet Address: rwang@sloan.mit.eduACKNOWLEDGEMENTSResearch conducted herein has been supported, in part, by MIT'sInternational Financial Services Research Center. The authors wish to thank Professor FranceLeClerc for her advice on how to conduct the survey and analyze the survey results. Thanks are alsodue to Karen Lee for conducting field work and contributing ideas during this project, and Dae-ChulSohn and Inseok Cha for their assistance.
Dimensions of Data Quality:Toward Quality Data by DesignABSTRACTAs experience has shown, poor data quality can have serious social and economicconsequences. Yet before one can address issues related to analyzing, managing and designing qualityinto data systems, one must first understand what data quality actually means. Furthermore, as is thecase with manufacturing and sevice organizations, quality should be defined in relation to theconsumer's needs and desires, not the producers. Thus, the focus of this paper is to identify thedimensions of data quality, as defined by actual data consumers, through well defined researchmethodologies instead of experience, anecdotes, and intuition. The end result of our research andanalysis of data consumers yielded the following data quality dimensions.(1)(2)(3)(4)(5)(6)(7)BelievabilityValue AddedRelevancyAccuracyInterpretabilityEase of utationRepresentational ConsistencyCost Effectiveness(15)(16)(17)(18)(19)(20)Ease of OperationVariety of Data & Data SourcesConciseAccess SecurityAppropriate Amount of DataFlexibilityThe most striking results of this analysis are that data quality means much more than just accuracy todata- consumers, and that even accuracy is more complex than previously realized. Specifically,Believability, Value Added, and Relevancy were rated as more important to data consumers thanaccuracy, and data consumers valued the ability to trace data, the reputation of the data, and datasource in order to assure themselves of the accuracy of the data. These dimension s can be applied tohelp analyze data quality and formulate quality data policy. More significantly, they can be used toestablish a research foundation for the design of Quality Data Models and the development of QualityData Base Management Systems.
1. Introduction .1.1 Data Quality: A Vital Social and Econom ic Issue.1.2 Research Focus and Significance.21.3 W ho Defines Data Quality?.31.4 What is a Dim ension?.31.5 Paper Organization.2.Research Design.2.1 Data Analysis M ethod.2.2 First Survey: Generation of Data Quality Attributes .2.3 Second Survey: Collecting Data for Uncovering Dimensions.6Pre-Test.Survey Target Population.83.Data Analysis of the Second Survey Responses.83.1 Descriptive Statistics.3.2 Factor Analysis Specifics and Results.3.3 N aming the Dim ensions.3.4 Elaborating on the Dimensions.4. Sum mary and Future Directions.5. References.26114445689111320
Dimensions of Data Quality:Toward Quality Data by Design1. IntroductionSignificant advances in the price, speed-performance, capacity, and capabilities of newdatabase and telecommunication technologies have created a wide range of opportunities forcorporations to align their information technology for competitive advantage in the marketplace.Across industries such as banking, insurance, retail, consumer marketing, and health care, thecapabilities to access databases containing market, manufacturing, and financial information arebecoming increasingly critical (Cash & Konsynski, 1985; Clemens, 1988; Goodhue, Quillard, & Rockart,1988; Henderson, 1989; Ives & Learmonth, 1984; Keen, 1986; Madnick, Osborn, &Wang, 1990; Madnick &Wang, 1988; McFarlan, 1984).It has been concluded, in a multi-year MIT research program, that corporations in the 1990s willintegrate their business processes across traditional functional, product, and geographic lines. Theintegration of business processes, in turn, will accelerate demands for more effective application systemsfor product development, product delivery, and customer service and management (Morton, 1989;Rockart & Short, 1989).Increasingly, many important applications require access to corporatefunctional and product databases which have disparate levels of data qualities. Poor data quality,unfortunately, can have a substantial impact on corporate profits, as the literature reveals (Ballou &Tayi, 1989; Bodner, 1975; Hansen, 1983; Hansen & Wang, 1990; Laudon, 1986; Lindgren, 1991). Weillustrate, in the following examples, the social and economic impact of data quality.1.1 Data Ouality! A Vital Social and Economic IssueCredit reporting is one of the most striking examples of serious social consequences related toinaccurate data. The credit industry not only collects financial information on individuals, but alsocompiles employment records. The impact of an error on a credit report can be more devastating to anindividual than merely the denial of credit. One congressional witness testified that "he lost his jobwhen he was reported as having a criminal record.a record that really belonged to a man with a
similiar namel." Another witness told how he had been plagued by bill collectors for over nine months:bill collectors who were trying to recover money owned by another man with the same name. In light ofthese testimonies, it is astonishing to learn from the New York Times and CBS evening news thatConsumer's Union found that 48 percent of the credit reports that they surveyed contained errors, and 19percent "had mistakes that could cause denial of credit, insurance or employment." 2When poor data quality results in poor customer service, there can be a direct negative impacton the corposrate bottom line. One of the largest providers of optical fiber in the world (Hansen &Wang, 1990) uses an automated computer system to mark fiber before shipment to customers because ofthe enormous variety of fiber produced. In early 1990, a data accuracy problem caused the system tomislabel a fiber shipment which subsequently was installed under a lake in the state of Washington.When the fiber malfunctioned, the company was forced to pay 500,000 for the removal of the cable,replacement of the experimental fibers, rebundling of the cable, and reinstallation of the cable.Although the company did everything it could to correct the problem, the damage to its reputation forcustomer service and quality was serious.As another example, Boston City Hall discovered 6 million dollars worth of overcharges intheir telephone bills over a period of years (Lindgren, 1991).1.2 Research Focus and SignificanceBefore one can address issues involved in analyzing and managing data quality, one must firstunderstand what data quality actually means. Just as it would be difficult to effectively manage aproduction line without understanding the attributes which define a quality product, it would also bedifficult to analyze and manage data quality without understanding the attributes which definequality data.The focus of this paper is to identify data quality dimensions through well-defined researchmethodologies instead of experience, anecdotes, and intuition. These dimensions, once defined, can beapplied to help analyze data quality and formulate quality data policy.12Source: Washington Post, June 9, 1991Source: New York Times, June 7,1991
More significantly, it would establish a research foundation for the design of Quality DataModels and the development of Quality Data Base Management Systems. Modem database systemshave been designed from the system perspective.Consequently, the integrity constraints andnormalization theories (Maier, 1983), which are used to maintain the integrity and consistency of datastored in the database (Date, 1990), are necessary but not sufficient to attain the data qualitydemanded by non-system constituents.1.3 Who Defines Data Quality?The importance of looking at quality from the consumer's viewpoint has been stressed (Garvin,1987):"To achieve quality gains, I believe, managers need a new way of thinking, aconceptual bridge to the consumer's vantage point. Obviously, market studies acquirea new importance in this context.One thing is certain: high quality means pleasingthe consumer, not just protecting them from annoyances. (Garvin, 1987, p. 104)"We chose to use Garvin's approach to defining data quality. That is, data quality is notdefined by the producers or managers of data, such as Information Systems (IS) departments, butinstead, is defined by the data consumer. Data quality, defined from this perspective, can be used byresearchers and practitioners to direct their efforts toward quality data by design for data consumersinstead of the IS professionals.1.4 What is a Dimension?For a manufacturing firm, the concept of quality encompasses much more than material defects.Garvin has developed a framework encompassing eight dimensions of quality: performance, features,reliability, conformance, durability, serviceability, aesthetics, and perceived quality (Garvin, 1988).Likewise, data quality encompasses much more than simply the accuracy of data. Thus, before wediscuss specific data quality dimensions, we first must clarify what we consider to be the underpinningsof a data quality dimension.We define a data quality dimension as a set of adjectives or characteristics which most dataconsumers react to in a fairly consistent way. That is, one thinks about the importance of all adjectivesin the set in the same way, and this similarity holds across a majority of data consumers. For example,suppose that the adjectives objective and unbiased were grouped together from analysis and identified
as a factor named objectivity: objectivity would be a dimension because most data consumers think ofobjective and unbiased to be part of the same dimension. In other words, if a person in strategic planningsaid objectivity was not important, then he/she would also consider unbiased not important. At thesame time, a person in finance who considers objectivity crucial also would think that unbiased iscrucial. Thus, a dimension is an underlying construct that data consumers use when evaluating data.1.5 Paper OrganizationSection 2 describes the research design, in particular the data analysis method, the generationof data quality attributes for identifying the dimensions of data quality, and the collection of data foruncovering the dimensions. Scetion 3 analyzes the data. We first present the descriptive statistics ofthe data. Next we present the factor analysis specifics and results. Based on the component loadingsfrom the factor analysis, we define the dimensions uncovered and elaborate on each of thesedimensions. Concluding remarks are made in Section 4.2.Research DesignThis section describes the method for data analysis, the generation of data quality attributes,and the collection of data for uncovering the dimensions of data quality.2.1 Data Analysis MethodUpon preliminary analysis of the analytical tools and methods that are most commonly used todefine consumer constructs and analyze data (Lehmann, 1989), we identified six methods: factoranalysis, conjoint analysis, analysis of variance, cluster analysis, multidimensional scaling, anddiscriminant analysis. We chose to use factor analysis because one of the most frequent applications offactor analysis is to uncover an underlying data structure.Factor analysis assumes that the surveyed variables are manifestations of a number of key, butunmeasured constructs. It then attempts to identify these underlying constructs by examining therelations among the responses to the surveyed variables. The rationale behind factor analysis is thatthe observed responses are actually produced by some unobserved factors. It is an ideal method forboiling down a large number of variables into a small number of factors. Since identifying key
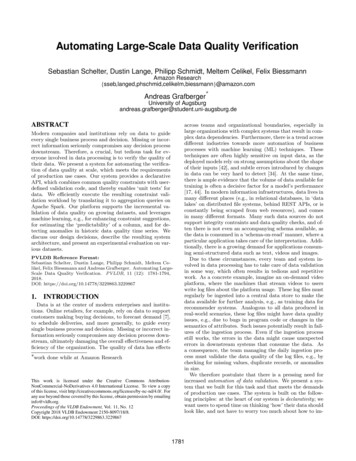
dimensions of data quality is our primary research goal, factor analysis is well-suited for our purposes.Mathematically, factor analysis repeatedly generates groups of attributes based on how thesurveyed variables are correlated and how many factors to retain. Based on these results, the analystattempts to name these factors.Note that the factors to be uncovered depend critically on theattributes that are rated by the respondents. Thus, we must be fairly complete in the specification ofrelevant attributes in order to generate reliable results. Toward that goal, we conducted a first surveyto enumerate all relevant attributes, followed by a second survey to collect data for uncovering dataquality dimensions.2.2 First Survey? Generation of Data Quality AttributesLiterature review, brainstorming, and a field study were used in the first survey to generate afairly complete set of data quality attributes. Our literature review and brainstorming sessionsrevealed a list of data quality attributes, as shown in Figure rectnessCostCredibilityCriticalData ExchangeDependabilityDepthEase MaintenanceEase of AccessEase of UpdateEase of ariety 'Well-documentedFigure 1 An Initial List of Data Quality AttributesSince the dimensions of data quality resulted from factor analysis depended, to a large extent,on the attributes that would be discovered in the first survey, we decided that: (1) the number ofsubjects for the first study should be as large as possible; (2) we should be able to have individualcontact with the subjects in order to fully understand their answers; and (3) the subjects should be dataconsumers with diverse perspectives.Toward that goal, we interviewed and administered the first survey over the phone torespondents currently working in the industry. In parallel, we conducted the survey at the MIT SloanSchool of Management.During the personal interviews with industry respondents, not only wereattributes generated but also the attribute's meaning in the interviewee's mind discussed. More than
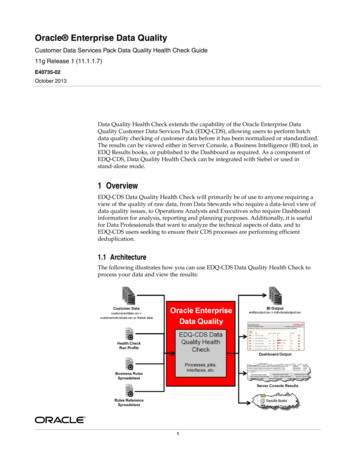
one hundred Sloan MBA's students participated in the self-administered survey. They came from awide range of industries, and had an average age of more than 30.As shown in Appendix A, the first survey included two sections for eliciting data qualityattributes. The first section was used to elicit the respondents' first reaction to data quality, similar tobrainstorming. They were simply asked to list those attributes which first come to mind (in addition totimeliness, accuracy, availability, and interpretability) when they think of data quality.In thesecond section, the remaining attributes shown in Figure 1 were given to "spark" any additionalattributes.This process resulted in over 170 unique responses, as shown in Figure 2. Only ten attributes werementioned by more than half of the participants. These results further support the use of factoranalysis for uncovering the actual underlying quality dimensions.2.3 Second Survey: Collecting Data for Uncovering DimensionsThe list of attributes shown in Figure 2 was used to develop the second survey questionnaire.Since we had recorded all unique responses in their original format, there was some degree ofduplication, such as "parsimony" vs. "parsimoniousness." When this occurred, we kept the one thatwas cited most often and eliminated the others. A questionnaire was developed based on the resultingattributes. The question format for factor analysis is simple. This simplicity lends itself to largerresponse rates and a survey that is more understandable to a larger number of respondents.Pre-TestBecause of the simplicity of the survey itself, the questionnaire requires only a small number ofpeople to be sampled. Therefore, we solicited eleven respondents: three industry executives, fourprofessionals, two professors, and two MBA students. No major changes were made in the format of thesurvey as a result of the pre-test. The most significant content change was the elimination of thoseattributes (or phrases) which a majority of respondents did not understand or did not see any relationbetween the attributes and data quality. Based on the results from the pre-test, our final second surveyquestionnaire included 118 data quality questions (i.e., 118 variables for factor analysis), as shown inAppendix B.
Ability to be Joined VithAbility to DownloadAbility to Identify ErAbility to UploadAccess by CompetitiAccessibilityAccuracyAdaptabilityAdequate DetailAdequate nt of DataAuthorityAvailabilityBelievabilityBreadth of DataBrevityCertified DataClarityClarity of OriginClear Responsibility over DataCompactnessCompatabilityCompetitive rruptionCostCost of AccuracyCost of CollectionCreativityCriticalCustomabilityData HierarchyData Improves EfficiData OverloadDefinabilityDependabilityDepth of DataDetailDetailed SourceDispersedDynamicEase of AccessEase of ComparisonEase of CorrelationEase of Data ExchangeEase of Distinguishing Updated FilesEase of MaintenanceEase of RetrievalEase of UnderstandingEase of UpdateEase of UseEasy to ChangeEasy to ityExtentFinalizationFlawlessnessFlexibilityForm of PresentationFormatFormat IntegrityFriendlinessGeneralityHabitHistorical CompatibilityImportanceonalizedPert nentPort abilityPrec isenessPrec isionProp rietary NaturePurp0seQua ntityRati onalityRed undancyReg ularity of FormatRel. VanceReli abilityRep etitiveRep roduceabilityRep utationRescolution of GraphicsRes ponsibilityRetrievabilityRev ealingRev iewabilityRigi dityRob ustnessSco pe of InfoSecrecySec uritySelf -CorrectingSem antic InterpretationSem anticsSizeSpe ractiveInterestingLevel of AbstractionLevel of StandardizrionLocalizedLogically eets RequirementsMinimalityModularityNarrowly tyPast ExperiencePedigreeSta bilityStor ageSyn chronizationTim elinessTim e-indepenencyTra nslatableTrai sportabilityUna mbiguityUnt iasedUndlerstandabilityUndlerstandableUni quenessUnc rganizedUp- to-DatenessUsa bleUse fulnesUse r FriendlyVal idValVa iabilityVarietyVer ifiableVol atilityWe ll-DocumemedWe ll-PresentedFigure 2 Data Quality Attributes Generated from the First Survy
Survey Target PopulationWe chose to survey the MIT Sloan alumni who reside in the U.S. They consist of individuals ina variety of industries, departments, and management levels, thus satisfying the requirement that ourpopulation sample should consist of a wide range of data consumers with different perspectives. Wealso hoped that the alumni would be more responsive to the questionnaire survey.The total number of alumni up until 1989 in the United States was 3215. Of this population, werandomly selected 1500, a little less than 50%, individuals. Our survey was mailed along with a coverletter to explain the nature of the study, the time to complete the survey (less than 20 minutes), and itscriticality. We gave respondents a six week cut-off period to respond to the survey if they were to beentered into the data set. Most of the alumni received the surveys at their home address. In order toassure a successful survey, we also sent out all the survey questionnaires via first-class mail. As aresult, follow-up calls were not needed due to the high response rate by the end of the third week(20%).3. Data Analysis of the Second Survey ResponsesThis section presents the overall descriptive statistics of our sample, the specifics of the factoranalysis used, and the details of the resulting data quality dimensions.3.1 Descriptive StatisticsOf the 1500 surveys mailed, 16 were returned because they were undeliverable.Of theremaining 1484, 355 viable surveys were returned by our six week cut-off response date. Surveys withsignificant missing values or surveys returned by academics were not considered viable. Thus, they wereeliminated from our analysis. This represented an effective response rate of 23.92 percent, which ismore than sufficient for our purpose.The responses were spread fairly evenly over industry. Specifically, there was about 28% fromthe service, 33% from manufacturing, 19% from finance, and the remaining cited "Others." The finance,marketing/sales, and operations departments evenly makeup 40% of the respondents. There were arelatively large number of respondents who circled "Other." Frequently, these respondents were upper
level managers, such as presidents or CEO's, or consultants.What follows are only the highlights of the descriptive statistics for all 118 variables.Missing Responses: There does not appear to be any attributes (or phrases) that wereparticularly unclear or hard to answer. While none of the variables had 355 responses, only four hadless than 342 responses. The exceptions were quality of resolution, time independent, robust and criticalwith 329, 334 , 338 and 333 responses respectively. In addition, there does not appear to be anysignificant pattern to the missing responses.Variable Ranges: On our scale where 1 was extremely importantand 9 not important, almostevery variable had a minimum value of 1 and a maximum value of 9. The exceptions were accuracy,reliability, level of detail and easy identification of errors. Thus for the majority of variables, therewere respondents who felt it was an extremely important attribute, and respondents who felt it was notimportant at all. Accuracy and reliability had the smallest range with values ranging from 1 to 7;level of detail and easy identification of errors went from 1 to 8.Variable Means: 99 of the variables had means less than or equal to 5. That is, most of thevariables surveyed were considered to be important data attributes. The two variables with means lessthan 2 were accuracyand correct, with means of 1.771 and 1.816 respectively. Time independent hadthe highest mean of 6.772. Thus, this variable is one of the least important variable in the survey.3.2 Factor Analysis Specifics and ResultsThe data quality dimensions were uncovered using factor analysis on the 355 survey responses.All analysis was performed using SYSTAT Version 5.1 for the Macintosh.Eactor Method: We used the multiple principal components method, a variant of factoranalysis, on the variable correlation matrix to group variables by factor. We then used the VARIMAXrotation method to clarify the grouping pattern represented by the original principal componentdimensions. We chose to use principal components analysis, as opposed to the common factor model, forthe following reasons:"Principal Components is a reproducible procedure in accounting for common variance in aset of associated variables", whereas "the common factor model does not produce exactfactor scores." "Common Factor scores also have to be estimated and there is no
requirement that the estimated scores be uncorrelated across factors. In principalcomponents, however, uncorrelated component scores are guaranteed in the model" "Thecomponents model is less susceptible to misinterpretation, since it entails linearcombinations of actual variables." (Green, 1988 #391)In short, we chose principal component analysis because the results are reproducible, lesssusceptible to misinterpretation, and factor scores will be uncorrelated across factors.Factored Matrix: We chose to analyze the correlation matrix instead of the covariance matrix.The resulting component loadings from the correlation matrix represent the correlation of each originalvariable with each component. Whereas, the covariance loadings represent the covariance of theoriginal variable with each component. Thus, the correlation component loadings are believed by mostresearchers to be more intuitive measures of variable and factor association.Convergence Criteria: As specified by the SYSTAT, the convergence criteria for stopping theanalysis is either 25 iterations or a tolerance level, which is defined as "the amount of variance anoriginal variable shares with all other variables," of .001 (Hair, 1987 #392). In our case, we reachedthe tolerance level before 25 iterations.Limiting the Number of Computed Components: SYSTAT offers two methods for limiting thenumber of computed components. One can either directly specify the number of desired factors or specifya minimum eigenvalue. A priori specification of the number of components was not an option for ouranalysis because there is no underlying theory which specifies how many dimensions one would expectto find. Thus, we applied the eigenvalue method and chose to limit the number of components using the"eigenvalue greater than 1" rule.The "eigenvalue greater than 1" rule makes intuitive sense because it assures that each factorexplains at least as much variance as a truly independent variable would explain. In our case, we have118 variables. Thus, if they were all independent, we would get 118 components. Each would explain1/118 or .85% of the total variance where 1 is the eigenvalue of the component and 118 is equal to thenumber of components.By using the "eigenvalue greater than 1" rule, we limit the number of principle components tothe number of variables with eigenvalues greater than 1. Thus, any component after this cutoff numberof components explains a smaller amount of variance than an independent variable would explain and
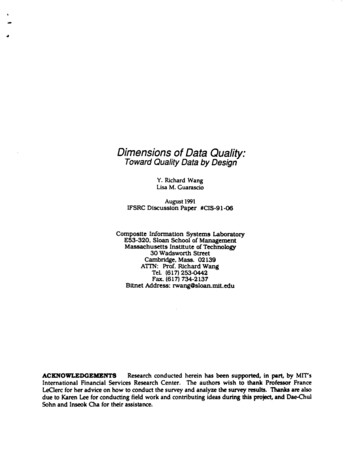
does not aid in understanding the factor structure. On the other hand, if one were to set the maximumeigenvalue to be greater than 1, one runs the risk of eliminating possible valuable dimensions. Since ourresearch goal is to uncover new data quality dimensions without eliminating any potential dimensions,the "eigenvalue greater than 1"choice is correct.Rotation Method: The original principal component solution was rotated using the VARIMAXrotation scheme. It orthogonally rotates the independent components or factors to generate factorloadings which are either close to 1 or 0, making the subsequent assignment of variables to factors asself-evident as possible.Assignment of Variables to Components: Our resulting components consist of those variableswhose rotated component loadings were greater than .5. That is, a variable was assigned to aparticular component if the correlation between the component and the variable was at least .5.Although this approach may appear simplistic, it is quite rigorous (Hair, 1987 #392).3.3 Naming the DimensionsThe initial principal component analysis generated 29 components which explained 73.909percent of the total variance in the data. Nine components were eliminated based on the followingcriteria: (1) a .5 loading cut-off point, (2) importance of the component as the respondents rated, and (3)the interpretability of the component. The remaining 20 dimensions explained 59.296% of the totalvariance, as shown in Table 1.These dimensions are named as follows:(1)(2)(3)(4)(5)(6)(7)BelievabilityValue AddedRelevancyAccuracyInterpretabilityEase of utationRepresentational ConsistencyCost Effectiveness(15)(16)(17)(18)(19)(20)Ease of OperationVariety of Data &Data SourcesConcisenessAccess SecurityAppropriate Amount of DataFlexibility
Table 1 Complete list of dimensions (DIM), their adjectives, the component loading (CL),and the %of variance (% VAR) explained by the ve EdgeAdds AR1.4081.991ADJECTIVECLReputation of SourceData Reputation0.780.732.867Same FormatConsistently RepresentedConsistently FormattedCompatable w/Previous Data0.700.660.570.575.361Cost of CollectionCost of AccuracyCost .5
Likewise, data quality encompasses much more than simply the accuracy of data. Thus, before we discuss specific data quality dimensions, we first must clarify what we consider to be the underpinnings of a data quality dimension. We define a data quality dimension as a set of adjectives or characteristics which most data