Transcription
Advances in Intelligent Systems Research, volume 172Sriwijaya International Conference on Information Technologyand Its Applications (SICONIAN 2019)Data Quality Management Evaluation: A Case Study atthe BPS-Statistics of Kaur Regency Bengkulu ProvinceRela SABTIANA1*, Indra BUDI2, and Yova RULDEVIYANI31rela@bps.go.id, BPS-Statistics of Kaur Regency Bengkulu Province, Indonesiaindra@cs.ui.ac.id, Faculty of Computer Science, Universitas Indonesia, Depok, Indonesia3yova@cs.ui.ac.id, Faculty of Computer Science, Universitas Indonesia, Depok, Indonesia*Corresponding author: rela@bps.go.id2ABSTRACTThe BPS-Statistics of Kaur Regency is a work unit under the BPS-Statistics of the Republic of Indonesiawhich is responsible for carrying out statistical activities in the regency area and contributes a large role inthe effort of improving data quality of each survey or census before being published to the public. In theimplementation of the National Socio-Economic Survey conducted by the organization in the first semesterof 2019, it was found incompleteness, inconsistency, and inaccuracy during data entry in the application.Likewise, post entries are still found inconsistencies and inaccuracies. To overcome this problem, anevaluation of the maturity level of data quality management using Loshin’s Data Quality Management wasdone. The results obtained indicate that the maturity level is in the range of 2 to 3. Four out of eightdimensions have not met the expected targets, namely expectations of data quality, data quality protocols,data standards, and technology. In addition, to supplement the result, measurement using European StatisticalSystem framework indicates that the total score achieved is 5.7 of the expected target of 9.4. Further, fromthe results of this study, the recommendation for improving data quality were compiled.Keywords: data, data quality, Data Quality Management, maturityINTRODUCTIONThe Central Statistics Agency (BPS-Statistics) is a NonMinistry Government Institution that provides data needsfor the government and the community. BPS-Statistics hasa vision that is "Pioneer of Reliable Statistical Data for All"as stated in BPS-Statistics’s Strategic Plan Year 20152019. As a data provider, BPS-Statistics is demanded toalways provide quality data. Quality means the resultingstatistical data meets the dimensions of data quality that arerelevant, accurate, timely, coherent, accessible, andinterpretable [1].In the context of fulfilling the wishes of data users for theavailability of quality data, BPS-Statistics seeks to makefundamental changes to statistical activities by reformingthe bureaucracy. One of the goals of the BPS-Statisticsbureaucratic reform is to build the profile and behavior ofBPS-Statistics officials who are professional, have highintegrity, and carry out the mandate of providing excellentservice for quality statistical data and information [2]. Thisis in line with the Performance Agreement of BPSStatistics Year 2017 which states that one of the goals ofBPS-Statistics is to improve quality statistical data [3].Increasing quality statistical data is the first objective forBPS-Statistics of the Republic of Indonesia with noexception for all subunits working under it. BPS-Statisticsin a regency is the smallest work unit that contributes a bigrole in achieving BPS-Statistics of the Republic ofIndonesia’s objectives to improve data quality. This is dueto its role in collecting data directly to respondents, as adata processor and at the same time as a place fordisseminating data [4].The BPS-Statistics of Kaur Regency is a work unit underthe BPS-Statistics of the Republic of Indonesia which isresponsible for carrying out statistical activities in theregency level, particularly Kaur Regency, BengkuluProvince. The main activities carried out by BPS-Statisticsof Kaur Regency include conducting various surveys andcensuses. Further, those activities produced various datasuch as social, agricultural, and economic data. For thisstudy, the data samples used are social data that was takenfrom the National Socio-Economic Survey (Susenas) ofMarch 2019. Susenas is a regular survey that providesdevelopment data in the socio-economic field at thenational, provincial, and regency/municipality level.Susenas has the main support for meeting the needs of thegovernment in implementing national development in linewith international development goals. Susenas wasconducted to provide a portrait of development progress.The portrait must be accurate and able to be trusted by thepublic at large [5].To ensure the quality of Susenas data, the BPS-Statistics ofKaur Regency did some efforts initiated with training,supervising until checking documents to validate dataentry. But in reality, the data still do not free of errors. Inthe core module data entry application, it was found 8,344error records and in the expenditure consumption module,it was found 12,535 error records. The detail of errors isshown in Table 1.Copyright 2020 The Authors. Published by Atlantis Press SARL.This is an open access article distributed under the CC BY-NC 4.0 license -http://creativecommons.org/licenses/by-nc/4.0/.58
Advances in Intelligent Systems Research, volume 172Table 1. Lists of ErrorsError TypesNumber of RecordsCore ModuleIncompleteness2.534 (30,3%)Inconsistency5.710 (68,4%)Inaccuracy107 (1,3%)Expenditure Consumption ModuleIncompleteness1.242 (9,9%)Inconsistency6.116 (48,8%)Inaccuracy5.176 (41,3%)Besides those errors, errors were found also in post-entrydata. This shows that the BPS-Statistics of Kaur Regencystill does not meet the expected data quality standards. Theerrors found will affect the output data generated whichwill later be presented to the public. All this time, theassessment of the output results presented to the publiccould be known from the consumer satisfaction index. In2018, the value of the consumer satisfaction index was77.08. It was lower than average, left behind otherregencies/municipalities. It indicates that BPS-Statistics ofKaur Regency needs some improvements in data qualitymanagement.Based on the identification of the problems mentionedabove, the basis of this research is the need for evaluationof data quality management. Furthermore, the researchquestion for this study is "How is data quality managementin BPS-Statistics of Kaur Regency?" The purpose of thisstudy is to compile recommendations based on the resultobtained.THEORYrelevant and timely data are used by data consumers in thedecision-making process; and (4) Consumers must findaccurate data. For instance, data are correct, objective andcomes from trusted sources. Furthermore, the conceptualframework of data quality is divided into four, namelyintrinsic, contextual, representational, and accessibility,each of which has a data quality dimension that forms it.Data Quality Management (DQM)Data quality management is defined as a business processthat ensures the integrity of organizational data duringcollection, applications (including aggregation), storage,and analysis. The main outcome of DQM is knowledgeabout data quality and its suitability for applicable usagefor all intended purposes. The DQM function involvescontinuous quality improvement for data qualitythroughout the company and includes data applications,collection, analysis, and storage [9]. DQM plays animportant role as a supporter in the management of changesin an organization. DQM is also a process that continuouslydefines the acceptable levels of data quality parameters tomeet business needs [7].DataAccording to Oxford Dictionary, in the mid-17th century(as a term in philosophy) in Latin, data are plural of datumwhich are defined as facts and statistics collected togetherfor reference or analysis [6]. Meanwhile, according to [7],data are a representation of facts as text, numbers, graphics,images, sounds or videos. The data which are given contextwill become information and then the information willcontribute to knowledge. Data have an important role in anorganization. Data are required to have high quality inorder to make a decision in an organization. [8] propose aninitial conceptual framework for data quality that includesthe following aspects: (1) Data must be accessible to dataconsumers. For instance, consumers know how to retrievedata; (2) Consumers must be able to interpret data. Forexample, the data are not represented in a foreign language;(3) Data must be relevant to consumers. For instance,FrameworksTo find out how data quality management in anorganization requires a framework for measurement. From[10], there are many frameworks that can be used tomeasure data quality management. Based on extantliterature/related studies, this study is limited to discussData Management Book of Knowledge (DMBOK), DQMof Loshin, and European Statistical System (ESS)framework. In DMBOK, DQM is the tenth function of tendata management functions. DQM is defined as planning,implementing, and controlling activities that implementquality management techniques to measure, assess,improve, and ensure data compatibility for use. There aresix DQM of DMBOK activities [10] as follows: (1)Defining High Data Quality, (2) Defining a Data Quality59
Advances in Intelligent Systems Research, volume 172Strategy, (3) Defining Scope of Initial Assessment, (4)Conducting Assessment of Preliminary Data Quality, (5)Identifying and Prioritizing Improvement, and (6) Developand Deploy Data Quality Operations. Different fromDMBOK, in Loshin’s DQM, [12] identified eight areas ofdata quality management, namely expectations for dataquality, data quality dimensions, policies, data qualityprotocols/procedures, data governance, data standards,technology and performance management. Each dimensionis composed of a number of indicators. In addition,Loshin’s DQM framework can be used to measure thematurity level of data quality. Within this framework, thereare five maturity levels, namely initial, repeatable, defined,managed and optimized. Last but not least, compared toDMBOK and Loshin’s DQM, ESS consists of three mainareas namely institutional environment, statisticalprocesses and statistical output [13]. From all theframeworks above, each framework has strengths andweaknesses respectively. To facilitate understanding, acomparison of those frameworks is shown in Table 2.Table 2. Comparison of DQM FrameworkFrameworksStrengthsWeaknessesDMBOK1. It has six data quality management activities [11].There is no instrument forassessing/ measuring thematurity level of dataquality management.2. There have been previous studies using DMBOK.3. It is able to be used for a research result mapping of DQM.For example, it was studied by [15]Loshin’sDQM1. It consists of eight data quality management dimensions.2. There is a maturity level assessment/measurementinstrument.Previous researches havenot been carried out instatistical institutions.3. There have been previous studies using Loshin’s DQM.For example, it was studied by [14] and particularly ingovernment institutions, for example, it was studied by[15].4. It is more focused on data processing.ESS1. It consists of three areas and several dimensions.2. There have been previous studies using ESS on statisticalinstitutions. For example is study by [12].There is no instrument forassessing/measuring thematurity level of dataquality management.3. It is more focused on output data (which is presented tothe public).Loshin’s DQM and ESS frameworks were chosen for thisstudy. The reasons for choosing them were as follows.First, Loshin’s DQM framework was used to measure dataquality management from the aspect of the process of data.Second, ESS was chosen to supplement Loshin’s DQMframework particularly in making a recommendation forimproving data quality management focusing on output.METHODSThis study is a quantitative research conductedusing a case study strategy in the BPS-Statistics ofKaur Regency Bengkulu Province. The samplesof this study were 5 people. All of them were theheads of sections in the organization, Head of theIPDS Section, Head of the Social StatisticsSection, Head of Production Statistics Section,Head of Distribution Statistics Section, Head ofRegional Balance Sheet Section and StatisticalAnalysis.In order to respond to the research question,data were obtained from the distribution ofquestionnaires. There were two types ofquestionnaires. The first questionnaire was tomeasure the maturity level of the data qualitymanagement using Loshin’s DQM framework.The questionnaire consisted of eight parts asshown in Table 3.60
Advances in Intelligent Systems Research, volume 172Table 3. Questionnaire 1 (Adopted from [12])No.PartsNumber of questions1Data Quality Expectation162Data Quality Dimension123Information Policies114Data Quality Protocols165Data Governance14678Data Standards15Technology12PerformanceManagementThe scales of answers for this questionnaire was ‘1’ if itwas implemented in the organization and ‘0’ if it was notimplemented in the organization. The second questionnairewas to supplement the first questionnaire in order tomeasure the data quality management from another side13namely institutional environment, statistical process, andstatistical output using the ESS framework. The scale ofanswers for this questionnaire is 1 to 10. For more details,see [13]. This questionnaire consists of 10 dimensions anda number of questions as shown in Table 4.Table 4. Questionnaire 2 (Adopted from StatisticalProcessesStatistical OutputD4D5D6D7D8D9D10Professional independence of statisticalauthoritiesAdequacy of resourcesImpartiality and integritySound methodology and proceduresRelevance and completenessAccuracy, errors, and omissionsTimeliness and punctualityConsistency, coherence, comparabilityLevel of detailNumber of questions3235322334Accessibility and clarityThe method used to process the data was processassessment model. The tool used was Ms. Excel.RESULTSResult Based on Loshin’s DQM frameworkThe results of this study based on DQM’s Loshinframework explained as follows.61
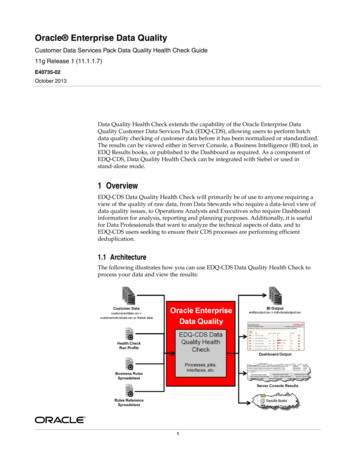
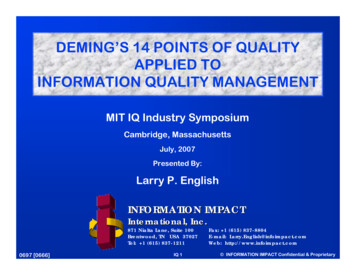
Advances in Intelligent Systems Research, volume 172Data Quality Expectation (DQE)Data Quality Protocols (DQP)DQE consists of 16 characteristics to measure the level ofmaturity from 1 to 5. As shown in Figure 1, 4 out of 16characteristics are needed to be improved. They are (1)DQE1, the impact of a new data error is shown andrecognized long after the event; (2) DQE2, characterizationof areas that have an impact on poor data quality; (3)DQE3, data profiling is used to identify data errors in theprocess; and (4) DQE4, a framework for analyzing impactsis available.DQP consists of 16 characteristics to measure the level ofmaturity from 1 to 5. As shown in Figure 4, 12 out of 16characteristics are needed to be improved. They are (1)DQP1, data errors are corrected without coordination withbusiness processes; (2) DQP2, the root of the problem isnot identified; (3) DQP3, the same mistakes are oftenrepeated; (4) DQP4, the ability to trace errors due toincomplete data; (5) DQP5, the ability to trace errors dueto data structure errors; (6) DQP6, analysis of the root ofthe problem is possible using simple data quality rules andvalidation; (7) DQP9, data validation is done automaticallyand only incorrect data is checked; (8) DQP11, control overdata is done outside of business applications; (9) DQP12,data errors are identified as early as possible; (10) DQP13,data validation can be audited; (11) DQP15, measurementof data quality published by each participant; and (12)DQP16, data quality management is carried outtransparently.200%0%Figure 1. Data Quality Expectation Assessment200%Data Dimension (DD)DD consists of 12 characteristics to measure the level ofmaturity from 1 to 5. As shown in Figure 2, 2 out of 12characteristics are needed to be improved. They are (1)DD1, 1. There is no ability to measure data quality; and (2)DD2, data quality issues are not yet a concern.0%Figure 4. Data Quality Protocols AssessmentData Governance (DG)200%0%Figure 2. Data Dimension Expectation AssessmentDG consists of 14 characteristics to measure the level ofmaturity from 1 to 5. As shown in Figure 5, 3 out of 14characteristics are needed to be improved. They are (1)DG1, communication-related to managing data quality islittle or no; (2) DG2, all data problems are always regardedas IT problems; and (3) DG3, there is no data stewardship.Policy (P)200%Policy consists of 16 characteristics to measure the level ofmaturity from 1 to 5. As shown in Figure 3, 7 out of 16characteristics are needed to be improved. They are (1) P1,policies are informal; (2) P2, policy not documented; (3)P3, corrective actions are taken by each staff withoutcoordination; (4) P4, the organization tries to consolidatedata in one source; (5) P5, a basic policy on the mechanism,if there are data problems have been established; (6) P9,data quality SLAs are used to see compliance with policies;and (7) P11, systems with self-management have beenused.200%0%P1P3P5P7Figure 3. Policy AssessmentP9 P11 P13 P150%Figure 5. Data Governance AssessmentData Standards (DS)DS consists of 15 characteristics to measure the level ofmaturity from 1 to 5. As shown in Figure 6, 10 out of 15characteristics are needed to be improved. They are (1)DS1, there is no standardization of data; (2) DS2, similardata are displayed differently; (3) DS3, there is no datadefinition; (4) DS4, general data definition uses businessterminology; (5) DS6, standard metadata is managedthroughout the organization; (6) DS9, data exchangescheme has been established; (7) DS11, data exchangestandards are managed through a standard data monitoringprocess; (8) DS12, already using certification of trusteddata; (9) DS13, master data management has been trulyimplemented to manage master data; and (10) DS14, thedata standardization process is done automatically throughstraight-through processing.62
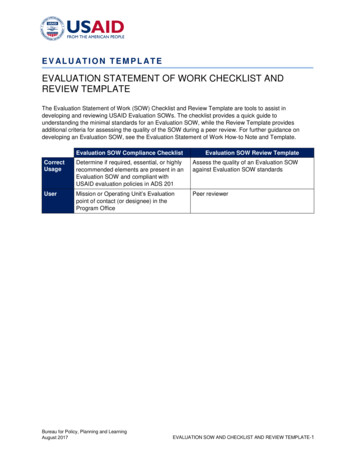
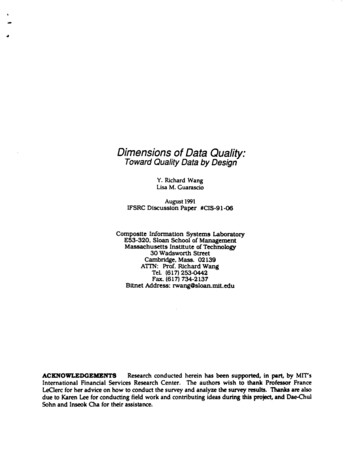
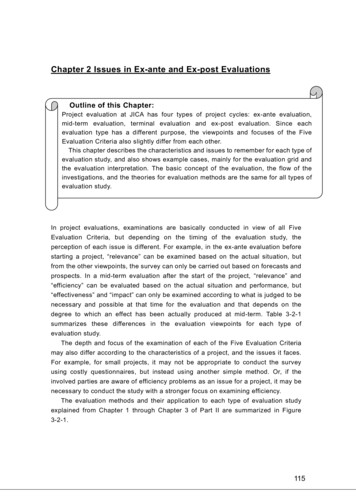
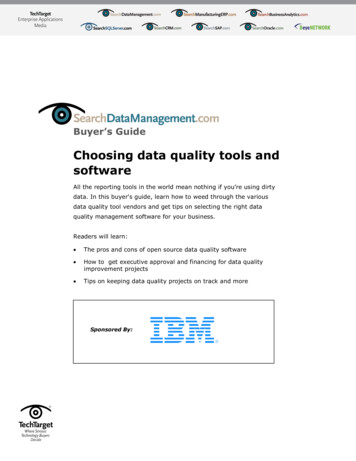
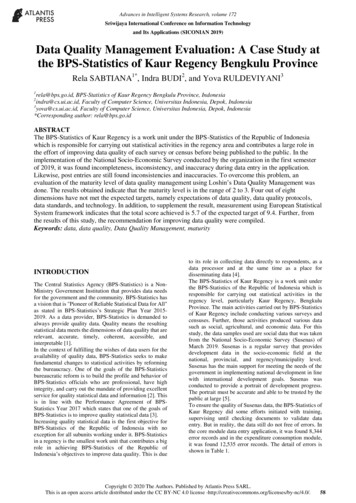
Advances in Intelligent Systems Research, volume 172Performance Management (PM)200%PM consists of 13 characteristics to measure the level ofmaturity from 1 to 5. As shown in Figure 8, 3 out of 13characteristics are needed to be improved. They are (1)PM1, the impact of a new data error is shown andrecognized long after the event; (2) PM2, characterizationof areas that have an impact on poor data quality; and (3)PM13, overall organization performance can be improvedthrough modification of data quality policies.DS1 DS3 DS5 DS7 DS9 DS11 DS13 DS15Figure 6. Data Standards AssessmentTechnology (T)Technology consists of 12 characteristics to measure thelevel of maturity from 1 to 5. As shown in Figure 7, 4 outof 12 questions are needed to be improved. They are (1) T1,jobs ad-hoc jobs are routinely carried out; (2) T2, mentalityavoids problems by saying the application was notdeveloped there; and (3) T12, non-technical users candefine and modify data quality rules and data 5PM6PM7PM8PM9PM10PM11PM12PM130%Figure 8. Performance Management AssessmentData Quality Maturity Level Based onLoshin’s DQM FrameworkT1T2T3T4T5T6T7T8T9T10T11T120%In this study, the level of data quality maturity wasmeasured using Loshin’s DQM framework. Within thisframework, the results of maturity levels from eightdimensions is shown in Table 5.Figure 7. Technology AssessmentTable 5. Maturity LevelsDimensionsData Quality ExpectationData Quality DimensionInformation PoliciesData Quality ProtocolsData GovernanceData StandardsTechnologyPerformance ManagementThe gap in the maturity level of the quality of datamanagement in the BPS-Statistics of Kaur Regency isshown in Figure 9.Data Quality DimensionData Quality ProtocolsData StandardsPerformance Management0ExpectedFigure 9. Maturity Levels Gap1Current2CurrentExpected2332322333333333Figure 9. informs that from the eight dimensions of dataquality management, there are found maturity level gaps infour dimensions, namely data quality expectations, dataquality protocols, data standards, and technology. The fourdimensions reach maturity level 2 (repeatable). The otherfour dimensions have met the expected maturity level atlevel 3 (defined), namely data quality dimensions,information policy, governance, and performancemanagement. To meet the expected maturity level targets,efforts need to be made to increase the quality of data oncharacteristics that are still not fulfilled.3Result Based on ESS Framework.All current scores have not met the expected scores. Thesmallest score obtained is the adequacy of resourcesdimension and the biggest score obtained is impartialityand integrity dimension. The scores obtained for eachdimension are shown in Figure 10.63
Advances in Intelligent Systems Research, volume 172Figure 10. Current and Expected ScoresMeanAdequacy of Recommendations for Improving Data QualityBased on Loshin’s DQM Framework.Sound methodology Accuracy, errors, The recommendations for improving the quality of datawas based on the gap results of current and expectedmaturity levels. The details are shown in Table 6.Consistency, Accessibility and 0,0Expectation5,010,0CurrentTable 6. RecommendationsDimensionsDQEDQPDSTRecommendations Dimensions of data quality have been partially identified in large-scale surveys such as Susenasbut have not been documented. Therefore, the dimensions of the quality of survey data shouldbe accommodated in all technical sections and provided a form for the required dimensions ofdata quality documentation. Expectations regarding the dimensions of respondent data quality related to data values, formatsand descriptions have been conveyed with data quality rules but are still limited. Therefore, it isbest to hope that the data dimensions are conveyed according to the overall data quality rules inSusenas and other surveys. The ability of data validation based on survey guidelines according to BPS-Statistics dataquality rules already exists for Susenas but the validation rules in each semester often changedue to changes in the questionnaire. In addition, data validation training is often not optimal.Therefore, the validation training should be optimal in accordance with established data qualityrules, training in data validation ability should be increased. Automatic validation already exists with Susenas which is the responsibility of the SocialStatistics Section but not yet in the Regional Balance Sheet and Statistical Analysis Section. Inthe Production Statistics Section, there is no automatic validation for routine surveys.Therefore, automatic validation should be available in all technical sections and includes allsurveys. Data validation also checks thoroughly, not only the wrong data. Data standards and metadata management do not yet exist. Therefore, data standards andmetadata management should be accommodated in the IPDS Section. Standard data structures and formats have not been assigned to all data, only part of it.Therefore, data structure and format standards should be set for all survey data managed in theorganization. Data exchange between the IPDS Section and other technical sections already exists. Thecurrent condition is that the data exchange scheme does not yet exist so that the data exchangeis done informally between sections that need data from one to another. Therefore, it is better toformulate a data exchange scheme between the IPDS Section and other technical sections thatare formal and binding. Specific applications for checking and improving data quality are not yet available except dataentry applications. The standard procedure for using the application is already in the dataprocessing manual. But for some web-based applications, there is no written standardprocedure. Therefore, there should be a written standard procedure for using data entryapplications both in the IPDS Section and other sections for improving data quality. In the implementation of validation, there are still some rules that are not appropriate and needto be updated in the application. Thus, validation should be made based on the rules of thetechnical section which conducting the survey and reporting it to the BPS-Statistics for updates. The technology component for data validation is already available in the form of a data entryapplication but data quality checking and reporting are not yet available. Thus, the data entryapplication should accommodate not only the validation results that can be reported but also thequality of the data.64
Advances in Intelligent Systems Research, volume 172Recommendations for Improving Data Quality Based on ESS frameworkTo complement the recommendations given based onLoshin’s DQM framework, recommendations forimproving the quality of Susenas data from the ESSframework are shown in Table 7. The recommendationscomprise institutional environment, statistical processes,and statistical output areas. The recommendations werebased on the result score obtained and observation in theorganization.Table 7. icalProcessesStatisticalOutputRecommendations The current number of organic staff at the BPS-Statistics in Kaur Regency is still limitedparticularly in IPDS and Social Statistics Section. Based on the conditions, the addition ofemployees should be held in a balanced and ideal manner according to the mapping ofemployees who are supposed to achieve organizational goals. Training for employees has so far focused on technical implementation in the field and dataentry. Susenas data analytical skills training has not been given full attention to the regencylevel. Thus, skills training should be carried out up to the regency level continuously givenbecause there are always changes in concepts and definitions in each semester, uncertainemployee mutations and employee mapping that does not match employee’s competency. During this time, a survey of user satisfaction data has been carried out on the overall data in general,not specifically for Susenas. Therefore, it is better to conduct a user satisfaction survey specificallyfor Susenas to find out the level of data user satisfaction with Susenas and future improvements. Susenas data dissemination is still conventional, especially microdata or data customization neededby users. If there are data users who need Susenas data, they can visit the library for datadissemination services. For ease of access, Susenas data should be displayed through moderncommunication technologies such as on the website or in the official mobile application of theorganization if possible/available. Susenas data is not yet available dynamically on the organization's website. Therefore, the dynamictable should be presented in stages. And data should also be available on a complete office websitefrom year to year making it easier for data users to access data. Some strategic indicators produced from Susenas have been displayed on the organization's websitebut are still limited. Considering this, it is better to add the data not only to upload organizationaldata but also to other regency/municipality data in Bengkulu Province so that data users can comparewith other regencies/municipalities easily. Also, it is better for the data displayed on the website tobe presented in the English version so that it can reach wider data users to foreign countries. Publication of Susenas in the form of published books is still limited and has not been donecontinuously from year to year for example consumption and expenditure publications. Therefore,it is better to do a continuous publication and the time lag between the reference date and thepublication date is not too far away to keep the data up to date.CONCLUSIONThe results showed that the maturity level of the BPSStatistics of Kaur Regency reached level 2 to 3 in eachdimension of data quality management. Four dimensionsobtained meet the expected level of data quality maturity atlevel 3, namely the dimensions of data quality, informationpolicy, data governance, and performance management.The other four dimensions do not meet the expected levelof maturity of data quality, namely data qualityexpectations, data quality protocols, data standards, andtechnology. While the total average current data qualityscore based on the ESS framework achieved by the BPSStatistics of Kaur Regency is 5.7 out of the total expectedaverage score of 9.4. To meet the expected data qualitytargets, the BPS-Statistics of Kaur Regency needs to makeefforts to improve data quality by implementing therecommendations given from the results of this study in thefuture. Next, for future research, there are threesuggestions. First, data that were used as a sample in thisstudy were only from one survey that was currentlyrunning. It would be better for further research can entermore survey data or census. Second, respondents in thisstudy consisted of five section heads, further research couldinclude all organic staffs in the organization. Third, thisstudy is not only eligible for a statistical agency but alsocan be implemented in other public sectors/organizations.65
Advances in Intelligent Systems Research, volume 172ACKNOWLEDGMENTThe authors acknowledge the PIT 9 researchgrant NKB-0010/UN2.R3.1/HKP.05.00/2019from Directorate Research and CommunityServices, Universitas Indonesia.REFERENCES[1] Statistics Indonesia, Strategic Plan of StatisticsIndonesia Year 2015-2019, Jakarta, 2015.[2] Statistics Indonesia, Bureaucracy Reform RoadMap of Statistics Indonesia, Jakarta, 2011.Kerangka kerja as a Basis for Capacity Building andPolicy Making in the ASEAN, London, Mac MillandPublisher, 2016.[14] R. Silvola et.al, Data quality Assessment andImprovement, International Journal of BusinessInformation Systems, Vol. 22, No. 1, pp. 62-81 (2016)[15] S.B. Wibisono, A.N. Hidayanto, W.S. Nugroho,Data Quality Management Maturity Measurement ofGovernment-Owned Property Transaction in BMKGCommIT (Communication & InformationTechnology), Journal 12
data quality management, namely expectations for data quality, data quality dimensions, policies, data quality protocols/procedures, data governance, data standards, technology and performance management. Each dimension is composed of a number of indicators. In addition, Loshin's DQM framework can be used to measure the maturity level of data .