Transcription
Automating Large-Scale Data Quality VerificationSebastian Schelter, Dustin Lange, Philipp Schmidt, Meltem Celikel, Felix BiessmannAmazon amazon.com Andreas GrafbergerUniversity of ABSTRACTModern companies and institutions rely on data to guideevery single business process and decision. Missing or incorrect information seriously compromises any decision processdownstream. Therefore, a crucial, but tedious task for everyone involved in data processing is to verify the quality oftheir data. We present a system for automating the verification of data quality at scale, which meets the requirementsof production use cases. Our system provides a declarativeAPI, which combines common quality constraints with userdefined validation code, and thereby enables ‘unit tests’ fordata. We efficiently execute the resulting constraint validation workload by translating it to aggregation queries onApache Spark. Our platform supports the incremental validation of data quality on growing datasets, and leveragesmachine learning, e.g., for enhancing constraint suggestions,for estimating the ‘predictability’ of a column, and for detecting anomalies in historic data quality time series. Wediscuss our design decisions, describe the resulting systemarchitecture, and present an experimental evaluation on various datasets.PVLDB Reference Format:Sebastian Schelter, Dustin Lange, Philipp Schmidt, Meltem Celikel, Felix Biessmann and Andreas Grafberger. Automating LargeScale Data Quality Verification. PVLDB, 11 (12): 1781-1794,2018.DOI: TIONData is at the center of modern enterprises and institutions. Online retailers, for example, rely on data to supportcustomers making buying decisions, to forecast demand [7],to schedule deliveries, and more generally, to guide everysingle business process and decision. Missing or incorrect information seriously compromises any decision process downstream, ultimately damaging the overall effectiveness and efficiency of the organization. The quality of data has effects work done while at Amazon ResearchThis work is licensed under the Creative Commons AttributionNonCommercial-NoDerivatives 4.0 International License. To view a copyof this license, visit http://creativecommons.org/licenses/by-nc-nd/4.0/. Forany use beyond those covered by this license, obtain permission by emailinginfo@vldb.org.Proceedings of the VLDB Endowment, Vol. 11, No. 12Copyright 2018 VLDB Endowment 2150-8097/18/8.DOI: https://doi.org/10.14778/3229863.3229867across teams and organizational boundaries, especially inlarge organizations with complex systems that result in complex data dependencies. Furthermore, there is a trend acrossdifferent industries towards more automation of businessprocesses with machine learning (ML) techniques. Thesetechniques are often highly sensitive on input data, as thedeployed models rely on strong assumptions about the shapeof their inputs [42], and subtle errors introduced by changesin data can be very hard to detect [34]. At the same time,there is ample evidence that the volume of data available fortraining is often a decisive factor for a model’s performance[17, 44]. In modern information infrastructures, data lives inmany different places (e.g., in relational databases, in ‘datalakes’ on distributed file systems, behind REST APIs, or isconstantly being scraped from web resources), and comesin many different formats. Many such data sources do notsupport integrity contraints and data quality checks, and often there is not even an accompanying schema available, asthe data is consumed in a ‘schema-on-read’ manner, where aparticular application takes care of the interpretation. Additionally, there is a growing demand for applications consuming semi-structured data such as text, videos and images.Due to these circumstances, every team and system involved in data processing has to take care of data validationin some way, which often results in tedious and repetitivework. As a concrete example, imagine an on-demand videoplatform, where the machines that stream videos to userswrite log files about the platform usage. These log files mustregularly be ingested into a central data store to make thedata available for further analysis, e.g., as training data forrecommender systems. Analogous to all data produced inreal-world scenarios, these log files might have data qualityissues, e.g., due to bugs in program code or changes in thesemantics of attributes. Such issues potentially result in failures of the ingestion process. Even if the ingestion processstill works, the errors in the data might cause unexpectederrors in downstream systems that consume the data. Asa consequence, the team managing the daily ingestion process must validate the data quality of the log files, e.g., bychecking for missing values, duplicate records, or anomaliesin size.We therefore postulate that there is a pressing need forincreased automation of data validation. We present a system that we built for this task and that meets the demandsof production use cases. The system is built on the following principles: at the heart of our system is declarativity; wewant users to spend time on thinking ‘how’ their data shouldlook like, and not have to worry too much about how to im-1781
plement the actual quality checks. Therefore, our systemoffers a declarative API that allows users to define checkson their data by composing a huge variety of available constraints. Additionally, data validation tools should providehigh flexibility to their users. The users should be able toleverage external data and custom code for validation (e.g.,call a REST service for some data and write a complex function that compares the result to some statistic computed onthe data). Our vision is that users should be able to write‘unit-tests’ for data (Section 3.1), analogous to establishedtesting practices in software engineering. Furthermore, datavalidation systems have to acknowledge the fact that data isbeing continuously produced, therefore they should allow forthe integration of growing datasets. Our proposed systemexplicitly supports the incremental computation of qualitymetrics on growing datasets (Section 3.2), and allows itsusers to run anomaly detection algorithms on the resultinghistorical time series of quality metrics (Section 3.4). Thelast principle to address is scalability: data validation systems should seamlessly scale to large datasets. To addressthis requirement, we designed our system to translate therequired data metrics computations to aggregation queries,which can be efficiently executed at scale with a distributeddataflow engine such as Apache Spark [50].The contributions of this paper are the following: We present a declarative API combining common quality constraints with user-defined validation code, whichenables ‘unit tests’ for data (Section 3.1). We discuss how to efficiently execute the constraint validation by translating checks to aggregation queries withdedicated support for incremental computation on growing datasets (Sections 3.2 and 4). We give examples of how machine learning can be leveraged in data quality verification, e.g., for enhancing constraint suggestions, for estimating the predictability ofa column, and for detecting anomalies in historic dataquality timeseries (Sections 3.3 and 3.4). We present an experimental evaluation of our proposedapproaches (Section 5).2.DATA QUALITY DIMENSIONSWe first take a look at data quality literature to understand common dimensions of quality. The quality of datacan refer to the extension of the data (i.e., data values), or tothe intension of the data (i.e., the schema) [4]. We focus onextensional data quality in the following. We treat schemaproblems with the concept of completeness; for example, ifthere is no attribute value specified in the open schema ofan entity, we consider it missing. There are multiple studieson measuring the extensional data quality [4, 30, 39]. In thefollowing, we briefly describe the most commonly referredto dimensions.Completeness refers to the degree to which an entity includes data required to describe a real-world object. Intables in relational database systems, completeness can bemeasured by the presence of null values, which is usually interpreted as a missing value. In other contexts, for instancein a product catalog, it is important to calculate completeness given the correct context, i.e., the schema of the product category. For example, the absence of a value for theattribute shoe size is not relevant for products in the category notebooks. In this case, the attribute value is missingbecause the attribute is not applicable [37]. We are onlyinterested in measuring completeness when an attribute isapplicable.Consistency is defined as the degree to which a set of semantic rules are violated. Intra-relation constraints definea range of admissible values, such as a specific data type,an interval for a numerical column, or a set of values for acategorical column. They can also involve rules over multiple columns, e.g., ‘if category is t-shirts, then the rangeof size is {S, M, L}’. Inter-relation constraints may involve columns from multiple tables. For example, a columncustomerId may only include values from a given referencetable of all customers.Accuracy is the correctness of the data and can be measured in two dimensions: syntactic and semantic. Syntacticaccuracy compares the representation of a value with a corresponding definition domain, whereas semantic accuracycompares a value with its real-world representation. For example, for a product attribute color, a value blue can beconsidered syntactically accurate in the given domain even ifthe correct value would be red, whereas a value XL would beconsidered neither semantically nor syntactically accurate.3.APPROACHWe introduce our general machinery for automated largescale data quality verification. We first present our declarative API, which allows users to specify constraints on theirdatasets, and detail how we translate these constraints intocomputations of metrics on the data, which allow us to subsequently evaluate the constraints (Section 3.1). Next, wediscuss how to extend this approach to scenarios where weneed to evaluate such constraints for incrementally growingdatasets (e.g., in the case of ingestion pipelines in a datawarehouse) in Section 3.2. Lastly, we describe extensionsof our approach such as the suggestion of constraints (Section 3.3) and anomaly detection on historical data qualitytime series of a dataset (Section 3.4).3.1‘Unit Tests’ for DataThe general idea behind our system is to enable usersto easily define ‘unit tests’ for their datasets in a declarative manner [10]. These ‘unit-tests’ consist of constraints onthe data which can be combined with user-defined functions,e.g., custom code. Table 1 shows the constraints available toour users. We want them to focus on the definition of theirchecks and their validation code, but not on the computationof the metrics required for the constraints. Therefore, we design our system to translate the user-defined constraints intoan efficiently executable metrics computation.Declarative definition of data quality constraints. Inour system, users define checks for their datasets, which either result in errors or warnings during execution, if thevalidation fails. This approach provides a high flexibility forusers: they can write complex functions and leverage existing libraries for their validation code; they can use externaldata or even can call external services. In order to showcase our system, we introduce an exemplary use case on anon-demand video platform. Assume that the machines thatstream videos to users write log files about the platform usage, with details such as the type of device used, the lengthof the session, the customer id or the location.1782
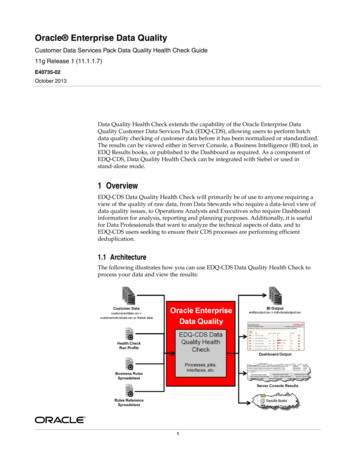
Table 1: Constraints available for composing user-defined data quality checks.constraintargumentssemanticdimension completenessisCompletehasCompletenesscolumncolumn, udfcheck that there are no missing values in a columncustom validation of the fraction of missing values in a columndimension sfiessatisfiesIfhasPredictabilitycolumncolumn, udfcolumn, udfcolumn, value rangecolumncolumncolumn pairpredicatepredicate paircolumn, column(s), udfcheck that there are no duplicates in a columncustom validation of the unique value ratio in a columncustom validation of the unique row ratio in a columnvalidation of the fraction of values that are in a valid rangevalidation of the largest fraction of values that have the same typevalidation whether all values in a numeric column are non-negativevalidation whether values in the 1s column are always less than in the 2nd columnvalidation whether all rows match predicatevalidation whether all rows matching 1st predicate also match 2nd predicateuser-defined validation of the predictability of a columnstatistics (can be used to verify dimension mn, tDistinct column, udfcustomhasMincolumn, udfcustomhasMaxcolumn, udfcustomhasMeancolumn, udfcustomhasStandardDeviationcolumn, udfcustomhasApproxQuantilecolumn, quantile, udfcustomhasEntropycolumn, udfcustomhasMutualInformationcolumn pair, udfcustomhasHistogramValuescolumn, udfcustomhasCorrelationcolumn pair, udfcustomtimehasNoAnomalies12metric, lidationvalidationvalidationvalidationval numTitles c al l Re st Se r vi ce (.)val m a x E x p e c t e d P h o n e R a t i o computeRatio (.)var checks Array ()567891011121314checks Check ( Level . Error ). isComplete ( " customerId " , " title " ," im pr e ss io nS t ar t " , " impressionEnd " ," deviceType " , " priority " ). isUnique ( " customerId " , " c o u n t r y R e s i d e n c e " ," deviceType " , " title " ). h a s C o u n t D i s t i n c t ( " title " , numTitles ). h a s H i s t o g r a m V a l u e s ( " deviceType " ,. ratio ( " phone " ) m a x E x p e c t e d P h o n e R a t i o )1516171819checks Check ( Level . Error ). isNonNegative ( " count " ). isLessThan ( " i mp r es si on S ta rt " , " impressionEnd " ). isInRange ( " priority " , ( " hi " , " lo " ))2021222324checks Check ( Level . Warning , on " delta " ). has NoAnoma lies ( Size , OnlineNormal ( stdDevs 3))checks Check ( Level . Error , on " delta " ). has NoAnoma lies ( Size , OnlineNormal ( stdDevs 4))25262728checks Check ( Level . Warning ). hasPredictability (" countryResidence ",( " zipCode " , " cityResidence " ) , precision 0.99)2930the number of recordsthe maximum fraction of values of the same data typethe number of distinct non-null values in a columnthe approx. number of distinct non-null valuesa column’s minimum valuea column’s maximum valuea column’s mean valuea column’s standard deviationa particular quantile of a column (approx.)a column’s entropya column pair’s mutual informationcolumn histograma column pair’s correlationvalidation of anomalies in time series of metric values34ofofofofofofofofofofofofofVerification . run ( data , checks )Listing 1: Example for declarative data quality constraint definitions using our API.These log files must regularly be ingested into a centraldata store to make the data available for further analysis,e.g., as training data for recommender systems. Analogousto all data produced in real-world scenarios, these log filesmight have data quality issues, e.g., due to bugs in program code, data loss, redeployments of services, or changesin semantics of data columns. Such issues might potentiallyresult in several negative consequences, e.g., the ingestionprocess might fail and need to be manually restarted after communication with the data provider. Even if theingestion process still works, the errors in the data mightcause unexpected errors in downstream systems that consume the data. In many cases these errors might be hardto detect, e.g., they might cause regressions in the prediction quality of a machine learning model, which makes assumptions about the shape of particular features computedfrom the input data [34]. Therefore, the video streamingservice could use our system to validate the data qualitybefore starting the data ingestion process, by declaring acustom set of checks that should hold on the data. Listing 1 depicts a toy example of how such a declarative quality check for video stream logs could look like and highlights the combination of declarative constraint definitionswith custom code. External data is fetched in the beginning and used throughout the quality check: an externalREST service is called to determine the overall number ofmovies in the system and the expected ratio of smartphonewatchers is computed (see lines 1 & 2). Then, a set ofcompleteness and consistency checks is defined, e.g., we require the columns customerId, title, impressionStart,1783
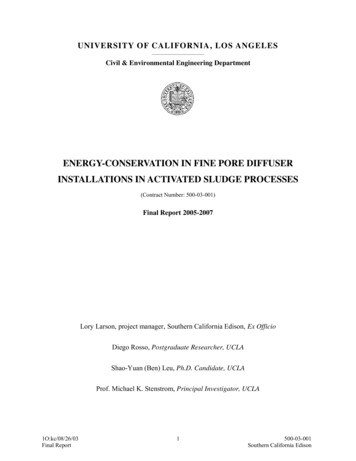
Table 2: Computable metrics to base constraints on.metricdimension completenessCompletenessdimension ueRangeDataTypePredictabilitysemanticfraction of non-missing valuesin a columnnumber of recordsratio of columns matching predicateunique value ratio in a columnunique row ratio in a columnvalue range verification for a columndata type inference for a columnpredictability of values in a columnstatistics (can be used to verify dimension consistency)Minimumminimal value in a columnMaximummaximal value in a columnMeanmean value in a columnStandardDeviationstandard deviation of thevalue distribution in a columnCountDistinctnumber of distinct values in a columnApproxCountDistinctnumber of distinct values in a columnestimated by a hyperloglog sketch [21]ApproxQuantileapproximate quantile of the valuein a column [15]Correlationcorrelation between two columnsEntropyentropy of the value distributionin a columnHistogramhistogram of an optionallybinned columnMutualInformationmutual information betweentwo columnsimpressionEnd, deviceType and priority to be complete(lines 7 to 9), and we dictate that the column combinationcustomerId, countryResidence, deviceType, and title isunique in the data at hand (lines 10 and 11). We make surethat the number of distinct values in the title column isless than or equal to the overall number of movies in thesystem (line 12) and we check that the ratio of ‘phone’ devices meets our expectations by investigating a histogramof the deviceType column in lines 13 and 14. Subsequently,we issue another set of consistency checks that define theexpected shape of the data (e.g., no negative values in thecount column, a happens-before relationship between theviewing timestamps, and a set of valid values for the prioritycolumn, lines 16 to 19).Next, we have two checks that rely on comparisons to previously computed metrics on former versions of the dataset(available from a central ‘metrics database’): we advise thesystem to detect anomalies in the time series of sizes ofrecords that have been added to the dataset over time andissue a warning if the is size more than three standard deviations away from the previous mean and throw an error if it is more than four standard deviations away (seelines 21 to 24). Finally, we define a predictability check forthe countryResidence column which dictates that our system should be able to predict values in this column with aprecision of 99% by inspecting the corresponding values inthe zipCode and cityResidence columns.Translating constraints to metrics computations. Inthe following, we detail how our system executes the actual data quality verification. The declarative definitionof constraints (which are evaluated by the user code) re-lies on a particular set of data quality metrics that oursystem computes from the data at hand. The system inspects the checks and their constraints, and collects themetrics required to evaluate the checks. Table 2 lists alldata quality metrics supported by our system. We directlyaddress the data quality dimensions completeness and consistency listed in Section 2. Let D denote the dataset Dwith N records, on which we operate, and let cv denotethe cardinality of value the v in a particular column ofdataset D. Furthermore, let V denote the set of uniquevalues in a particular column of the dataset D. We calculate Completeness as the fraction of non-missing values ina column: {d D d(col) 6 null} / N . For measuringconsistency, we provide metrics on the number of uniquevalues, the data types, the data set size, the value ranges,and a general predicate matching metric. The Size metricfor example refers to the number of records N , while theCompliance metric denotes the ratio of records which satisfy a particular predicate: {d D p(d)} / N . The metricUniqueness refers to the unique value ratio [19] in a particular column: {v V cv 1} / V , while Distinctnesscorresponds to the unique row ratio V / N in the column.In addition, we implement standard summary statistics fornumerical columns that can be used for defining additionalsemantic rules on datasets, such as Minimum, Maximum, Mean,StandardDeviation, Histogram,and Entropy, which we forPexample compute as v cNv log cNv . We also include standard statistics such as Correlation and MutualInformationfor measuring the amount of associationbetween two columns,P Pccv1 v2log cvv1cvv2 .where the latter is computed as:v1v2N12As some metrics are rather expensive to compute and mightinvolve re-partitioning or sorting the data, our system provides approximations of metrics such as quantiles in the formof ApproxQuantile (computed via an efficient online algorithm [15]) or ApproxCountDistinct for estimating the number of distinct values with a hyperloglog sketch [21].Lastly, we offer an implementation of Predictability. Inan attempt to automate the verification of the correctnessof values, we train a machine learning model that predictsa value for a target column t of a particular record fromall k observed values l1 , . . . , lk Vt in the target column,given the corresponding values li1 , . . . , lin of input columnsi1 , . . . , in for the particular record, e.g., using the maximuma posteriori decision rule: argmaxk p(lk li1 , . . . , lin ). An example would be to predict the value of a ‘color’ column ina product table from text in the ‘description’ and ‘name’columns. We train this model on a sample of observed values in the target column, and measure its prediction qualityon the held-out rest of the data. We return the quality score,calculated using standard measures such as precision, recallor F1 -score of the predictions, as value of the metric.After having inspected the checks and collected the metrics, the system triggers the efficient computation of themetrics (see Section 4 for details on how we physically execute these computations), invokes the user-defined validation code from the constraints, and evaluates the results.Output. After execution of the data quality verification,our system reports which constraints succeeded and whichfailed, including information on the predicate applied to themetric into which the constraint was translated, and thevalue that made a constraint fail.1784
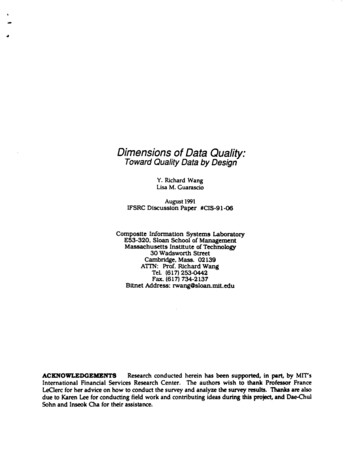
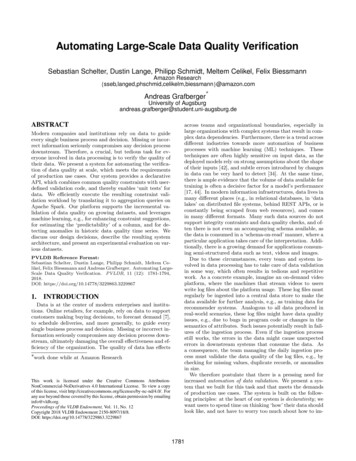
.Success ( " isComplete ( title ) " ,Completeness ( " title " ) 1.0)) ,Success ( " isNonNegative ( count ) " ,Compliance ( " count 0 " ) 1.0)) ,Failure ( " isUnique ( customerId , countryResidence ,deviceType , title ) " ,Uniqueness ( " customerId " , " c o u n t r y R e s i d e n c e " ," deviceType " , " title " ) 1.0 , 0.9967) ,Failure ( " isInRange ( priority , ( ‘ hi ’, ‘ lo ’)) " ,Compliance ( " priority IN ( ‘ hi ’, ‘ lo ’) " ) 1.0 ,0.833) ,.Note that we restrict ourselves to append-only cases wherea datasetSat time t is simply the union of all previous deltas:D(t) tk 1 D(k) . Instead of computing metrics for thegrowing dataset from all snapshots, incremental computation introduces a state S, a function f for updating thestate from a delta and the previous state, and a function gfor computing the actual metric from the state S such thatm(t) g(S (t) ). Furthermore, we need an initial ‘empty’state S (0) . The benefit of incremental computation is thatit allows us to compute the series of metrics for the datasetsnapshots via a recursive computation that only consumesthe deltas:Listing 2: Exemplary output of data quality verification showing metrics, applied predicates and results.S (t) f ( D(t) , S (t 1) )Listing 2 shows an excerpt of a potential output for ourexample. We see that our isComplete(title) constrainthas been translated to a predicate Completeness(title) 1.0 which held on the data. Analogously, our constraintisNonNegative(count) leads to the predicate Compliance("count 0") 1.0 and also matched all records. Onthe contrary, our unique constraint has failed, as only 99.67%of records have been identified as unique, and the predicatewhich the system generated from the isInRange constraintonly matched 83.3% of records.3.2Incremental Computation of Metrics forGrowing DatasetsIn real-world deployments, data is seldomly static; insteadwe typically encounter systems that continuously producedata (e.g., by interacting with users). Therefore it is ofutter importance for data validation systems like ours tosupport scenarios where we continously ingest new batchesof records for a particular dataset. In such cases, we needaccess to updated metrics for the whole dataset as well asfor the new records and we must be able to update suchmetrics incrementally without having to access the previousdata (see Figure 1 for details). In the following, we presentour incremental metrics computation machinery built forthis task.D(3)D(2) D(3)D(1) D(2) D(2)S(0)S(1)S(2) D(1) D(1) D(1) D(1) D(2) D(3)metric at t 1metric at t 2metric at t 1metric at t 2metric at t 3metric at t 3batch metricscomputationincremental metricscomputationFigure 1: Instead of repeatedly running the batchcomputation on growing input data D, we supportrunning an incremental computation that only needsto consume the latest dataset delta D(t) and astate S of the computation.Computational model. Let D(t) denote the snapshotof dataset at time t and let D(t) denote the delta dataat time t (the additional records) required to form D(t 1) .Reformulation of quality metrics. In the following, wepresent a set of reformulations of the existing metrics to enable incremental computation for them. For each metric, weshow how to ‘split’ the computation of the metrics for thenew dataset D(t 1) into the computation of sufficient statistics over the previous dataset D and the dataset delta D(we drop the indexes here to improve readability). Oncesuch a reformulation is given, we can conduct the computation for D(t 1) by loading the persisted sufficient statisticsfor D and updating these from values computed only on thenewly added records D.Notation: Let N and N denote the number of recordsin the datasets D and D. Let V and V denote all uniquevalues in a particular column of the dataset D or D. Theset of unique values in the new dataset V (t 1) is simply theunion V V of the sets of unique values from the previousdataset and the delta dataset. Furthermore, let cv and cvdenote the cardinality of value v in a particular column ofdataset D or D.The number of records Size is the most straightforwardmetric to rewrite, as the size of the new dataset D(t 1)is simply the sum N N of the size N of the previousdataset D plus the size N of the delta dataset D. Foran incremental version of Compliance, we need to maintain two intermediate results, namely the absolute numberof records {d D p(d)} that previously matched thepredicate as well as the size N of the previous dataset D.Then we can compute the compliance for the new datasetD(t 1) from these retained values and the number of records {d D p(d)} that matched the predicate in the deltaas well as the size N of the delta: {d D p(d)} {d D p(d)} N NWe can reformulate Completeness as compliance with an‘is not null’ predicate. The incremental computation ofUniqueness requires us to know the cardinalities cv of thevalue v in the previous dataset D as well as the set of distinctvalues V . We need to inspect the sum of the cardinalitiescv cv for each value v in the previous dataset and thedelta: {v V V cv cv 1} V V We also compute incremental Distinctness along theselines by comparing the number of distinct values in the data V V to the size of the data N N : V V N N1785
Incremental computation of Entropy requires us to estimate the probability p(v) of a particular value v occurringin the column from the value’s cardinality cv in the previousdata, its cardinality cv in the delta and the sizes N and N of the previous dataset and the delta: X cv cvcv cvlogN NN NvThe incremental computation of MutualInformation requires us to maintain histograms about the cardinalities cv1of the first column, cv2 of the second column, as well ascooccurrence counts cv1 v2 for all pairwise occurrences, andmerge these with the corresponding counts cv1 v2 for thedelta dataset:X X cv v cv vcv1 v2 cv1 v21 21 2logN N(cv1 cv1 ) (cv2 cv2 )vv12In order to compute our Predictability metric, we evaluate the prediction quality of a multinomial naive bayesmodel (trained on features extracted from the user-specifiedinput columns) for the target column. The parameters aretypically estimated using a smoothedmaxiP version of theimum likelihood estimate: argmaxk i fi log NNkik α. Here, αNki denotes the number of times feature i occurs in class k,Nk stands for th
We rst take a look at data quality literature to under-stand common dimensions of quality. The quality of data can refer to the extension of the data (i.e., data values), or to the intension of the data (i.e., the schema) [4]. We focus on extensional data quality in the following. We treat schema problems with the concept of completeness; for .