Transcription
RadiationHandbookfor ElectronicsA compendium of blog posts on op amp design topicsby Bruce TrumpA compendium of radiation effects topics for space,industrial and terrestrial applicationswww.ti.com/radbook
CONTENTSForeword: Texas Instrumentsspace flight historyChapter 6: Mitigating radiation effects in electronics6.1 Radiation robustness by serendipity756.2 Radiation hardening by process776.3 Radiation hardness by design –component configuration solutions79166.4 Radiation hardness by design –component layout solutions822.1 Radiation basics256.5 Radiation hardness by design –circuit redundancy solutions832.2 Particle interactions in matter282.3 Linear energy transfer347.1 Total ionizing dose testing882.4 Radiation shielding357.2 Single-event effect testing95Chapter 1: Radiation environments1.1 The space radiation environment41.2 The terrestrial radiation environment91.3 Artificial radiation environmentsChapter 2: Radiation effects in matterChapter 7: Radiation testing and qualificationChapter 3: Radiation effects in electronics –dose effects7.3 Displacement damage dose testing –neutron testing1013.1 Total ionizing does effects387.4 Dose-rate or prompt-dose testing1013.2 Displacement damage427.5 Terrestrial neutron andalpha-particle testing1027.6 Texas Instruments’ radiationtest philosophy102Chapter 4: Radiation effects in electronics –single-event effects4.1 Destructive and nondestructivesingle-event effects474.2 Archetype for all single-event effects:single-event transientsChapter 8: Texas Instruments’ spaceproduct advantage478.1 Product and process changes1084.3 Digital and analog single-event transients 498.2 Lot-to-lot variation1084.4 Single-event upsets518.3 Wafer-lot date codes1094.5 Single-event functional interrupt548.4 Radiation qualification by process1094.6 Single-event latchup558.5 Using published radiation test data1094.7 Single-event gate ruptures andsingle-event burnouts574.8 Prompt-dose effects59Glossary 113Acronyms 115Chapter 5: Radiation sensitivity by technology5.1 Total ionizing dose635.2 Single-event effects67Radiation Handbook for Electronics1Texas Instruments
About the authorsRobert BaumannEarly in his 29 year career at TI, Robert Baumann discovered that the reaction of 10B with lowenergy cosmic neutrons was a dominant reliability risk in digital electronics and developed mitigationschemes that reduced product failure rates nearly ten-fold. From 1993-1998, He was involved intransistor and radiation effects reliability and advanced failure analysis at TI’s Mihomura Fab andTsukuba R&D Center in Japan. When he returned to Dallas he led radiation effects programs for the advanced technologyreliability group. He co-led the SIA’s expert panel, which successfully negotiated with the U.S. Government to change ITARexport control laws that posed a serious risk of export restriction to advanced commercial technologies. Baumann wasone of the primary authors of the JEDEC (JESD89, 89A) industry standard for radiation characterization in the terrestrialenvironment for which he was awarded the JEDEC Chairman’s Award. In 2012 he moved to the high reliability productgroup focused on improving the characterization, modeling and reporting of radiation effects. Baumann was elected TI andIEEE Fellow. He has coauthored and presented more than 90 papers and presentations, two book chapters and has fifteenU.S. patents. Baumann retired from TI in 2018.Kirby KruckmeyerKirby Kruckmeyer started his career at National Semiconductor (acquired by Texas Instrumentsin 2011) as a process engineer, developing processes for the world’s first 5-inch analog wafer fab.During this time, Kruckmeyer gained experience with semiconductor physics, passivation chargingeffects and radiation-hardened processing. From 1990-1992, Kruckmeyer was an assignee fromNational Semiconductor to Semiconductor Manufacturing Technology (SEMATECH), an industry consortium establishedto improve processing technology in the United States. There, he supervised engineers from other companies in thedevelopment of 150-mm process technologies. After finishing his assignment, Kruckmeyer returned to National, where hemoved into product development and eventually was the product line manager for National’s Automotive Systems group. In2005, Kruckmeyer moved in the High Reliability product group. He was instrumental in developing National Semiconductor’sleadership in space-grade data converters, enhanced low dose rate sensitivity-free products and radiation testing. AtTexas Instruments, Kruckmeyer continues to support space applications, radiation testing and space product development.He has authored and presented over 20 papers, sits on radiation testing standards committees, and participates inradiation conferences.Radiation Handbook for Electronics2Texas Instruments
Foreword: Texas Instruments space flight history Mangalyaan, the Indian Space Research OrganizationMars orbiterTexas Instruments has one of the longest space-flight histories ofany semiconductor vendor. Even before Texas Instruments engineerJack Kilby conceived and built the first integrated circuit (IC) inSeptember 1958, Texas Instruments transistors had flown intospace on the U.S.’s first satellite, Explorer 1, which launched onJan. 31 that same year. KickSat, a group of 104 microsatellites launched on a singlerocket into low Earth orbit in 2014Former Texas Instruments researcher Mary Ellen Weber servedas an astronaut on Discovery Space Shuttle mission spacetransportation system (STS)-70.Since then, products from Texas Instruments have flownon many space missions. Notable and historic missions withTexas Instruments products on board include:Numerous commercial, scientific and governmental satellitesusing Texas Instruments products have launched since 1958 andcontinue to launch weekly. Telstar 1, the first broadcast TV satellite Apollo 11, marking the first man on the moonThrough its acquisitions of Unitrode in 1999 and NationalSemiconductor in 2011, Texas Instruments added significantproduct breadth, expertise and technology to its internal spacegrade semiconductor capabilities. Building on this long heritagein space flight, Texas Instruments continues to innovate andbring new products to the space ecosystem. Texas Instrumentsoffers one of the industry’s broadest portfolios of ICs for spaceapplications, covering a wide range of device types. Powermanagement, data converters, amplifiers, clocks and timing,interface, processors, and sensors are just a few of the devicetypes Texas Instruments provides for space electronics systems.Texas Instruments’ portfolio includes both Class-V qualifiedmanufacturer list (QML) and radiation-hardness assured (RHA) ICs,demonstrating the company’s long-standing commitment to thespace electronics market. Mariner 2, the first successful interplanetary spacecraft Voyager 1, still traveling after 40 years and now the farthesthuman-made object from Earth Every Space Shuttle mission from 1981-2011 Navigational satellites supporting GPS and the GlobalNavigation Satellite System (GLONASS) The Hubble space telescope The International Space Station Rosetta and Philae, the European Space Agency cometorbiter and lander, respectively The Mars Rover 2018 Texas Instruments Incorporated. All rights reserved.Radiation Handbook for Electronics3Texas Instruments
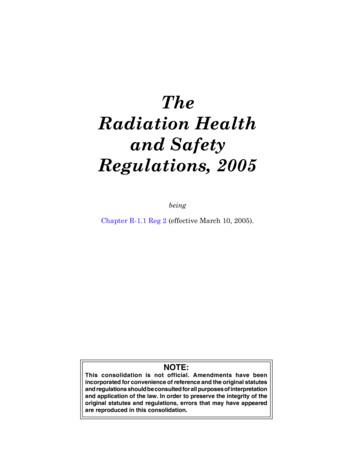
Chapter 1: Radiation environmentsSolar flares and coronal mass ejections (CMEs) generatelocalized intense particle bursts with much higher energies andfluxes than the steady-state solar wind.The type and magnitude of radiation effects observed in electronicsare largely defined by specific device properties and the radiationenvironment in which the devices are used. In this chapter, wereview three of the primary radiation environments: the naturalspace environment encountered outside the protective shielding ofthe Earth’s atmosphere; the natural terrestrial radiation environmentin which most electronic applications operate; and the specializedman-made radiation environments encountered in some medical,industrial and military applications. In later chapters, we will dealwith the different radiation effects and how they manifest in differentdevice types. Radiation belts, accumulations of energetic particles divertedand trapped into toroidal-shaped regions around planets inresponse to their magnetic fields.The reliability of microelectronic components in the harsh spaceradiation environment is characterized by the accumulation ofionizing and displacement damage dose (DDD), as well as a highrate of single-event effects (SEEs). The radiation exposure thaton-board electronics receive is a function of the orbit that thespacecraft follows, the mission duration, the amount of shielding,and the number and magnitude of solar flares or CMEs that mighthave also occurred during the mission.[1-3]1.1 The space radiation environmentThree sources of radiation define the space environment in oursolar system:The Earth’s magnetic field has a varying effect on shielding spaceradiation, depending on the mission orbit.[4] Figure 1-1 shows thedifferent orbit types and their properties. Leaving the Earth’s surface,Figure 1-1 shows the low Earth orbit (LEO), a geocentric orbit withan altitude ranging from 0 to 2,000 km (1,240 miles). In order tokeep a satellite in orbit with minimum energy, it is crucial to eliminateatmospheric drag, so practical Earth orbits begin at approximately167 km (100 miles), and have an orbital period between one andtwo hours. Galactic cosmic rays (GCRs), a nearly isotropic flux (same inall directions) predominantly comprising extremely energeticprotons impacting the Earth from outside our solar system. Solar radiation, comprising a stream of lower-energy photons,plasma and magnetic flux that the sun emits continuously in alldirections, like an ever-present “wind” of particles. This solarwind is punctuated by sporadic emissions from solar storms.Types of Earth orbitBy inclinationBy shapeInclined orbitSatellite track covers rangeof altitudes in Northernand Southern HemispheresEarth’s rotationSatellite orbitApogee(farthestdistance)Elliptical orbitEarth at onefocus of ellipseEquatorial orbitSatellite trackover equatorPerigee(closest distance)Circular orbitEarth at centerAll points of satellite orbitat about the same altitudePolar orbitSatellite track covers all partsof Earth as planet rotatesBy altitudeOrbital period of satellite equal torotational period of EarthSatellite orbit inequatorial planeGeostationary orbit (GEO)35,800 km (22,300 miles) altitudeMedium Earth orbit (MEO)5,000-10,000 km (3,100-6,200 miles)altitude (typical)Low Earth orbit (LEO)About 100-2,000 km(60-1,200 miles) altitudeFigure 1-1. Illustration of orbit types, shapes and properties.Radiation Handbook for Electronics4Texas Instruments
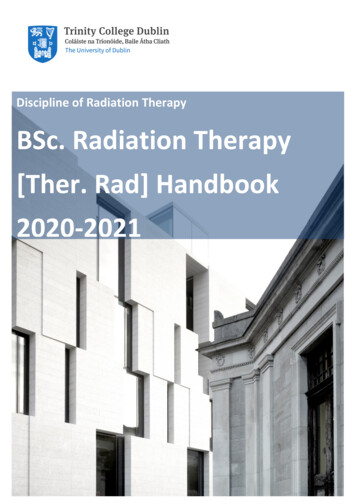
The interplanetary medium of our solar system begins wherethe interstellar medium ends. The solar wind, or flux of energeticparticles emitted continuously and spreading radially away fromthe sun, eventually slows down to subsonic velocities at a distanceabout twice the distance of Pluto’s orbit in a region known as thetermination shock. In this region, the solar wind density is so lowthat it is effectively impeded by the “force” of the interstellar medium.The heliopause is the outer extent of the sun’s magnetic field andsolar wind. Within the heliopause is the heliosphere, a sphericalbubble that encompasses the sun and planets. The heliosphereacts as a giant electromagnetic shield, protecting the planets fromsome of the incident GCR flux. Cosmic-ray particles with lessthan 50 MeV of kinetic energy are unable to penetrate within theheliosphere due to the energy of the solar wind within this volume,such that nearly 75% of the incoming GCR particles are stopped.LEOs are relatively low-altitude orbits and thus the least expensivein terms of energy expended to achieve orbit. In LEO, round-tripsignal distances are the shortest; signal communication delaysare minimal, and surface details are better resolved than for higherorbits. The orbital periods of LEO satellites range from approximately1 1/2 hours to a bit more than two hours.Medium Earth orbit (MEO) is defined between LEO andgeostationary orbit (GEO) at 35,786 km (22,236 miles). MEO isusually used for navigation (GPS), communication and scienceobservation missions. The orbital periods of MEO satellites rangefrom approximately two to nearly 24 hours.Geosynchronous orbit (GSO) and GEO both match the Earth’srotation, and thus complete one full orbit every 24 hours. A satellitein GSO stays exactly above the equator, while a satellite in GEO willswing north to south during its orbit. Any orbiting spacecraft with anFigure 1-2 shows the heliosphere, heliopause and solar system.altitude above GEO is considered to be in high Earth orbit (HEO).18- 3387 Rotation GraphicsGCRs are a major part of the space radiation environment. As theirHEOs are orbits usually reserved for missions that need toRoundget1awayname implies, GCRs originate outside of the solar system andfrom the heavy electromagnetic traffic present in lower orbits, suchconsist of high-energy electrons and ions.as those focused on monitoring deep space.LEO – particularly equatorial orbits, where the magnetic shieldingeffect is maximized – provides the greatest benefit in terms ofminimizing radiation effects. At higher altitudes, orbits such as MEOor GEO, and/or highly inclined orbits or polar orbits, the shieldingprovided by the Earth’s magnetic field is significantly reduced,leading to higher particle fluxes and a higher probability of moredisruptive events. Missions with high inclinations or polar orbits willbe exposed to higher fluxes and higher energy particles since theEarth’s magnetic shielding becomes less effective at higher/lowerlatitudes away from the equator. For interplanetary flights far fromthe Earth’s protective magnetic field, the spacecraft is exposed tothe high fluxes of energetic particles.Solar apexBow shockHeliopauseTermination shockInsterstellar windVoyager 1Neptune EarthUranusSunJupiterPlutoSaturnVoyager 2Galactic cosmic raysBefore focusing on the local space environment of our solar system,consider the environment on a bigger scale. “Outer space” is oftenportrayed as a complete absence of material (empty space), butin actuality, even the vast seemingly empty spaces between thestars are filled with matter and energy. The material that occupiesthe space between the stars, called the interstellar medium,mostly consists of hydrogen, with a smaller fraction of helium andtrace amounts of heavier elements, plus a smattering of dust. Theinterstellar medium is not a perfect vacuum, but has an extremelylow density from 10-4 to 106 atoms/cm3. In stark contrast, ouratmosphere has a density of 1019 atoms/cm3.Figure 2.2Figure 1-2. The heliopause representsthe boundary where the sun’sinfluence ends. The heliosphere is the volume defined by the boundarywhere solar wind velocity ceases being supersonic (termination shock)and is no longer able to filter out the interstellar medium.[5]Scientists believe that GCRs accelerate due to high kinetic energiescaused by shock waves from supernova explosions propagating inthe interstellar medium. GCR composition consists of 89% ionizedhydrogen (protons) and 9% ionized helium (alpha particles), with theremaining 2% consisting of heavier ions and electrons. The galacticmagnetic field deflects the charged GCRs, thus accelerating themaround circular paths – confining them to the disk of the galaxy.The interstellar gas usually forms large “clouds” of neutral atomsor molecules. Near stars or other energetic bodies plus the dilutegas clouds become ionized. The gas in the interstellar medium isnot static but moving, compressing or dissipating in response tothe local interplay of magnetic, thermodynamic, gravitational andradiation processes. This turbulence drives the dynamic evolutionof the interstellar gas, slowing or halting collapse over larger rangeswhile initiating local compression and star formation at morelocalized smaller ranges. Interstellar gas is both the substrate andthe source of galaxies and stars.Radiation Handbook for ElectronicsRadioisotope dating has determined that most GCRs have beentraveling in our galaxy for tens of millions of years. Their directionhas been randomized over time such that they are isotropic.GCRs are traveling at a large fraction of the speed of light, with themajority of particles having kinetic energies of 1 GeV. The GCRflux below 100 MeV is deflected by the heliosphere. Above 1 GeV,the cosmic ray flux decreases fairly consistently with an increase inparticle energy: the higher the energy of the particle, the rarer it is.The highest-energy cosmic rays measured have kinetic energies inexcess of 1020 eV!5Texas Instruments
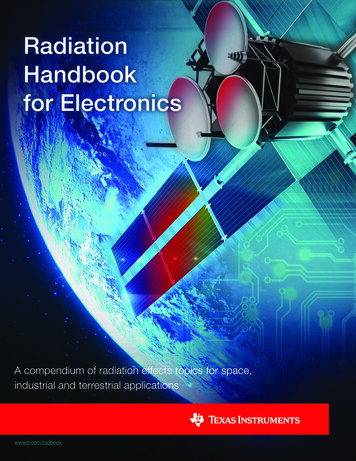
follows an 11-year cycle characterized by approximately four yearsof relatively “inactive sun” where the number of sunspots is at aminimum, followed by seven years of “active sun” with increasednumbers of sunspots. Sunspot activity is correlated to magneticstorms that produce the most harmful radiation.Figure 1-3 shows the differential flux of GCRs as a function ofparticle energy. In comparison, protons emitted from the sun seldomexceed kinetic energies of 1 GeV. The interplanetary magnetic fieldalso influences GCRs within the heliosphere, making it difficult forthem to reach the inner solar system. The lower energy range of theGCR flux is modulated by the 11-year solar activity cycle, droppingduring maximum solar flux when increased ionization deflects theincoming GRC flux and increasing when the sun is at its minimumactivity levels and has less deflective power. The GCR flux varies bya factor of five between solar maximum and minimum conditions.FluxofcosmicCosmicFlux ofraysRays1041 particle per m2 – second10-1Flux (m2 sr GeV sec)-110-6Knee(1 particle per m2 – year)Figure 1-4. Image of two primary features of the photosphere surface:granules and sunspots.10-11Image courtesy of Institute for Solar Physics; observed with the Swedish 1-m Solar TelescopeSolar activity can be divided into three components: solar wind,solar flares and CMEs. The temperature of the sun’s corona isso high that solar gravity cannot keep the energetic particlesfrom escaping. These particles, called the solar wind, streamout of the corona continuously in all directions at speeds rangingfrom 300-800 km/s. The solar wind consists of highly energizedphotons, electrons, protons, helium ions and a small number ofheavier ions. Solar wind couples to the Earth’s magnetic field andproduces storms in the Earth’s magnetosphere. Compared tointense sporadic solar-storm phenomena, the solar wind tends tobe significantly less harmful to spacecraft electronics and crews,because most of the flux consists of much lower-energy particles,with a significant portion of the lower-energy flux deflected andtrapped by planetary magnetic fields.10-1610-21Ankle(1 particle per km2 – year)10-2610910121015Energy (eV)10181021Figure 1-3. Spectrum of galactic cosmic rays.[6]Image courtesy of W. Bietenholz, “Cosmic Rays and the Search for a Lorentz Invariance Violation”Solar radiationFigure 2.3In stark contrast, coronal shock waves, prominences, solar flaresand CMEs can have a large impact on microelectronic reliability byaccelerating solar particles to much higher energies. When viewedhead-on, flares manifest as sudden, rapid and intense variationsin brightness, which occur when built-up magnetic energy issuddenly released. Flares occur around sunspots where intense andspontaneous discontinuities in magnetic field strength precipitatesudden releases of magnetic energy and plasma stored in thecorona, literally shooting large chunks of the coronal surface intospace with high velocity. Figure 1-5 shows a photograph of a flarewith Earth superimposed to show the scale of typical flare events.Continually converting hydrogen into helium via nuclear fusion atits core, the sun is the most intense source of radiation in the solarsystem, emitting more than 60 MW/m2. Two main visible featuresof the sun correlate with solar radiation: the photosphere and thecorona. The photosphere is the visible layer of the sun that emitsphotons, with an estimated temperature of nearly 6,000 K. The solarcorona is the roiling region of super-heated ( 1 million K) plasmasurrounding the photosphere.The photosphere is a huge network of relatively small ( 1,000 km),dynamic, cell-like granules formed by localized convection cells.Figure 1-4 shows the convection granules and sunspots (blackareas) in the photosphere. Convection is driven by heated plasmarising up from the interior (brighter areas) and spreading out acrossthe surface. As the plasma cools during the lateral spreading, itultimately sinks back to the cooler interior (darker areas).During a flare event, radiation is emitted across the electromagneticspectrum, from radio waves to gamma rays. As magnetic energy isreleased during the flare, electrons, protons and heavier nuclei areheated and accelerated to high kinetic energies. CMEs are oftenassociated with solar flares and prominences. As with sunspotactivity, the frequency of CMEs varies with the 11-year sunspotcycle. Flares and CMEs are much more frequent during the activephase of the solar cycle. For example, the frequency of CMEs atsolar minimum is approximately one CME per week, while at solarmaximum, the number of CMEs increases to a couple per day.Sunspots, which appear as dark spots on the photosphere, areregions of high magnetic field strength. They usually form in pairsthat constitute the two poles of a magnet. Sunspot activity istransient, usually lasting for days to weeks. Sunspot activityRadiation Handbook for Electronics6Texas Instruments
Radiation beltsRadiation belts can form around any planetary body that has amagnetic field (magnetosphere) of sufficient strength to divert andcapture particles before they can enter the planet’s atmosphere. Theradiation belts consist of captured particles from the solar wind aswell as lower-energy GCRs. Mercury, Venus and Mars have weakor insignificant planetary magnetic fields; thus, these planets do nottrap appreciable radiation and do not appear to have belt structures.Despite having magnetic fields similar to Earth’s, Saturn andUranus trap much less radiation in their belts. In contrast, JupiterEarth to scalehas an extremely powerful magnetic field – more than 10x that ofEarth – that creates a radiation belt system considerably larger andFigure 1-5. Ultraviolet image of a solar flare, with Earth shown formore intense than Earth’s. The Earth’s magnetic field collects andscale. Image courtesy of NASA/Solar Dynamics Observatory/Atmospheric Imaging Assemblytraps protons and electrons, creating doughnut-shaped (toroidal)concentrated regions of trapped charged particles in the vicinityOf key concern are the solar energetic particles (SEPs), electrons,of Earth. These belts were discovered by Dr. James Van Allen andprotons and heavier ions accelerated during solar flares or18- 3387 Rotation GraphicsRound 1a team of scientists in a series of experiments starting with theCME-induced shock waves. During such events, the intensity ofExplorer I mission in 1958, the United States’ first artificial satellite.SEPs can increase by hundreds to millions of times. The maximumFigure 1-7 is a simplified illustration of the two concentric belts ofenergy reached by SEPs is typically somewhere in the range ofradiation trapped by the Earth’s magnetic field.1 MeV to 1 GeV.Figure 1-6 shows example spectra comparing solar wind, SEP andGCR proton events. Since flare and CME events are highly directed,they affect a relatively small region of space, but are characterizedby very high particle fluxes lasting hours to days.[7-12] The fluxescan exceed the normal space radiation levels by many orders ofmagnitude. For example, CMEs can generate in excess of 500,000protons-cm-2sec-1. Being caught in a flare or CME is hazardous tocrews and microelectronics in space vehicles – an example of beingin the wrong place at the wrong time.Representative proton energy spectra at 1 AUFigure 1-7. Artist’s conception of the two radiation belts surroundingthe Earth. Referred to as the Van Allen belts, these toroidal inner andFigure magnetic2.7outer belts are formed by the Earth’sfield.Solar windN (E) particles cm -3 keV -11The belts are thicker at the equator where the Earth’s magnetic fieldis strongest (where it is parallel to the surface) and get thinner athigher and lower latitudes. They disappear totally at the poles wherethe Earth’s magnetic field becomes oriented normal to the Earth’ssurface. At the equator, the inner belt ranges from an altitude ofapproximately 1,200 km to 6,000 km, while the outer belt rangesfrom approximately 13,000 km to 60,000 km above the Earth’ssurface.[13] The inner belt contains high concentrations of electronswith kinetic energies of 1-5 MeV and protons with kinetic energies 10 MeV. The outer belt consists mainly of electrons with kineticenergies of 10-100 MeV. The outer belt’s particle populationfluctuates dramatically in response to solar activity.SEP events10 -5 Interstellarpickup ionsCorotatingparticleevents ions10 -1010 -15Galacticcosmic rays1010351010(E) Nucleon eV710In general, since the radiation belts are regions where radiationexposure will be greatly increased, travel through them is minimizedor avoided whenever possible. LEOs are safely below the radiationbelts and hence are the most benign, limited to a region of relativelylow particle flux. LEOs are also partially shielded from GCRs bythe belts.9Figure 1-6. Differential proton flux as a function of proton energy2.6for solar wind, SEPs andFigureGCR distributions.Radiation Handbook for Electronics7Texas Instruments
phicsthe Earth’s orbit at that altitude. For example, most of the radiationdose exposure that the International Space Station receives occurswhile it flies through the SAA. The SAA is shown in the cross-sectionand external view in Figure 1-8.An occasional transitory third radiation belt has been recentlyobserved [14] that forms and dissipates by temporarily splitting offfrom the outer belt. The omnidirectional particle fluxes within theinner and outer belts peak at approximately 104-106 cm-2-sec-1. Incontrast, the flux of particles between the Earth’s surface and innerbelt is 10-100 cm-2-sec-1, while in the region between the two belts,it is 103-104 cm-2-sec-1. The Earth’s magnetic field is tilted about 11degrees from the rotation axis. As a result, the radiation belts do notalign exactly with the Earth’s surface. This asymmetry causes theinner belt, with a nominal altitude of 1.3 km, to drop to 200-800 kmin a specific region. This extension of the inner belt to lower altitudesis located over South America off the coast of Brazil, and extendsover much of South America (as shown in Figure 1-8), forming theso-called South Atlantic Anomaly (SAA).[15] While the particle fluxesin the SAA are significantly lower than at higher altitudes deeperwithin the belt, they are significantly higher than anywhere else inWhile the electrons and protons trapped in the belts have muchlower energies than most GCRs or SEPs, the much higher fluxlevels are dangerous to crew and electronics if they are exposedfor extended periods. Mission orbits/paths are therefore specificallytailored to minimize the spacecraft’s exposure time to radiation beltsbecause of high particle fluxes. Minimizing exposure to the radiationbelts greatly reduces the rate of SEEs and the accumulation of doseeffects. Additionally, in some cases, electronics are powered downduring the times when they are in the radiation belts to reduce totalionizing dose (TID) effects, which are made worse by the presenceof electric fields.500-km altitudeEarth’s surfaceSAACross-section view.Figure 1-8. Cross-section showing the extent of inner-belt ingress at the SAA (left), and the location and extent of SAA relative to the globe (right).[16]Figure 2.8Radiation Handbook for Electronics8Texas Instruments
1.2 The terrestrial radiation environmentThe ratio of neutrons to protons must fall within a certain rangefor an element to be stable. Unstable nuclei emit radiation usuallyin a multistep process, until a stable ratio of nucleons is reached.Nuclear decay occurs with the emission of an alpha particle, a betaparticle, a gamma photon, a positron or the nuclear capture of aninner electron.The terrestrial radiation environment exists within the Earth’satmosphere, from sea level to flight altitudes (typically up to amaximum of 13 miles or 22 km) and at all latitudes and longitudes.Three sources of radiation dominate microelectronic reliabilityfailures in the terrestrial environment:Of these processes, the emission of alpha particles is the primaryradiation of concern because alpha particles are the most highlyionizing and therefore the most potentially damaging to theoperation of microelectronic devices. Although there are manyradioactive isotopes, uranium and thorium and their associateddaughter products have the highest activities of the naturallyoccurring radioactive species. They are therefore the dominantsource of alpha particles in materials. Uranium and thorium areboth heavy elements, and it takes multiple decays into successiveunstable daughter products to ultimately shed enough excessnuclear mass for them to become stable isotopes of lead. Very localized alpha-particle radiation ( 50 μm from activesilicon devices), emitted by the natural radioactive decay ofunstable isotopes like uranium, thorium and their daughterisotopes. High-energy cosmic-ray neutron radiation, produced as abyproduct of nuclear reactions between galactic and solarhigh-energy protons with the nitrogen and oxygen nuclei inthe Earth’s atmosphere. The resulting neutron flux dependson the altitude, latitude, longitude and solar activity. The interaction
transistor and radiation effects reliability and advanced failure analysis at TI's Mihomura Fab and . Texas Instruments, Kruckmeyer continues to support space applications, radiation testing and space product development. He has authored and presented over 20 papers, sits on radiation testing standards committees, and participates in .