Transcription
COREMetadata, citation and similar papers at core.ac.ukProvided by University of Queensland eSpaceSCHOOL OF INFORMATION TECHNOLOGYAND ELECTRICAL ENGINEERINGAn Analysis of Data Quality DimensionsVimukthi JayawardeneSchool of Information Technology and Electrical EngineeringThe University of Queenslandw.jayawardene@uq.edu.auShazia SadiqSchool of Information Technology and Electrical EngineeringThe University of Queenslandshazia@itee.uq.edu.auMarta IndulskaBusiness SchoolThe University of Queenslandm.indulska@business.uq.edu.auITEE TECHNICAL REPORTNo. 2013-01 (October 2013)This report has been reviewed by the Research Committee of the School of Information Technologyand Electrical Engineering, the University of Queensland. Please cite as follows:Jayawardene, V., Sadiq, S. & Indulska, M. (2013) An analysis of data quality dimensions. ITEETechnical Report No. 2013-01. School of Information Technology and Electrical Engineering, TheUniversity of Queensland, Brisbane, Australia.www.itee.uq.edu.au
An Analysis of Data Quality DimensionsVimukthi JayawardeneSchool of Information Technology and Electrical EngineeringThe University of Queenslandw.jayawardene@uq.edu.auShazia SadiqSchool of Information Technology and Electrical EngineeringThe University of Queenslandshazia@itee.uq.edu.auMarta IndulskaBusiness SchoolThe University of Queenslandm.indulska@business.uq.edu.auAbstract. Data quality (DQ) has been studied in significant depth over the lasttwo decades and has received attention from both the academic and thepractitioner community. Over that period of time a large number of data qualitydimensions have been identified in due course of research and practice. While itis important to embrace the diversity of views of data quality, it is equallyimportant for the data quality research and practitioner community to be unitedin the consistent interpretation of this foundational concept. In this paper, weprovide a step towards this consistent interpretation. Through a systematicreview of research and practitioner literature, we identify previously publisheddata quality dimensions and embark on the analysis and consolidation of theoverlapping and inconsistent definitions. We stipulate that the sharedunderstanding facilitated by this consolidation is a necessary prelude to genericand declarative forms of requirements modeling for data quality.1 IntroductionData quality (DQ) has been widely researched over the past several decades [1] andby now has developed into a professional discipline [2], with a prominent focuswithin organizational strategy. Advancements in data quality management haveresulted in contributions from researchers as well as practitioners. A wealth ofknowledge exists in the realm of the practitioner community (eg:- [3], [4], [5], [6]),including initiatives such as the International Association of Information and DataQuality and its Information Quality Certification Program (www.iaidq.org). Althoughthe diversity of contributions is valuable, some fundamental aspects of data qualitymanagement, in particular those relating to DQ dimensions, and consequentlymeasures and metrics, have regressed into a level of disparity that does not support ashared understanding of the core knowledge of the discipline. In this paper, we1
address this area of concern and present the results of an analysis and consolidation ofthe main contributions of DQ dimensions stemming from research, vendor andpractitioner communities.In light of the management axiom “what gets measured gets managed” [7],dimensions of data quality signify a crucial management element in the domain ofdata quality. On these grounds, over the last two decades researchers and practitionershave suggested several classifications of DQ dimensions many of which haveoverlapping, and sometimes conflicting interpretations (eg. [8], [3], [5], [4]). Despitethe numerous classifications, few studies to date have embarked on an effort toconsolidate these view-points. For example, Eppler [9] provides a useful analysis ofseveral of the existing classifications of DQ dimensions and recognizes sixteenmutually exclusive dimensions. This analysis is very useful, however the selection ofclassifications is incomplete and the coverage of the study does not span academicand practitioner contributions. Further, the basis for selection (or exclusion) of theclassifications and their constituent dimensions has not been established. Yet, acomprehensive classification of the DQ dimensions is instrumental in the pursuit ofdeveloping a streamlined and unified set of dimensions that can assist in a sharedunderstanding within the broader community and provide a basis for modeling ofdata quality requirements.To bridge this gap in the body of knowledge, in this paper we undertake a study ofexisting body of knowledge on DQ dimensions. Our study spans both academic andindustry contributions and incorporates both the semiotic and the product perspectiveon data quality. We believe that such an analysis is essential to create a sharedunderstanding of the multiple and often conflicting interpretations of DQ dimensionsas currently found in the broader research and practice body of knowledge. Broadconvergence on the understanding and interpretations of a foundational concept suchas DQ dimensions is a necessary prelude to the development of generic data qualityrequirements modeling and enforcement frameworks, particularly as the scale,availability and usage of data increases exponentially.2 Background2.1 Data & Data QualityBefore moving to the notion of DQ dimensions, let us revisit the first order questionsarising from the background of this domain. What is data and what is data quality? In[10] Liebenau and Backhouse used modern semiotic theory principles developed byMorris [11] to explain data as “ language, mathematical or other symbolicsurrogates which are generally agreed upon to represent people, objects, events andconcepts”. In its simplest form, data is a representation of objects or phenomena inthe real world. Thus, when it comes to the discussion of quality of data, we can saythat poor quality data is a result of poor representation of the real world. In thecontext of information systems, this representation of the real world is moderated bythe needs of the system users, and hence the reference framework to evaluate the2
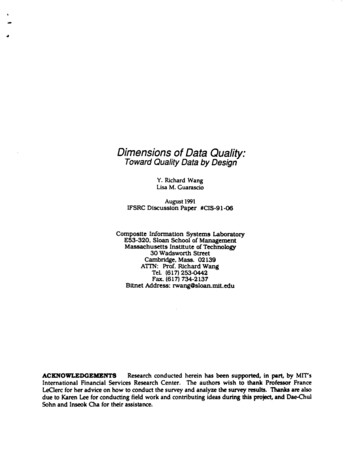
representation is the set of user needs- i.e. the same object in the real world may havedifferent representations in an information system depending on the need of the users.The semiotic perspective of data has been adopted by DQ researchers as well, forexample, Price and Shanks [12] defined three quality levels for data, i.e. syntacticquality, semantic quality and pragmatic quality.The application of semiotics can be considered as one of the philosophicalapproaches towards the study of data and its quality. To date, however, the semioticperspective has not become popular among researchers and practitioners. When itcomes to supporting processes for managing DQ, a prominent approach, proposed byWang [13], uses a product perspective of data as the underlying approach. Byconsidering that ‘information is processed data’, Wang argues that information isanalogous to products and data is analogous to raw materials in a typical productmanufacturing process. Based on this argument, Wang considers information as aproduct of an information system and recognizes an information manufacturingprocess analogous to a product manufacturing process [13].Since traditional product quality is a well explored concept, researchers haveattempted to use product quality management models claiming ‘fitness for use’ as theprinciple for distinguishing good quality data and poor quality data. The ‘fitness foruse’ approach is based on the general definition for quality introduced by Juran [14].In the case of products, fitness for use is evaluated with reference to productspecification, which contains customer expectations expressed in terms of differentorthogonal dimensions. In line with this perspective, Wang and Strong [8] havedefined dimensions for data in a way that can represent customer expectations andcan be used in creating a data specification.2.1 Quality DimensionsThe term dimension is defined as “a measurable extent of a particular kind, such aslength, breadth, depth, or height”[15]. Dimensions deal with measurements or, inother words, are quantifications of characteristics of an object or phenomenon. Theessence of this definition is apparent in many classifications of dimensions invarious quality domains. For example, Garvin [16] defines eight dimensions ofproduct quality, viz. performance, features, reliability, conformance, durability,serviceability, aesthetics, and perceived formanceTable 1. Product quality dimensions Garvin [16]DefinitionThe product's primary operating characteristic (such asacceleration, braking distance, steering, and handling of anautomobile)The bells and whistles'' of a product (such as power optionand a tape or CD deck of a car)The probability of a product's surviving over a specifiedperiod of time under stated conditions of useThe degree to which physical and performance characteristics3
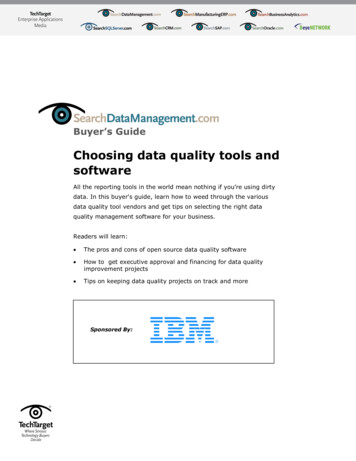
of a product match pre-established ed qualityThe amount of use one gets from a product before itphysically deteriorates or until replacement is preferableThe speed, courtesy, and competence of repairHow a product looks, feels, sounds, tastes, or smellsThe subjective assessment of quality resulting from image,advertising, or brand names.From this classification it is evident that the dimensions lead to a measurableperspective of the product itself. The underlying idea is that once the specification forthe product is created using these dimensions, product quality can be measured byevaluating the extent to which the prescribed values for the dimensions are achieved.It should be noted that some of these perspectives are declarative in nature,explaining the product precisely (performance, features, durability, reliability,conformance etc.); i.e. they explain the inherent or representational nature of theproduct independent of its users. Others, on the other hand, describe perceptionalmeasures (perceived quality, serviceability, aesthetics) facilitating a judgment of theproduct that depends on its users. Similarly Russell and Taylor [17] define thedimensions of service quality as time and timeliness, completeness, courtesy,consistency, accessibility and convenience, accuracy, and responsiveness.Table 2. Service quality dimensions by Russell and Taylor [17].DimensionTime ility omer wait time, On-time completionCustomers get all they ask forTrealment by employeesSame level of service for all customersEase of obtaining servicePerformed correctly every timeReaction to special circumstances or requestsIn this classification the dimensions have been defined using the declarativeperspective to explain the service (completeness, accuracy, time and timeliness) aswell as the perceptional perspective, facilitating the perceptional judgment of theservice (courtesy, consistency, accessibility and timeliness, responsiveness).Thus, we observe that studies on product and service quality consider both thedeclarative and perceptional perspectives. These declarative and perceptionalperspectives similarly play a fundamental role in identifying and defining DQdimensions. Hence in this paper we use the following two criteria to identify andanalyze DQ dimensions, and exclude published definitions that do not fall into thetwo categories of dimensions:4
Declarative Perspective: Focuses on user independent characteristics of data whichexplains data itself like measures comparing real world objects and its representationas data, inherent characteristics of data declared by meta-data, Schema, standards,policies, formats etc. and characteristics imposed by the operational aspects oforganizations like business rules and processes etc.Perceptional Perspective: Focuses on user dependent characteristics of data such aseffective usability of data for intended purposes and users’ judgment about the fitnessfor use.3 ApproachIn our review of the classifications, we observe that most approaches appear to beinfluenced by the classification of Wang and Strong [8], while also incorporatingindividual experience. Due to the contextual nature of many studies, theseclassifications are quite diverse. This diversity, while important, makes it difficult tobuild a unified and shared understanding of the DQ domain from a dimension andconsequently measurement perspective. Accordingly, a synthesis of the variousdefinitions is required to cater for the multiplicity of DQ dimensions. For this analysiswe identified four relevant sources of DQ dimension classifications, ensuringcoverage of the academic, practitioner, vendor and business communities, anddeveloped a four-step methodology as described below.First we reviewed existing literature and identified prominent DQ dimensionclassifications that fit the following perspectives:a) Perspectives from industry practitioners involved in consulting on large dataquality projects and contributing to DQ body of knowledge by publishing booksand an apparent prominence in industry. Relevant sources within thepractitioner perspective were identified by examination of citations in publicforums and professional training programs by professional bodies such asDAMA [18] and IAIDQ [19]. Within these sources we identified severalprominent contributions [3], [5], [6], [4], [20].b) Perspectives from market leaders of DQ management tools, as identified byGartner’s Magic Quadrant [21]. These market leaders include: SAP [22], IBM[23], and Informatica [24].c) Perspectives from organizations that have recognized the importance of DQ anddeveloped their own DQ frameworks to manage DQ. Although manyorganizations conduct DQ projects, only few have made available their DQdimensions publicly with sufficient level of information suitable for an analysis.In our search we found Bank of England [25] and Health Information andQuality Authority [26], the latter representing an international study on DQpractices of healthcare organizations in England, Wales, Canada and NewZealand.d) Perspectives from academia with rigorous research based findings and a high5
level of citations: In out earlier work [31] we analysed DQ researchcontributions over the last 2 decades and created a bibliographic database1 ofover one thousand publications. We used this resource to identify researcharticles that focus on data quality criteria or dimensions. Consequently, weidentified 36 publications focussing on DQ dimensions in sufficient depth andbreath. Based on citation analysis, the most prominent DQ dimensionsclassification was developed by Wang & Strong [8], with the majority of otherclassifications being derivatives of this original work. On this basis we selectedthe original work by Wang and strong [8] and three additional classificationsthat have significant and contrasting differences [27], [9], [28].Altogether we selected fourteen publications that fairly represent the above fourperspectives, and thus provide a broad scope for the analysis.In the second stage of the analysis, the 14 papers (or parts thereof, in case ofbooks) were loaded into NVIVO2 – a qualitative data analysis tool. We employed amulti-coder approach to facilitate a rigorous identification of the dimensions withinthe text of the 14 documents. The text was reviewed and individually coded by tworesearchers to ensure all dimensions were identified. Each coder independentlycoded the relevant text in NVIVO2, creating a node for each dimension and itsdefinition. The coding structures were then consolidated between the tworesearchers to arrive at a final coding that identified 127 dimensions after resolvingcoding disagreements through discussion. From this coding process we were able toidentify the contextual meaning of the dimensions, based on which we could elicitthe underlying theme behind each dimension.In the third step, we analyzed the definitions of each dimension with respect totheir reflection of a declarative or a perceptional characteristic. In particular, foreach definition, two researchers individually coded the definitions as beingperceptional (P), declarative (D), a mixture of both (D/P) or neither (X). The aim ofthis task was to refine the list of dimensions by eliminating those that do notrepresent characteristics of data or users’ view of data. The independent ratings wereevaluated using Cohen’s Kappa , with a result of 0.81, indicating high confidenceabout raters’ agreement [29]. Coding disagreements were then discussed betweenthe three researchers until a consensus was reached.In the final step, one researcher clustered the dimensions based on evident themesand overlaps. Following this step, two researchers individually reviewed theclustering. The three researchers then met to consolidate the clustering, leading to anagreement of eight main clusters, using names based on the most common themesuitable to represent each cluster.1This database can be accessed through http://dqm.cloud.itee.uq.edu.au/2NVIVO is a qualitative data analysis tool designed for analysing rich text-basedand/or multimedia information, where deep levels of analysis of data are required .http://www.qsrinternational.com/products nvivo.aspx6
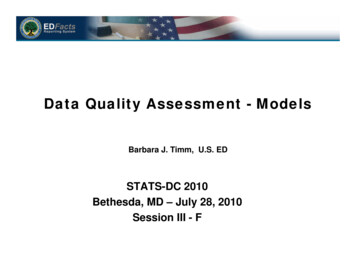
4 Analysis & ResultsThe fourteen sources of dimensions selected for this study revealed 127 dimensions.These dimensions are expressed using one or more representative terms, togetherwith the authors’ own definitions. It should be noted that some dimensions werereferred to by the same term in different classifications; in the lists presented belowsuch terms are presented together.Following the classification and clustering, eight main clusters were identified, viz.Completeness, Availability & Accessibility, Currency, Accuracy, Validity, Usability& Interpretability, Reliability and Credibility, and Consistency. In the followingdiscussion these clusters are presented in detail with the individual terms anddefinitions given by various authors. Further, each individual definition is classifiedinto declarative perspective (D) or perceptional perspective (P), based on thecontextual meaning of the author’s definition.Completeness:Ability torepresent nullvaluesNull valuesRepresentationof null valuesValue existenceCompletenessTable 3: Dimensions relating to completeness.Ability to distinguish neatly (without ambiguities)null and default values from applicable values of thedomain. [3]A null value is a missing value. However, a valuethat is missing may provide more information thanone might think because there may be differentreason that it is missing. A null value might actuallyrepresent an unavailable value, an attribute that isnot applicable for this entity, or no value in theattribute’s domain that correctly classifies this entity.Of course, the value may actually be missing [4]When the null value (or absence of a value) isrequired for an attribute, there should be arecognizable form for presenting that null value thatdoes not conflict with any valid values. [4]A given data element (fact) has a full value storedfor all records that should have a value [5]Completeness refers to the degree to which valuesare present in a data collection, as for as anindividual datum is concerned, only two situationsare possible: Either a value is assigned to theattribute in question or not. In the latter case, null, aspecial element of an attribute’s domain can beassigned as the attribute’s value. Depending onwhether the attribute is mandatory, optional, orinapplicable, null can mean different things. [3]Completeness refers to the expectation that certain7DDDDD
Fact ensivenessValuecompletenessRecord existenceCompleteattributes are expected to have assigned values in adata set. Completeness rules can be assigned to adata set in three levels of constraints: 1. Mandatoryattributes that require a value 3. Inapplicableattributes (such as maiden name for a single male),which may not have a value.2. Optional attributes,which may have a value [4]Data are of sufficient depth, breath and scope for thetask at hand [8]Data is complete if no piece of information ismissing – anti-example: “The Beatles were JohnLennon, George Harrison and Ringo Starr” [20]Determined the extent to which data is not missing.For example, an order is not complete without aprice and quantity [22]An expectation of completeness indicates thatcertain attributes should be assigned values in a dataset. Completeness rules can be assigned to a data setin three levels of constraints:1. Mandatory attributesthat require a value, 2. Optional attributes, whichmay have a value based on some set of conditions,and 3. Inapplicable attributes, (such as maiden namefor a single male), which may not have a value. [24]Completeness of data refers to the extent to whichthe data collected matches the data set that wasdeveloped to describe a specific entity. Monitoringfor incomplete lists of eligible records or missingdata items will identify data quality problems. [26]Knowledge Workers have all the Facts they need toperform their processes or make their decisions [5]Every real-world phenomenon is represented [27]DThe data includes all of the types of informationimportant for its use [27]Is the scope of information adequate? (not too muchnor too little) [9]A given data element (fact) has a full value storedfor all records that should have a value [5]A record exists for every Real-World Object orEvent the Enterprise needs to know about [5]Domain Level: Data element is 1. Always requiredbe populating and not defaulting; or 2. Requiredbased on the condition of another data element.Entity Level: The required domains that comprise anP8PDDDDPDDDDD
entity exist and are not defaulted in aggregate.[23]Completeness is considered in a broad sense and contains several themes. Namely, itfocuses on handling of null values, representing real world objects without omissionand maintaining fairness in representation of real world objects for intended usagecan be considered as dominating themes.Several authors have pointed out that null values should be given specialconsideration in managing data quality. For example, “ability to distinguish neatly(without ambiguities) null and default values from applicable values of the domain”[3] Null values have multiple implications such as unknown, missing or notapplicable values, thus causing ambiguity in their interpretation.Different granularity levels (field, record, and table) may define completeness indifferent ways. For example, “data are of sufficient depth, breath and scope for thetask at hand” [8], and “knowledge workers have all the facts they need to performtheir processes or make their decisions” [5]. Thus, a snapshot view of the databasemay not indicate if the data is complete or not. Completeness cannot be judgedmerely by looking at the existing records of a database - there can be missing dataobjects altogether. This problem relates back to the fundamental notion of closedworld vs. open world assumptions for digital information systems [30]. For example,“a record exists for every Real-World Object or the Event the Enterprise needs toknow about” [5] and “every real-world phenomenon is represented” [27].In light of the above themes it is apparent that in the majority of the definitions,completeness of data is defined using declarative measures that relate to therepresentation of real world objects.Availability & Accessibility:Table 4: Dimensions relating to Availability & Accessibility.AccessibilityData are available or easily or quickly retrieved [8]Is there a continuous and unobstructed way to getto the information? [9]Accessibility of data refers to how easily it can beaccessed; the awareness of data users of what datais being collected and knowing where it is located.PPP[26]Speed and ease of locating and obtaining aninformation object relative to a particular activityP[28]Accessibility andclarityAccessibilitytimelinessAccessibility refers to the physical conditions inwhich users can obtain data Clarity refers to thedata’s information environment includingappropriate metadata [25]The characteristic of getting or having theInformation when needed by a process or9PP
AvailabilityEase of Use andmaintainabilitySecurityKnowledge Worker [5]The Characteristic of the Information beingaccessible when it is needed [5]A measure of the degree to which data can beaccessed and used and the degree to which data canbe updated, maintained, and managed [6]Is the information protected against loss orunauthorized access? [9]The extent to which information is protected fromharm in the context of a particular activity [28]Allowing access torelevant metadataData CoverageTimeliness ibleAccess SecurityAppropriate metadata is available to define,constrain, and document data [27]A measure of the availability andcomprehensiveness of data compared to the totaldata universe or population of interest [6]Timeliness reflects the length of time betweenavailability and the event or phenomenondescribed. Punctuality refers to the time lagbetween the release date of data and the target datewhen it should have been delivered [25]Can all of the information be organized andupdated on an on-going basis? [9]Can the infrastructure match the user’s workingpace? [9]Is the information processed and delivered rapidlywithout delays? [9]Timeliness refers to the time expectation foraccessibility and availability of information.Timeliness can be measured as the time betweenwhen information is expected and when it isreadily available for use. For example, in thefinancial industry, investment product pricing datais often provided by third-party vendors. As thesuccess of the business depends on accessibility tothat pricing data, service levels specifying howquickly the data must be provided can be definedand compliance with those timeliness constraintscan be measured [24]Data is easy and quick to retrieve [27]Access to data can be restricted and hence keptsecure [8]10PPD/PD/PDDDPPPP/DPD
SecureData is appropriately protected from damage orabuse (including unauthorized access, use, ordistribution) [27]DIn this cluster, a broad range of definitions combining timeliness, availability andaccessibility of data can be observed. Availability of data when needed and thesecurity perspective of data are the dominating aspects of this cluster.In existing classifications timeliness and currency are two terms that have asignificant interplay and overlap. However, we observe some fundamentaldifferences in their interpretation (timely availability of data vs. correct aging ofdata\freshness of data) when analysing the various definitions and hence currency,together with other related dimensions, is a cluster in and of itself.On-time availability of data is a major consideration of this cluster, as evidenced byseveral closely related definitions. For example, [24] consider that timeliness “refersto the time expectation for accessibility and availability of information”. Similarly,[5] discuss “the characteristic of getting or having the Information when needed by aprocess or Knowledge Worker”. In both of these definitions the focus is on theefficient retrieval of data when needed, whereas [6] broadens the focus towardsefficient database management: “a measure of the degree to which data can beaccessed and used and the degree to which data can be updated, maintained, andmanaged”.On the other hand, several authors have aligned accessibility of data with securitygiving more prominence to the security perspective of data – e.g. “access to data canbe restricted and hence kept secure” [8] and “is the information protected againstloss or unauthorized access?” [9]In this cluster some definitions include both declarative and perceptionalcharacteristics due to the fact that timeliness and security components of thedefinitions lead to declarative measures based on operational aspects like businessrules policies and standards etc. while availability and accessibility component leadsto user judgements based on the task at hand.Currency:Table 5: Dimensions relating to CurrencyCurrencyA datum value is up-to-date if it is correct in spite of apossible discrepancy caused by time related change to thecorrect values; a datum is outdate at time t if it isincorrect at t but was correct at some time preceding t.currency refers to a degree to which a datum in questionis up-to-date. [3]The “age” of the data is correct for the KnowledgeWorker’s purpose or purpose. Purposes such as inventorycontrol for Just-in-Time Inventory require the mostcurrent data. Comparing sales trends for last period to11DD/P
Currency/TimelinessData DecayTimelyperiod one-year ago requires sales data from respectiveperiods.[5]Is the information up to-date and not obsolete? [9]Currency refers to the degree to which information iscurrent with the world that it models. Currency canmeasure how “up-to-date” information is, and whether itis correct despite possible time-related changes. Datacurrency may be measured as a function of the expectedfrequency rate at which different data elements areexpected to be refreshed, as well as verifying that thedata is up to date. For example, one might assert that thecontact information for each customer must be current,indicating a requirement to maintain the most recentvalues associated with the individual’s contact data [24]The age of an information object [28]Currency refers to the degree to which information iscurrent with the world that it models. Currenc
Data quality (DQ) has been widely researched over the past several decades [1] and . 2.1 Quality Dimensions The term dimension is defined as "a measurable extent of a particular kind, such as length, breadth, depth, or height"[15]. Dimensions deal with measurements or, in