Transcription
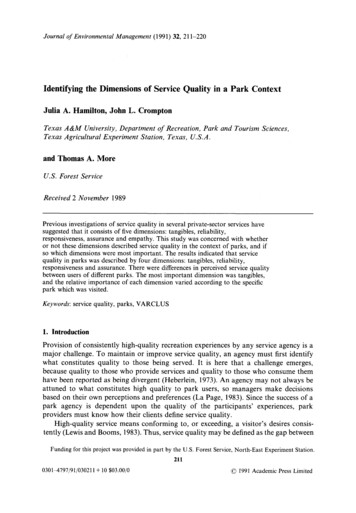
Journal of Environmental Management (1991) 32, 211-220I d e n t i f y i n g t h e D i m e n s i o n s o f Service Quality in a P a r k ContextJ u l i a A. H a m i l t o n , J o h n L. CromptonTexas A&M University, Department of Recreation, Park and Tourism Sciences,Texas Agricultural Experiment Station, Texas, U.S.A.and Thomas A. MoreU.S. Forest ServiceReceived 2 November 1989Previous investigations of service quality in several private-sector services havesuggested that it consists of five dimensions: tangibles, reliability,responsiveness, assurance and empathy. This study was concerned with whetheror not these dimensions described service quality in the context of parks, and ifso which dimensions were most important. The results indicated that servicequality in parks was described by four dimensions: tangibles, reliability,responsiveness and assurance. There were differences in perceived service qualitybetween users of different parks. The most important dimension was tangibles,and the relative importance of each dimension varied according to the specificpark which was visited.Keywords: service quality, parks, VARCLUSI. IntroductionProvision of consistently high-quality recreation experiences by any service agency is amajor challenge. To maintain or improve service quality, an agency must first identifywhat constitutes quality to those being served. It is here that a challenge emerges,because quality to those who provide services and quality to those who consume themhave been reported as being divergent (Heberlein, 1973). An agency may not always beattuned to what constitutes high quality to park users, so managers make decisionsbased on their own perceptions and preferences (La Page, 1983). Since the success of apark agency is dependent upon the quality of the participants' experiences, parkproviders must know how their clients define service quality.High-quality service means conforming to, or exceeding, a visitor's desires consistently (Lewis and Booms, 1983). Thus, service quality m a y be defined as the gap betweenFunding for this project was provided in part by the U.S. Forest Service, North-East Experiment Station.2110301 4797/91/030211 10 03.00/09 1991 Academic Press Limited
212Service quality in a park contextwhat visitors desire from a service and what is perceived to be received. This type ofdiscrepancy theory has been widely used to define satisfaction in the leisure literature(for example, Peterson, 1974; Roggenbuck and Schreyer, 1977). However, there are atleast two important differences between the reported work on satisfaction and the workreported here on service quality. First, service quality is conceptualized to be adistinctively different construct from satisfaction, in that satisfaction relates to a specifictransaction or experience, whereas service quality represents the summation of pasttransactions or experiences with a service. The two constructs are related in thatincidents of satisfaction over time result in perceptions of service quality (Parasuramanet al., 1988; Oliver, 1981). Thus, perceived service quality may be conceptualized asapproximating the average satisfaction level of all previous individual experiences.A second major difference is that discrepancy theory in the satisfaction literature hasgenerally evaluated perceptions against expectations, whereas concern in service qualityis with evaluating service perceptions against desires. The difference is conceptuallyimportant. Expectation reflects what an individual anticipates or predicts the service willdeliver, whereas desire is concerned with what an individual wants the service to deliver.Thus, service quality is concerned with what consumers feel a service provider shouldoffer rather than would offer (Parasuraman et al., 1988). If expectation is used as thecriterion against which service quality is measured, it may encourage managers to attainsatisfactory quality ratings by lowering consumers' expectations of what they couldanticipate from a service. In such cases, although the quality of service delivered waslow, the evaluation would show consumers to be satisfied with it because theirexpectations were low. If the criterion standard is the quality of service consumers desireor want, this measurement conundrum is avoided.The parks field has a relatively large body of literature which addresses satisfaction,yet performance is usually evaluated by such measures as numbers of visitors, repeatusage, revenues accrued, willingness-to-pay, or available space (Clawson and Knetch,1966; Alldredge, 1973; Heberlein and Shelby, 1977; McConnell, 1977; Cicchetti andSmith, 1973; Cicchetti, 1976). While the constructs of satisfaction and quality areinextricably tied, it has been suggested that most overall measures of satisfaction are toobroad to be useful (Manning, 1986), or too issue-specific or site-specific to be generalizable (Noe, 1987). It has long been considered a goal of management to maximize usersatisfaction within the constraints of budget, revenue and resources (Lime and Stankey,1971; Lucas and Stankey, 1974; Bury, 1976). Parks provide essential outdoor opportunities that may be close to home, generally low in direct cost and offer a variety ofactivities. However, the lack of revenue generation means that there is no managerialfeedback through "price signals" (Manning, 1986). The notion of defining servicequality level in quantitative terms is largely unexplored.Interest in service quality is generic across all service industries, and an emergingliterature in the marketing field offers guidance as to how it may be assessed in thecontext of parks. Much of this work has been done by Parasuraman, Zeithaml andBerry, and their published findings are cited in this paper. The first stage of their workinvolved 14 in-depth interviews with senior executives and 12 focus group interviewswith consumers. Four service categories were chosen for investigation; retail banking,credit cards, security brokerage, and product repair and maintenance. These interviewsrevealed 10 dimensions that consumers used in forming desires and perceptions ofservice quality that transcended all four types of services. They were: reliability,responsiveness, competence, access, courtesy, communication, credibility, security,understanding the customer, and tangibles (Berry, et al, 1985; Parasuraman et al., 1985).
J. A. Hamilton etaL213These 10 dimensions were operationalized and served as the basic structure describing the service quality domain for which items to measure service quality were generated.Ninety-seven items were generated to form an initial item pool. A series of procedures,using data collected from 1000 respondents, were undertaken to develop a refined scaleof 26 items spread among a reduced set of five dimensions which emerged from theseprocedures.The five dimensions were: tangibles, reliability, responsiveness, assurance andempathy. Tangibles represent the physical facilities, equipment and appearance ofpersonnel. Reliability refers to the ability to perform the promised service dependablyand accurately. Responsiveness is the willingness-to-help users and provide promptattention. Assurance indicates courteous and knowledgeable employees who conveytrust and confidence. The empathy dimension includes offering caring, individualizedattention to users. The first three of these dimensions were retained from the original 10dimensions. However, the last two dimensions (assurance and empathy) contained itemsrepresenting the other seven original dimensions, because these seven dimensions did notremain distinct after empirical verification (Parasuraman et al., 1986).These dimensions emerged from an examination of four profit oriented services.Those responsible for developing them believe the dimensions to be generalizable acrossa wide variety of service industries (Parasuraman et al.,1988). MacKay (1987) testedthese five dimensions in four different types of recreation programs offered by municipalrecreation departments in the metropolitan area of Halifax, Nova Scotia. She concludedthat these five dimensions were valid measures of recreation program quality, but thattheir relative importance varied across activities. For example, respondents participatingin facility intensive activities (e.g. ice-hockey) put more importance on those itemsrelated to reliability and tangibles, while those involved in personal intensive serviceactivities (e.g. recreation classes) considered the reliability, responsive, assurance andempathy dimensions to be more important than tangibles. In all cases, the dimension ofreliability was considered to be the most important.2. The research questionsIn testing the utility of these discussions in a park context, it was anticipated that thetangibles and reliability items would be of most importance to park visitors because oftheir reliance on the setting itself and the facilities available for an enjoyable experience,rather than on service from staff persons.The specific research questions explored were:1. Can the dimensions of service quality reported by Parasuraman et al. be usefullyadapted to the context of park settings?2. Are there differences in perceived service quality between:(a) Frequent, occasional, and new users?(b) Users with different longevity of experience with a park?(c) Users of different parks?3. Which service quality dimensions are most important in a park setting?4. Does the importance of service quality dimensions vary according to:(a) Frequent, occasional, and new users?(b) Users with different longevity of experience with a park?(c) The park visited?
214Service quality in a park context3. Development of the survey instrumentItems that were thought to describe the domain o f each of the five dimensions werederived from a review of the service quality literature and from participants in a series offocus groups. The 128 items were incorporated into a questionnaire and a minimum of20 items were associated with each domain. All items were phrased positively. Anasymmetrical seven-point scale was used, with 3 being the neutral point; two levels ofdisagreement, and four levels of agreement. The asymmetrical scale was adopted in aneffort to increase variability since it was recognized that most respondents were likely togive positive responses. An additional option of " d o n ' t know or does not apply" wasincluded.The new instrument was pre-tested in a heavily-visited day-use state park whichoffered indoor and outdoor group use facilities, areas for picnicking, historical displays,interpretive areas, films in the visitors center and trails for walking. The park was locatedwithin a 1-hour drive of a major metropolitan city.Three criteria were used to reduce the 128 items to a more manageable set using thepre-test data. First, the frequency distribution for each item was checked for varianceand distribution o f responses. If more than 50% of the respondents chose either theneutral or "does not apply" response, the item was considered not to be relevant and waseliminated. Second, items which showed very little variance among respondents wereconsidered to generate minimum information, and so they were also eliminated. Third,items which correlated highly and were very close in meaning were checked forredundancy. Those which were judged by the researchers to contribute least todescribing the dimensionality of each domain were eliminated. By using these criteria,the final list was pared to 36 items which are shown in Table 1. The number of itemsassigned to each dimension were as follows: tangibles, 12; reliability, 7; responsiveness,7; assurance, 5; and empathy, 5.The final questionnaire consisted of four sections. The first section asked forfrequency of visits to the park; the number of years the respondent had been coming tothat particular park; reasons for visiting it; its quality compared to other parks; and anoverall quality rating for the park on a seven-point asymmetrical scale from extremelypoor to extremely good. Section two requested responses to the 36 item list of servicequality items. Ordering of the items was randomized. Respondents were asked theirperceptions of the park: "The following set of statements relate to your feelings aboutthis park. Please show the extent to which you believe this park has the features describedby the statements."Section three requested respondents to distribute 100 points among the five servicequality dimensions so they reflected the relative importance the respondent placed oneach dimension. The dimensions were operationally defined. Section four presented the36 service quality items ordered randomly again, but this time respondents were asked toexpress their desires: "The following set of statements relate to your feelings about parkslike this park. Please show the extent to which you believe this park should have thefeatures described by each statement."Questionnaires were distributed among visitors to five heavily visited day-use parksin Hennepin County, Minnesota and a further 250 were distributed among visitors tothree similar park sites in Texas during the summer and fall. Interviewers handedquestionnaires to individuals from different groups in the parks, gave a few minutes forthem to be completed, and then returned to collect them. The refusal rate was less than5% and 479 of the 500 questionnaires distributed were determined to be usable foranalysis.
J. A. Hamilton et aL215TABLE 1. Clusters derived by the VARCLUS procedureItemClusterA priori dimension1.2.3.4.5.6.7.8.9.10.11.12.Cluster 1 (responsiveness)Other programs in the park compatible with each othertStaff concerned about quality control#Staff communicates with visitorsVisible action taken when problems ariseNeeded information accessibleStaff responds to requests quicklyPark officials easy to reachReservations made speedily and easilyStaff willing to take time with visitorsStaff given individual attentionMade to feel welcomeStaff listen carefully to visitors' 14.15.16.17.18.19.20.21.22.Cluster 2 (reliability)Enough space for different activitiestEquipment available when neededEquipment works wellInformation is accurateWhat is promised is what is deliveredCommunications consistently clearChanges made in services/programs well publicizedPrograms/services at a convenient timeStaff trustworthyStaff perceive problems mpathy23.24.25.26.27.Cluster 3 (assurance)Programs/events start on time#Staff have a positive attitudeStaff act in a professional mannerSkill level of staff is highFeel safe in the park surance28.29.30.31.32.33.34.Cluster 4 (tangibles)Buildings in good repairNumber of water fountains adequateInsects not a problemRestrooms clean and well-maintainedEnough parking spaceEnough restroomsPark considered needs of lesTangiblesEmpathy35.36.Cluster 55Thorns and burrs not a problemTrash cans conveniently placedTangiblesTangibles- These items are not consistent with the definition of the dimension within which they were clustered bythe VARCLUS procedure. Cluster 5 could be reaggregated to form part of cluster 4.
216Service quality in a park context4. A n a l y s i sThe first research question was concerned with corroborating the existence of the fivedimensions suggested by Parasuraman et al. (1986) in the context of parks and assessingthe internal consistency of the items used to measure the dimensions. The raw data usedin the corroborating process and in computing coefficient alpha were in the form ofdifference scores. For each item, a difference score Q (representing perceived servicequality for that item) was defined as Q P - D , where P and D are the ratings on thecorresponding perception and desire statement, respectively. This procedure follows thatsuggested by Parasuraman et al. (1988) in their derivation of the original five qualitydimensions.The VARCLUS procedure was used on the Q scores of the total set of 36 items to testif they clustered into the five a priori defined dimensions. VARCLUS is a type of obliquecomponent analysis related to multiple factor analysis (Harman, 1976). The obliquerotation was considered appropriate because some degree of overlap among the fivedimensions was anticipated by the researchers who initially identified and labelled thedimensions (Parasuraman et al., 1985), and the oblique procedure allows for intercorrelations among the dimensions, facilitating easier interpretation.The VARCLUS clustering procedure is an iterative, hierarchical algorithm whichfirst groups all the items as a single cluster, then splits into two clusters, then three, andso on, until an optimum number is reached as defined by the criterion eigenvalue of 1.The procedure attempts to divide the items into non-overlapping clusters in such a waythat each cluster can be interpreted as essentially unidimensional. VARCLUS wasstopped when each cluster had only a single eigenvalue greater than one. Five clustersemerged based on this criterion. The items which comprised each cluster, together withthe a priori designation of each item, are listed in Table 1.Cluster 1 contains all of the seven items used to measure the responsivenessdimension and three of the five items used to measure the empathy dimension. Thedistinction between the Responsiveness and Empathy dimensions is narrow and thethree empathy items could reasonably be interpreted as a measure of "willingness-tohelp users and provide prompt attention," which was the definition of responsiveness.The remaining two empathy items appeared in different clusters. The VARCLUSprocedure, thus, suggested that Empathy is not an independent dimension and that thefirst cluster should be termed Responsiveness. The first two items in cluster 1 wereassigned a priori to the Tangibles and Reliability dimensions and appear to beaberrations in this cluster which do not obviously relate to the other 10 items. If thesetwo items are discarded, then 10 items remain as the measure of the Responsivenessdimension.Cluster 2 contains the remaining five of the six Reliability dimension items. Items 14and 15, equipment works well and equipment available when needed, were assigned tothe Tangibles dimension, but are consistent with the definition of Reliability, "the abilityto perform the promised service dependably and accurately." Similarly, the Assurancedimension item, staff are trustworthy, meets this definition. However, items 13 and 22appear to lack content validity for retention in this Reliability cluster and should bediscarded.Four of the five Assurance dimension items are incorporated in cluster 3. Item 23does not appear to reflect Assurance as it is defined here and should be discarded.The VARCLUS procedure, guided by the criterion of continuing to develop clustersas long as the eigenvalue of each cluster exceeded one, classified the remaining nine items
J. A. Hamiltonet aL217into two final dusters. However, eight of the nine items were a priori assigned to theTangibles dimension. Cluster 5 consists of only two items and they do not appear to bemeasuring a different dimension to the Tangibles items which comprise cluster 4. Forthis reason, cluster 5 should probably be reaggregated with cluster 4 to form one finalcluster which measures the Tangibles dimension.Coefficient alpha scores for the four revised clusters with the discarded items omittedwere 0.91, 0.91, 0.85, 0.84 for clusters 1, 2, 3 and 4, respectively. These coefficientssuggest a strong level of internal consistency among items within each dimension.The second research question addressed whether or not there were differences inperceived service quality based on frequency of use, longevity of experience with a park,or different parks visited. To operationalize frequency of use, respondents were assignedto one o f three groups: first visit to this park; visit it one or twice a year; or visit it everyfew months or more frequently. Longevity of experience was operationalized on thebasis of responses to the question, " F o r how many years have you been visiting thispark?" Respondents were assigned to three groups: less than one year, one to threeyears, or more than three years. The different parks variable consisted of the eightdifferent parks in which data were collected.Each respondent's Q scores for all the items in each of the four clusters (omitting thefive discarded items) were summed. On the basis of these summed scores, respondentswere assigned to one o f three cohorts comprised o f those reporting high, medium, or lowservice quality scores. This procedure was replicated for each of the four clusters. Thethree cohort levels of service quality were cross-tabulated with each o f the three levels offrequency use, three levels of longevity of experience, and the eight different parks atwhich data were collected.The chi-squares on the four frequency of use matrices and the four longevity ofexperience matrices revealed no significant levels of association (0.05 level). However,there was a strong significant relationship (0.001 level) between the levels of servicequality in each of the four dimensions and the eight different parks.The third research question was concerned with identifying which service qualitydimensions were most important in a park setting. Respondents were requested todistribute 100 points between the five original dimensions and advised, "The moreimportant you feel each feature to be, the more points you should give it." Eachdimension was specified and defined and the mean scores are shown in Table 2.The final research question investigated whether the importance o f service qualitydimensions varied according to frequency of use, longevity of experience with a park, ordifferent parks visited. These three variables were operationalized in the same way as inthe second research question. Similarly, respondents were assigned to one of the threecohort groups comprised of those ascribing high, medium, and low importance to adimension. The procedure was replicated for each of the five dimensions. The results aresummarized in Table 3.There were reasonably strong levels of association between level of importance ofeach of the service quality dimensions and the park visited. However, in the case of fourof the five dimensions there was no significant level of association between level ofimportance and either frequency o f use or longevity of experience. The exception was theTangibles dimension.5. DiscussionThe analyses suggest that the dimensions of service quality reported by Parasuramanet
218Service quality in a park contextTABLE2. Mean importance scores of the five service quality 0605050TABLE3. Results of Chi-Square Tests of Association between level of importance of each servicequality dimension and frequency of use, longevity of experience and park essAssuranceEmpathyBy park visitedBy frequency ofuseBy years ofexperiencewiththat 710.140.320.22al. (1988) may be usefully adapted to measure service quality in the context of parksettings. The major adaptation suggested was the merging of the Empathy dimensioninto the Responsiveness dimension. Empathy is defined as "offering caring individualized attention to users," while the definition of Responsiveness is "the willingness-tohelp users and provide prompt attention." The definitional difference between these twodimensions is small, and the analyses suggested that in the context of parks, it was toosmall to be meaningful. Hence, the results of this study suggest there appears to be littlevalue in retaining empathy as a distinctive dimension of service quality in parks,particularly since it was considered the least important of the five dimensions whenrespondents were asked to distribute 100 points between them.Interpretation of the VARCLUS procedure suggested that five of the original 36items used to measure the dimensions were not useful, but that the remaining 31 itemsdid effectively contribute to measuring the four dimensions that emerged.The chi-square analyses revealed significant levels of association between the level ofservice quality respondents perceived on each dimension and the particular park thatthey used. A park is an abstract idea subject to wide and varied interpretations, ratherthan a standardized physical object. Consequently, parks are inherently diverse andcharacterized by their heterogeneity rather than their homogeneity. The chi-squareanalyses confirmed this diversity by identifying substantial perceived differences in thelevel of service quality at individual parks. The results emphasize that service qualitystudies of parks should be park specific.The chi-square tests also showed a relationship between the level of importance thatrespondents attached to each dimension and the specific park which was visited. Thisresult reinforced the conclusion that service quality studies of parks should be parkspecific. In natural parks, where visitors may have no opportunity or inclination to
J. A. Hamilton et aL219interact with agency staff, then dimensions such as responsiveness and empathy are notlikely to be perceived as being important, and tangibles are likely to be of supremeimportance. In parks where such staff interaction is desired, then the perceivedimportance of the dimensions is likely to be more balanced.These results, clearly implying that service quality studies of parks should be parkspecific, suggest the following conundrum: How can the study's contribution begeneralizable, when considerable differences in results between parks are inevitable? Thepioneering work in service quality on which this study was based was done byParasuraman, et al. (1988) who state that their SERVQUAL instrument:"has been designed to be applicable across a broad spectrum of services. As such, it provides abasic "skeleton" through its desires/perceptions format encompassing statements for each ofthe five service quality dimensions. The skeleton, when necessary, can be adapted orsupplemented to fit the characteristics or specific research needs of a particular organization."Their statement may be adapted to the context of parks. The study reported here hasdemonstrated that the concept of service quality and the methodology used to measure itare generalizable across a broad spectrum of parks. Four of the five dimensionsidentified by Parasuraman et al. (1987) appear to be evident in a parks setting. As such,the items provided offer a skeleton, core set, likely to be a useful point of departure forpark specific studies. However, these will need to be adapted or supplemented to fit thecharacteristics of a particular park site. As further uses of these items and dimensions arereported, the extent of the adaptations needed to particularize it to a specific park willbecome more apparent.The reported importance rankings of the five dimensions emphasized the need toadapt service quality instruments to particular service contexts, rather than to acceptthem as being generally applicable. Leisure services can be classified along a continuumaccording to the relative importance of people and facilities in their delivery (MacKayand Crompton, 1988). Many recreation services, for example instructional programs,require a relatively high level of direct interaction with staff in service delivery, and thetangible features of the resource are of relatively low importance. However, parks are atthe opposite end of the continuum. In the case of park services, staff contributions tendto be indirect through maintaining or improving the quality of the resource, rather thanthrough direct involvement with park users. The dominant ranking of tangibles reflectsrecognition that service quality in parks is predominantly a function of the physicalresource.Reliability ranked second in importance. Its relatively high ranking is consistent withfindings reported in other service areas. Parasuraman et al. (1988) investigating privatesector services reported that reliability consistently emerged as the most importantdimension in service quality, and MacKay (1987) reported similar findings in the contextof the four recreation programs that she investigated. The least important dimensionwas Empathy and this reflects the lack of opportunity in a park context, and perhaps alack of desire by some park users, for staff "to give caring individualized attention toparticipants."Since the success of a park agency is dependent upon the quality of the participants'experiences, it is imperative for park providers to know how their visitors define servicequality and to develop instruments which enable them to evaluate how well they areproviding it. The results reported in this paper contribute towards these ends. The 31item instrument which emerged provides a point of departure which will allow parkmanagers to evaluate how visitors perceive the quality of their services and how it differsfrom what they desire. By using this type of objective measure, park managers can
Service quality in a park context220ascertain not only what is important to their visitors, but also where improvements areneeded. Repeated measures over time can establish a base line and can assist in trackingprogress as well as identifying changes and trends in visitors' desires.A limitation of the study reported here was that it did not include those who hadceased to use a particular park, and it is reasonable to hypothesiz
using data collected from 1000 respondents, were undertaken to develop a refined scale of 26 items spread among a reduced set of five dimensions which emerged from these . quality dimensions so they reflected the relative importance the respondent placed on each dimension. The dimensions were operationally defined. Section four presented the