Transcription
Thomas PikettystCapital in the 21 CenturyProgram on the Study of CapitalismMarch 6, 2015Stephen Marglin
A classic in economics is a book to which everybody alludes but nobody reads.
Piketty’s Capital in the 21st Century is right up there with Smith’s Wealth of Nations and Keynes’s General Theory
Hawking Index (HI)Jordan EllenbergTake the page numbers of a book's five top highlights, average them, anddivide by the number of pages in the whole book. The higher the number,the more of the book we're guessing most people are likely to have read."A Brief History of Time" by Stephen Hawking: 6.6%"Capital in the Twenty-First Century" by Thomas Piketty : 2.4%Mr. Piketty's book is almost 700 pages long, and the last of the top fivepopular highlights appears on page 26. Stephen Hawking is off the hook;from now on, this measure should be known as the Piketty -unread-book-is-1404417569
Piketty’s Principal Policy Recommendation—a Progressive Wealth Tax—Is Largely Independent of the Analysis in Capital
Piketty’s Fundamental Contradiction of CapitalismgY r
When the rate of return on capital exceeds the rate of growth of output and income, capitalism automatically generates arbitrary and unsustainable inequalities that radicallyundermine the meritocratic values on which democratic societies are based. (p 1)When the rate of return on capital significantly exceeds the growth rate of the economy , thenit logically follows that inherited wealth grows faster than output and income. People withinherited wealth need save only a portion of their income from capital to see that capital growmore quickly than the economy as a whole. (p 26)The Central Contradiction of Capitalism The inequality r g implies that wealth accumulated in the past grows more rapidly than outputand wages. This inequality expresses a fundamental logical contradiction. The entrepreneurinevitably tends to become a rentier, more and more dominant over those who own nothingbut their labor. Once constituted, capital reproduces itself faster than output increases. Thepast devours the future. (p 571)
Piketty’s Laws are Laws of Arithmetic
Piketty’s Arithmetic Laws122 (restated)2′sgKα rββ rK K rYY KKY KYKβ′ sgY K KY Y YYβ’ β’βgK KK K Yg gKYIf lim β′ exists, then lim β lim β′t t t 2′ (restated) sβ K KrYYK rKYY srα3gK r s αgY YY sβ′ sr βα β′ KY K Y K r K rKY KYY Y3’gY r sβ αβ′
1Capital Share Rate of Return on Capital x Capital:Output Ratioα rβrK K rYY
2Capital:Output Ratio Rate ofSaving/Growth Rate of CapitalStockβ 2′Incremental Capital:Output Ratio Rate of Saving/Growth Rate ofOutputsgKβ′ KKY KYKsgY K KY Y YY Kβ’ YIf lim β′ exists, then lim β lim β′t t t β’ gK β gY
3’gY r sβ αβ′Piketty’s Fundamental Contradiction of CapitalismgY r
Piketty’s originality, perseverance, and meticulousness with respect to the datacontrast sharply with a very cavalier attitude towards theory.Indeed, a plausible theory ofgrowth and distribution istotally absent.
Why does β rise or fall over time?
According to the Harrod-Domar-Solow formula, in the long run thewealth-income ratio β is equal to the net saving rate s divided by theincome growth rate g. So for a given saving rate s 10%, the longrun β is about 300% if g 3% and about 600% if g 1.5%. In short:capital is back because low growth is back (p 2)According to the one-good capital accumulation model and theHarrod-Domar-Solow formula β s/g, the two key forces drivingwealth-income ratios are the saving rate s and the income growthrate g. (p 20)(Piketty and Gabriel Zucman, “Capital is Back: Wealth-Income Ratiosin Rich Countries 1700-2010,” [working paper version])
2 (restated)Growth Rate of Capital Stock Saving Rate/Captial:OutputRatiogK KK sβ K KrY YKrKYY srα3Rate of Return on Capital ExceedsGrowth Rate of Capital Stock Capital Share Exceeds Rate ofSavinggK r s α2’ (restated)Growth Rate of Output SavingRate/Incremental Capital:Output RatiogY YY sβ′ KY K Y sr βα β′ K r KY YrK KY Y3′Rate of Return on CapitalExceeds Growth Rate of Output Capital ShareExceeds Rate of SavingMultiplied by Ratio β/β′βgY r s αβ′
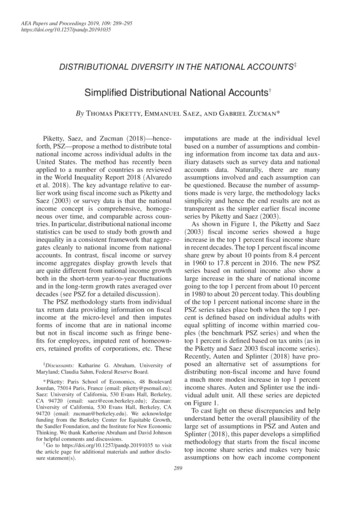
A Two-Class Model of r and gK with Rentiers Disposed to Save More than the Middle Class (sC sW)Fixed β (no substitution between capital and labor)The heavy black line labeled gK s(r)represents the relationship between therate of return and the rate of growth for asimple two-class model with rentiers whosave the fraction sC of their income(entirely from capital) and a “middle class”which saves a lower fraction sW of theirincome (salaries and capital income).Associated with each point is an overallsaving rate s and a capital share α.Each point on the schedule gK s(r)corresponds to an equilibrium level of α;there is no endogenous mechanism toincrease (or decrease) α that flows fromthe inequality r gKr gKrgK sC rgK sW/βδ 1r gKr gK0 δ 1gK s(r)sW s α, δ 0sW s αδ 0gKKW middle class capital; KC rentier capital; sW middle-class propensity to save; sC rentier capital; δ rentier share of capital
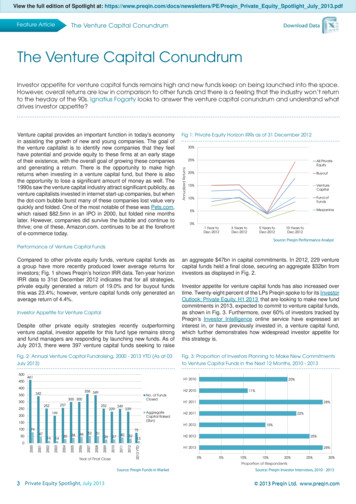
A Two-Class Model of r and gK with Rentiers Disposed to Save More than the Middle Class (sC sW)r gKrgK sW/βgK sC rδ 1The “central contradiction” is neither centralnor a contradiction. [Piketty referred to it asa marketing ploy ] Along the purple portionof gK s(r), the inequality r gK holds, butmiddle class capital grows as rapidly asrentier capital, as do output and wages.Along the vertical portion of the schedulethe middle class ends up owning all but a s s α,Wvanishing share of the capital stock.r gK0 δ 1δ 0gK s(r)The Central Contradiction of CapitalismThe inequality r g implies that wealth accumulated in the pastgrows more rapidly than output and wages.gKKW middle class capital; KC rentier capital; sW middle-class propensity to save; sC rentier capital; δ rentier share of capital
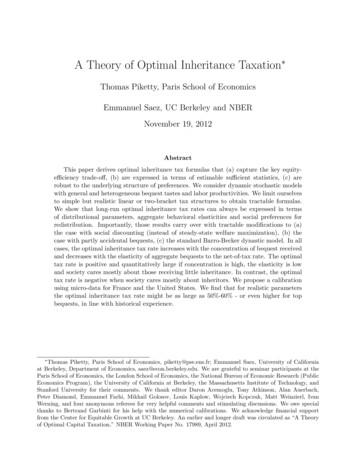
A Two-Class Model of r and gK with Rentiers Disposed to Save More than the Middle Class (sC sW)Elasticity of Substitution of Capital for Labor 1The gK s(r) schedule changes if, asPiketty believes is the case, theelasticity of substitution of capitalfor labor (σ) exceeds 1. If therewere a mechanism for driving αdown over time--r gK is not such amechanism—then under Piketty’sassumption about σ the economywould move relentlessly down thegK s(r) schedule and rentierswould end up owning all thecapital. Maybe there is such amechanism, but Piketty has notarticulated it. That’s what I meanby the theory being cavalier (poorword choice). By the way, most ofthe empirical evidence suggests σ 1, but I’m a consumer of thisliterature not a producer.Bottom Line: the relationshipbetween β, r, and g at bestprovides one piece of thenecessary theory. It is analogousto having a theory of price withonly a demand curve or a supplycurve.r gKrr gKsW s αgK sW/βδ 1gK sC rsW s αr gK0 δ 1The Central Contradiction of CapitalismThe inequality r g implies that wealth accumulated in the pastgrows more rapidly than output and wages.gKKW middle class capital; KC rentier capital; sW middle-class propensity to save; sC rentier capital; δ rentier share of capital
Why does α tend to rise more than s?
There are many uses for capital over the very long run, and this fact can be captured by notingthat the long-run elasticity of substitution of capital for labor [σ] is probably greater than one.The most likely outcome is thus that the decrease in the rate of return [r] will be smaller thanthe increase in the capital/income ratio [β], so that capital’s share [α rβ] will increase. (Capitalin the 21st Century, p 233)
Are we interested in physical (“real”) or value (“nominal”) ratios?
Piketty’s “laws” will hold in either case—because they are tautologies.
The charts in Capital in the 21st Century reflect nominal values but in theorizing about both thepast and the future—how we got to where we are and where we might be going from here—economists normally (rightly in my view) use physical values
What happens when the relative prices of output and capital change?
Capital:Output Ratio and Stock-Market:GDP Ratio 0019101920193019401950Piketty Measure of Capital:Output Ratio TS4.5196019701980199020002010Ratio S&P 500 Index to GDP Index (right axis)
Capital:Output Ratio and Stock-Market:GDP Ratio ty Measure of Capital:Output Ratio TS4.5Jan-60Jan-70Jan-80Jan-90Jan-00Jan-10Ratio of Share Prices to GDP (right axis)
Capital:Output Ratio and Stock-Market:GDP Ratio (UK)10101Log Scales10.1Piketty Measure of Capital:Output Ratio TS4.5Ratio of FTSE to GDP (Right Axis)Ratio of Share Prices to GDP (Right Axis)
What happens when the physical composition of output changes?
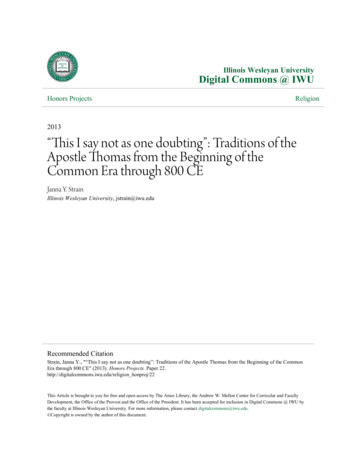
Housing andhealth caretogether wentfrom less than10% of theeconomy at theend of WW II toalmost 25%today. Thecapital:outputratio for housingservices is clearlyhigher than forother sectors ofthe economy. Idon’t knowabout healthcare. Changes incomposition ofoutput can havelarge effects on βwithout makingthe rich richer.Housing and Health Care Expenditures in Relation to 91969Housing / GDP19791989Health Care / GDP19992009
Do the numbers jibe?
Growth and Distribution in France, 1820-1910 (p 352)Graphique 10.7. Rendement du capital et croissance: France 1820-1913Taux de rendement ou taux de croissance annuels7%6%5%4%Taux de rendement pur du capital r3%Taux de croissance du revenu national : le taux de rendement du capital est nettement plus élevé que le taux de croisance en France de 1820 à 1913.Sources et séries: voir piketty.pse.ens.fr/capital21c.1910
Growth and Distribution in France, 1820-1910 (p 352)Graphique 10.8. Part du capital et taux d'épargne: France 1820-1913Part du capital ou taux d'épargne (% du revenu national)50%40%30%Part du capital α20%Taux d'épargne s10%0%182018301840185018601870188018901900Lecture: la part des revenus du capital dans le revenu national est nettement plus élevé que le taux d'épargne enFrance de 1820 à 1913. Sources et séries: voir piketty.pse.ens.fr/capital21c.1910
Growth and Distribution in France, 1820-1910Averagess .10α .35gY .01r .05In 1820-1830s .10α .35 r .05In 1820-1830:gK .014β 7β′ sr / g 1.4βα YSource: Capital in the 21st Century, Figures 10.7, 10.8 (p 352)
More Arithmetic LawsΔββ Δtβ s gY βsβ gYsβ0 gYe gY t
Observe the predicted risefrom β 7 to β 8.78 over thecourse of 90 years. Piketty’sdata say β remained constantover this period.Capital, Output, and the Capital:Output Ratio,With β ₁₈₂₀ 217.007.297.541.001.111.2213.4911.9210.5015.22s 12.232.460.00gY .011820183018401850K/Y18701860Y1880K189019001910
Capital:Output Ratio in France (p 117)Graphique 3.2. Le capital en France, 1700-2010800%700%Valeur du capital national, en % du revenu nationalCapital étranger netAutre capital intérieur600%LogementsTerres 01880191019201950197019902000Lecture: le capital national vaut près de 7 années de revenu national en France en 1910 (dont une placée àl'étranger). Sources et séries: voir piketty.pse.ens.fr/capital21c.2010
Growth and Distribution in Britain, 1820-1910p 200
Growth and Distribution in Rich Countries,1975-2010p 222
Capital in the 21st Century Program on the Study of Capitalism March 6, 2015 Stephen Marglin. . "Capital in the Twenty-First Century" by Thomas Piketty : 2.4% Mr. Piketty's book is almost 700 pages long, and the last of the top five popular highlights appears on page 26. Stephen Hawking is off the hook;