Transcription
Low-cost and Traditional Airlines:Ratio Analysis and Equity Valuation by the Residual Earnings ModelMaster ThesisSpring Semester 2007Supervisor:Stefan SundgrenAuthor:Saijai Hanpobamorn
ACKNOWLEDGEMENTFirstly, I would like to express my gratitude to Umeå University and the teacher team forproviding me the valuable knowledge in a peaceful environment.I deeply thank my supervisor Professor Stefan Sundgren, who kindly supervises and gives me theexcellent suggestion, guidance, and encouragement all the times during my thesis writing. Icannot complete this thesis without his consistent advice.I appreciate any help of the staffs at student office and at library during my study in theuniversity.I also appreciate the Company’s management I have been working for giving me an opportunityto continue my study abroad. I also thank all my friends who always being beside and encourageme.Lastly, the special thanks go to my family for your unconditional support continuously inwhatever I do, and wherever I stay.Umeå25 May 2007ii
ABSTRACTFundamental analysts use basic fundamentals, which generally based on available publicinformation, to determine a firm’s intrinsic value. Forecasting future performance is one of thekey elements for doing fundamental analysis, and historical results are the foundation for futureforecast.The analysis of this study is conducted into two sections with case studies in the airline business.Firstly, financial ratios are analyzed to examine whether low-cost or traditional airlines betterperform their operations during a certain period. The other section is undertaking fundamentalanalysis of the case studies to evaluate current stock prices of representative airlines based on thepotential future forecast. The model using for this valuation is the Residual Earnings Model. Keyassumptions of future forecasts are mainly based on their historical ratios. Other related factorsuch as the gross domestic product (GDP) is included in forecasting sales growth rate because itis one of the key influences in the airline business.For ratio analysis, the findings suggest that low-cost airlines perform better operations based onfive years average. However, the traditional airlines improve their performances significantly inthe latest fiscal year. For equity valuation, the findings show that estimates of equity values of theairlines yield inconsistent results comparing to their stock prices. Possible reasons of thedifference might be the improvement in key financial ratios of the airlines.Key words: Fundamental analysis, ratio analysis, equity valuation, residual earnings, airlineindustry, low-cost airline, traditional airlineiii
Chapter 11.11.21.31.41.51.61.7IntroductionProblem Background . . 4Research Questions . . 5Purpose of Study . . 5Perspective . . 5Delimitations . . 6Preconceptions . . 6Disposition . . 7Chapter 22.12.22.32.42.5Research MethodologyChoice of subject . . 8Research Philosophy . 8Research Approach . . 8Research Method . . 9Data collection . . 9Chapter 33.13.2Theoretical FrameworkMarket Efficiency . . 11Investment Strategy . . . 133.2.1 Active and Passive Strategies . . 14Financial Statement Analysis . 143.3.1 Strategy Analysis . . . 153.3.2 Accounting Analysis . . 153.3.3 Financial Analysis . .163.3.3.1 Ratio Analysis . . 163.3.4 Prospective Analysis: Forecasting . 203.3.5 Prospective Analysis: Valuation Analysis . 203.3.5.1 Residual Earnings Model . . .223.3.5.2 Residual Earnings Model and DividendDiscount Model . . 243.3.5.3 Disadvantage of Residual Earnings Model . . 243.3.6 From Ratio Analysis to Equity Valuation . .25Empirical Evidence . . 263.33.4Chapter 44.14.24.34.4Literature Review of the Airline IndustryIndustry Overview . 28Competitive Issues . . 304.2.1 Deregulation . . .304.2.2 Cost Operation . . . 314.2.3 Loyalty Schemes . . 33Financial Performance . . . 34Future Growth . . 38Chapter 55.15.25.3Analysis and ResultsAirline Overview . . . 43Strategy Analysis . . . 46Accounting Analysis . . 471
5.45.5Analysis and Results: Ratio Analysis . . 48Equity Valuation . . 595.5.1 Key Assumptions of Forecasting . . 595.5.2 Analysis and Results: Equity Valuation . . 61Chapter 66.16.26.36.4Discussion and ConclusionsConclusion on Ratio Analysis 63Conclusion on Equity Valuation 63Recommendations for further Researches . 63Reliability, Validity and Degree of Generalization . 64References . 65List of FiguresFigure 1:Information Relationship of Weak-form, Semistrong-form andand Strong-form . 12Figure 2:Sustainable Growth Rate Framework 17Figure 3:Growth in World Passengers Carried During 1990-2006 . 28Figure 4:Great Opportunities for Low-cost Airlines in Asia . . 31Figure 5:Unit Cost per Available Seat Mile of the U.S. Low-cost andTraditional (Legacy) Airlines 1998-2004 . 32Figure 6:ROIC and Cost of Capital of the Representative Airlines 1996-2004 . 35Figure 7:Different ROIC in the Aviation Industry in 2004 . 36Figure 8:International Passenger Growth and Global GDP Growth 1995-2010 .39Figure 9:World Air Traffic 2005 VS 2025 . . 39Figure 10:Airline Revenue Growth & Global Economic GrowthDuring 1996-2008 . 40Figure 11:Operating Profit and Net Profitability/Losses During 1998-2008 . 40Figure 12:Forecasting GDP Growth and Real Consumer SpendingGrowth 2005-2010 . 41Figure 13:Comparison of Operating ROA 2002- 2006 . 49Figure 14:Comparison of NOPAT Margin 2002-2006 . 50Figure 15:Comparison of Operating Asset Turnover 2002-2006 . 53Figure 16:Comparison of Spread 2002-2006 . 54Figure 17:Comparison of Net Financial Leverage 2002-2006 . . 55Figure 18:Comparison of ROE 2002-2006 56Figure 19:Comparison of Sustainable Growth Rate 2002-2006 572
List of TablesTable 1:Traditional Airlines and their related Low-cost Airlines . . 29Table 2:Key Features of Low-cost Airlines and Traditional Airlines . 30Table 3:20 Most Profitable Airlines in 2005 .37Table 4:20 Most Heaviest Losses Airlines in 2005 38Table 5:Aircraft Fleet of the Airlines in 2006 . 48Table 6:Operating ROA 2006 VS 5 Years Average (2002-2006) . 49Table 7:NOPAT Margin 2006 VS of 5 Years Average (2002-2006) . 50Table 8:Unit Cost of European Airlines within European Markets in 2005. 51Table 9:Unit Cost of U.S. Airlines in Domestic Markets in 2005 . 52Table 10:Operating Asset Turnover 2006 VS 5 Years Average (2002-2006) . 53Table 11:Spread 2006 VS 5 Years Average (2002-2006) .54Table 12:Net Financial Leverage 2006 VS 5 Years Average (2002-2006) . 55Table 13:Return on Equity 2006 VS 5 Years Average (2002-2006) 56Table 14:Sustainable Growth Rate of 5 Years Average (2002-2006) VS 2006 . 57Table 15:Comparison of Key Financial Ratios of 5 Years Average . 58Table 16:Comparison of Key Financial Ratios of 2006 58Table 17:Trading Stock Exchange and Currency of Representative Airlines . 60Table 18:Key Assumptions of Representative Airlines 61Table 19:Comparison of Equity Value Per Share and Trading Price . 623
Chapter 11.1IntroductionProblem BackgroundFundamental analysis or intrinsic value analysis uses financial and other economic information todetermine the firm’s value. Analysts use basic fundamentals, which generally based on publiclyavailable information, such as accounting earnings, dividends, growth factors or leverage ratios,etc. to infer the intrinsic value and compare whether it is over or under the firm’s stock price(Lee, 1987).Fundamental analysis in accounting researches mostly has been done in cross-sectional approach.The study tended to investigate large firms in various industries, which are problematic and not inline with the investment analysts who likely focus on one industry or one sector (Quirin et al.,2000). In addition, each industry has typical characteristics, for instance accounting methods,nature of expenses or tax features, etc. There are not many researches performed on industrybased analysis. Examples of industry-based study include the analysis of U.S. oil and gasindustry (Quirin et al., 2000) and the analysis of the U.S. airline industry (Behn and Riley, 1999),etc.Forecast of future payoff is the most important process of fundamental analysis because it isconsidered as one of the key elements to determine the firm’s value. According to Palepu et al.(2000), ratio analysis of past operating behavior could be the foundation of future forecast.Possible and reliable assumptions are the key concerns when performing the forecast, whichdeals with uncertainty in the future.To determining the firm’s value, there are several valuation models to be employed such as assetbased valuation model, discounted cash flow model and abnormal earnings (residual earnings)model (White et al., 1998). The Residual Earnings Model is the accounting-based approach,using accounting variables to define the equity value. From the linear relations of the model, it isimplied that the stock price of the firm relates to current book value, current earnings and futureearnings. Unlike other models that tend to connect future earnings with cash flow or relate todividend policies, this model is based on clean surplus relation instead. However, only cleansurplus is not sufficient for residual earnings valuation. The most important linkage betweenaccounting numbers and the future residual earnings is fundamental analysis or informationdynamics mentioned by Ohlson (1995). Since Ohlson (1995) proposed the model, there arenumbers of empirical study validate the model as well as compare it against the discount cashflow and dividend discount model. Due to deriving from the same assumption, the residualearnings model yields identical results as the discounted cash flow and dividend discount models(Ohlson, 1995, and Feltham and Ohlson, 1995).Dechow et al. (1999) performed the empirical assessment on the Ohlson (1995) model and theresult of the study supported the model. The study provided explanation of use of simpleaccounting variables to predict abnormal earnings, current price and future stock returns (Beaver,1999). On the other hand, Myers (1999) discouraged the Ohlson (1995) model according tofailure presenting true stochastic relationship of accounting numbers.4
Fundamental analysts use fundamental analysis to define the firm’s intrinsic value and this valueshould represent in the firm’s stock price. But, according to the market efficiency under semistrong form hypothesis, which generally appears in most stock markets, the stock prices reflectall available public information and fundamental analysis is not useful.In September 2001, the airline industry was attacked by the tragedy event and consequently,affected to the airlines’ financial performances. Some traditional airlines, especially the U.S. flagairlines, had a big lost from the tragedy and have taken years to recover the financial status.However, some of U.S. and European low-cost airlines have grown in profitability and new lowcost airlines have continued entering to the industry. According to the interesting contradiction,the study tends to focus on financial ratios and equity values of low-cost and traditional airlinesafter the 9/11 crisis.This study mainly discusses in two connecting parts. The first section performs a part offundamental analysis, ratio analysis, in the industry-based. Ratio analysis is undertaken in theairline industry by comparing the key financial ratios among low-cost and traditional airlines fora certain periods. Three low-cost and three traditional airlines are selected as the case study. Thesecond section examines equity values of the same airlines by using the residual earnings modelaccompanied by the forecast of accounting variables based on historical performances to comparewith the stock prices of those airlines.1.2Research Questions 1.3Based on the ratio analysis, do low-cost airlines perform better financial results thantraditional airlines?Based on the residual earnings model, how do estimates of equity values of therepresentative airlines illustrate, comparing to their current stock prices?Purpose of StudyThe purpose of this study is to analyze the financial ratios of representative low-cost airlines andtraditional airlines to examine how different between their operating performances.This study also uses the same case studies to conduct fundamental analysis. The purpose is toillustrate the process of doing fundamental analysis and attempt to evaluate current stock pricesof representative airlines based on the potential future forecast. The valuation model using forestimate equity values of the airlines is the Residual Earnings Model.1.4PerspectiveThe perspective on this study is considered in an investor’s view. Low-cost airlines have becomethe new trend of global air transportation in the last decade and continued growing both innumber of carriers and travelers. Traditional airlines may lose their market shares to the fiercecompetition, and cannot maintain the growth in the long run.The result of this study, based on number of case studies selected, shows the actual performanceof both low-cost and traditional airlines to compare how well they perform their operations5
during current years. In addition, how the equity values of low-cost and traditional airlines wouldbe illustrated, comparing to their stock prices.1.5DelimitationsThis case study research is limited to six airlines, which their stocks are traded on the U.S. orEuropean stock exchanges. For the comparable purpose, the selected airlines present theirfinancial statements according to the IFRS (International Financial Reporting Standards) or theU.S. GAAP (Generally Accepted Accounting Principles in the United States). The data collectionis discussed in Chapter 2.For time period, the calculations are based on the airlines’ annual reports published onlinecovered the years from 1996 to 2006.1.6PreconceptionsPreconception is an idea form in advance of enough knowledge and may lead to bias judgement.People hold individual preconceptions, according to personal background, personal experiences,or prestudy beliefs, so individual preconceptions may have an impact on scientific researches.Even though the author of this thesis has background on finance and accounting areas, theindividual preconceptions would not influence the outcome of the study. This reason is thatinterpretation and analysis of case study are based on real figures, which is free of conflict ofinterest, or preconceptions of individual analyst.6
1.7DispositionChapter1TitleIntroduction2Research Methodology3Theoretical Framework4Literature Review of theAirline IndustryAnalysis and Results56Discussion andConclusionContentsThe introductory chapter discusses aboutproblem background as well as purpose of thestudy.This chapter presents the research methodsusing in the empirical study, including thecollection of data.This chapter presents theoretical frameworkrelating to this study, including relatedprevious researches.This chapter provides grounded information ofthe airline industry and its future.This chapter presents analysis of outcomesbased on the given theoretical framework.The final chapter concludes the findings andsuggests further researches to be conducted inthe future.7
Chapter 2Research MethodologyThis chapter describes the methodology using for the study. The chapter organizes as choice ofsubject, research philosophy, research approach, research method, and data collection.2.1Choice of SubjectFinding the topic for master thesis is not an easy task. The topic should be matched to aresearcher’s interest, academic knowledge, working background or career goal. Within thelimited time of the course, the researcher needs to have a well plan for the achievable topic.I have been working in an airline company and have an academic background in accounting area.Air transportation is considered as a key element in travel industry and there is one-ninth laborforce in the global working in this industry (Hanlon, 2007). The industry is more sensitive tovariable effects than others, for example; fuel prices, economy recession, traveling season,weather, war or terrorists, which is the most concern nowadays. I also invest some of my moneyin a stock market and have questions why some stocks look expensive and what is the true valueof those stocks. Therefore, I refine my ideas with working and studying experiences to a topicrelating to the airline industry combining with theories of fundamental analysis.2.2Research PhilosophyResearch philosophy depends on what the author want to develop the knowledge (Saunders et al.,2000). Understanding of the research philosophy is important to research methodology,according to the following reasons (Easterby-Smith et al., 1997; cited by Crossan, 2003):- Help the author to clarify the research strategy and the research method.- Help the author to avoid useless works with clarification of certain methods at the earlystage.- Help the author to select or adapt the methods, which previously are out of the experience.Using theories of ratio analysis and Residual Earnings Model for empirical tests on low-cost andtraditional airlines can imply that the study lies on positivism philosophy.Positivism deals with scientific knowledge, which is measurable. Positivism philosophy of thestudy is the work concerning the observable social reality and the results can be considered asthose produced by the physical and natural scientists (Remenyi et al., 1998:32; cited by Saunderset al., 2000).2.3Research ApproachBasically, there are two broad research approaches: deductive and inductive. Deductive or topdown approach begins with the interesting theory and works through observations to find theresults, which do or do not align with the hypotheses. In contrast, inductive or bottom upapproach works from particular observations, which are more open-ended, to develop a newtheory (Trochim, 2006).8
Deductive approach emphasizes scientific principle and concentrates on quantitative and validdata to explain causal relationship between variables while inductive approach considers themeaning of human relating to events with a close understand of the research context, involvesqualitative data and less concerns with the need to generalize (Saunders et al., 2000).When applied to this study, from the theories and move to testing of quantitative data to find outthe results that can prove hypothesis, the deductive approach is compatible for the research.2.4Research MethodQualitative or quantitative methods are choices for analysis of a study, depending upon theresearch objective. Data collection is one of the differences to categorize qualitative andquantitative methods. It is simply to say that qualitative data contains words while quantitativedata contains numbers. Rather than the data, the other difference is assumption of the research.Qualitative method deals with exploratory and inductive approach while quantitative methodinvolves confirmatory and deductive approach (Trochim, 2006).List (2006) addresses some useful conditions to differentiate qualitative and quantitativemethods. Qualitative method’s conditions are non-existing topic research, uncertainty of themeasurement, non-clear assessment concept and exploring of something. On the other hand,quantitative method’s conditions are confirmatory research topic, trend measurement, clearassessment concept and using of ratio or ordinary scale.To answer the research questions of the study, data gathering mostly deals with numbers, andanalysis sections are based on the existing theories. Therefore, according to conditions above, itcan say that quantitative method is used for this paper. The case study is applied for the research.According to Yin (1989), the unique strength of case study is its ability to deal with various kindsof evidence, and the case study is preferred investigating contemporary events of which therelating behaviors cannot be manipulated.2.5Data CollectionSelection of the case study starts at what regions of the airline industry are chosen. Europe andthe U.S. are the results of the selection because the European and the U.S. air transport marketsare mature. There are numbers of low-cost and traditional airlines operated for certain periods,and their stocks trade on the markets. For other regions in the global, low-cost markets have juststarted and even though there are number of operating low-cost airlines, the airlines’ own toentrepreneurs and seldom traded on the stock markets. In addition, for comparable purpose, theEuropean and the U.S. financial reports are compatible in term of accounting methods.The case study limits to six airlines due to time constrain of the study period. The six airlines,dividing into two groups: low-cost and traditional airlines, are selected based on the profitabilityand passengers traffics, according to the statistical numbers shown in the book “Global Airlines”(Hanlon, 2007). Two low-cost and two traditional airlines selected operate in Europe while onelow-cost and one traditional airline selected operates in the U.S. Details of the case study selectedare summarized below.9
TypeTraditional AirlineTraditional AirlineTraditional AirlineLow-cost AirlineLow-cost AirlineLow-cost AirlineAirlineBritish AirwaysContinental AirlinesLufthansaEasyJetJetBlue AirwaysRyanairHeadquarter BasedEuropeThe United StatesEuropeEuropeThe United StatesEuropeFor sources of evidence, Yin (1989) categorized six sources for data collection of the case studiesas documentation, archival records, interviews, direct observations, participant-observation, andphysical artifacts. Multiple sources of data are considered to this study, which consist ofdocumentation and archival records. The documentary information includes related books andarticles while the archival records include service records, organizational records, maps andcharts, survey data, etc.All books and articles relating to accounting and financial theories, including literatures of theairline industry are available on the internet, and at the Umeå University’s library as well as thelibrary’s database.The financial information of six airlines are extracted from the annual reports of individual airlinepublished on the airline’s website from the year 1996 to 2006, which the length of years varieddepending on individual airline. Additional financial data and the stock prices are taken fromseveral websites, i.e. yahoo finance, MSN money, advfn, Reuters and google finance. Statisticalfinancial data, i.e. risk-free rate or market returns, is gathered from Datastream Advance.Furthermore, to perform ratio analysis and equity valuation, the author uses the softwareapplication called Business Analysis & Valuation Model (BAV Model) developed by ProfessorPaul Healy and Professor Krishna Palepu, copyright of Harvard Business School.10
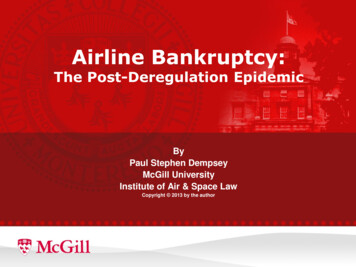
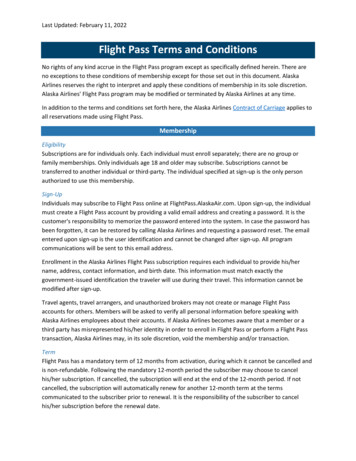
Chapter 3Theoretical FrameworkThis chapter presents different theories relating to investment and fundamental analysis. Briefbackground of market efficiency and investment style are determined, including the relations ofmarket efficiency and fundamental analysis. Then, conceptual framework of financial statementanalysis, as part of fundamental analysis, is addressed and stated details and relations in ratioanalysis and valuation analysis. Some empirical study linking to the mentioned theories areincluded accordingly.3.1Market EfficiencyIn a stock market, an investor would like to earn not only normal returns, but also abnormalprofits or beating the market. Refer to the efficient market hypothesis (EMH), the stock is tradedat its fair value, and this implies no abnormal profits opportunity offered.The EMH can be categorized into three types when considers in term of available informationaffect the stock prices (Bodie et al., 2005). Details are stated as follows.The weak form hypothesis describes that the stock prices reflect all historical prices and othersecurity market data, i.e. trading volume and historical rate of return, etc. This hypothesis impliesthat the technical analysis is not useful for beating the market (LeBaron, 1999). But, the weakform efficiency theoretically supports that fundamental analysis can be used to identifyundervalued/overvalued stocks and provides abnormal returns (Janssen et al., n.d.). The technicalanalysis and the fundamental analysis are briefly summarized below.Under the semi-strong from hypothesis, the stock prices reflect all available public information.For this hypothesis, neither technical analysis nor fundamental analysis is useful for beating themarket.The strong form hypothesis describes that the stock prices reflect all information, both public andinside, relating to the firm. With this hypothesis, the inside information is not useful for beatingthe market.For different forms of information regarding the above hypotheses, figure 1 shows relationshipamong the weak form, the semi-strong form and the strong form.11
Figure 1: Information Relationship of Weak-form, Semistrong-form and Strong-formAll information relevant to the stock(strong-form)Information set of publiclyavailable information(semistrong-form)Informationset ofpast price(weak-form)Source: Ross et al. 2005, 356In the market efficiency, the stock price should follow random walk, and change unpredictable. Ifthe stock price is predictable, the market becomes inefficient because the price will not reflectavailable information (Ross et al., 2005).Technical AnalysisTechnical analysts believe there are systematic statistics concerning the stock prices, or thehistory tends to repeat itself, so they study the past prices and look for the pattern includingpossible correlations in order to predict the stock prices (Bodie et al., 2005).There are several methods to perform technical analysis such as market timing, filter rules,relative strength, line and bar charts, and moving average of stock prices over the past periods,etc (LeBaron, 1999).Even though the technical analysts realize that information regarding future economic possibilityof the firm is valuable, they believe the stock price is more sensible to psychological factors thanfundamental factors. This can say as the key success of the technical analysis (Bodie et al., 2005).The Dow Theory, by Charles Dow (who established The Wall Street Journal), developed in thelate nineteenth, is the famous technical analysis study. The theory uses to identify long-term trendof the stock prices, which key indicators of the theory are the Dow Jones Industrial Average(DJIA) and the Dow Jones Transportation Average (DJTA) (Bodie et al., 2005).If investors find that the stock price follows the trend predicted by the Dow theory, they will buythe stock at low prices and sell it when the prices increase. If most investors perform in the same12
way, the pattern of the prices will be self-destruction and the theory will be invalid (Bodie et al.,2005).There are number of studies relating to technical analysis and most of them shown that technicalanalysis is useless for predicting the stock prices, however, some of the studies mentionedtechnical anomalies, which may give a hope for technicians even though disadvantage oftransaction costs remains the issue.Fundamental AnalysisFundamental analysts use the fundamental analysis as a tool to recommend investors to buy orsell the stock based on comparing value of the firm to its stock price. Financial statementssupplemented with future economic prospect of the firm are the sources using for thefundamental analysis.As fundamental factors consist of quantitative and qualitative information, the analysts shouldconduct both quantitative and qualitative analyses to complete the fundamental analysis for anystocks. Quantitative information relates to numerical data, which can be found in the financialstatements, so quantitative analysis can be done precisely. On the other hand, it is more difficultto extract qualitative factors because the information is less tangible or relates to quality thingssuch as quality of the management or brand-name recognition. Therefore, doing qualitativeanalysis is more difficult but considers important not less than doing the quantitative analysis(Janssen et al., n.d.).Janssen et al. (n.d.) refer the good example for importance of qualitative analysis, represents withthe Coca-Cola Company. For Coke’s stock valuation, doing only the quantitative analysis cannotbe complete because the qualitative analysis on Coke’s brand recognition is a must to undertake.If investors would like to have superior rate of returns by using fundamental analysis, they needto find firms not only are good, but also better than everyone else’s estimate. Investors in themarket generally can find good firms, but discovering better firms are the challenge. This is thedifficulty of fundamental analysis. Investors can make superior returns when their analyses arebetter than
affected to the airlines' financial performances. Some traditional airlines, especially the U.S. flag airlines, had a big lost from the tragedy and have taken years to recover the financial status. However, some of U.S. and European low-cost airlines have grown in profitability and new low-cost airlines have continued entering to the industry.