Transcription
AEA Papers and Proceedings 2019, 109: TRIBUTIONAL DIVERSITY IN THE NATIONAL ACCOUNTS‡Simplified Distributional National Accounts†By Thomas Piketty, Emmanuel Saez, and Gabriel Zucman*Piketty, Saez, and Zucman (2018)—henceforth, PSZ—propose a method to distribute totalnational income across individual adults in theUnited States. The method has recently beenapplied to a number of countries as reviewedin the World Inequality Report 2018 (Alvaredoet al. 2018). The key advantage relative to earlier work using fiscal income such as Piketty andSaez (2003) or survey data is that the nationalincome concept is comprehensive, homogeneous over time, and comparable across countries. In particular, distributional national incomestatistics can be used to study both growth andinequality in a consistent framework that aggregates cleanly to national income from nationalaccounts. In contrast, fiscal income or surveyincome aggregates display growth levels thatare quite different from national income growthboth in the short-term year-to-year fluctuationsand in the long-term growth rates averaged overdecades (see PSZ for a detailed discussion).The PSZ methodology starts from individualtax return data providing information on fiscalincome at the micro-level and then imputesforms of income that are in national incomebut not in fiscal income such as fringe benefits for employees, imputed rent of homeowners, retained profits of corporations, etc. Theseimputations are made at the individual levelbased on a number of assumptions and combining information from income tax data and auxiliary datasets such as survey data and nationalaccounts data. Naturally, there are manyassumptions involved and each assumption canbe questioned. Because the number of assumptions made is very large, the methodology lackssimplicity and hence the end results are not astransparent as the simpler earlier fiscal incomeseries by Piketty and Saez (2003).As shown in Figure 1, the Piketty and Saez(2003) fiscal income series showed a hugeincrease in the top 1 percent fiscal income sharein recent decades. The top 1 percent fiscal incomeshare grew by about 10 points from 8.4 percentin 1960 to 17.8 percent in 2016. The new PSZseries based on national income also show alarge increase in the share of national incomegoing to the top 1 percent from about 10 percentin 1980 to about 20 percent today. This doublingof the top 1 percent national income share in thePSZ series takes place both when the top 1 percent is defined based on individual adults withequal splitting of income within married couples (the benchmark PSZ series) and when thetop 1 percent is defined based on tax units (as inthe Piketty and Saez 2003 fiscal income series).Recently, Auten and Splinter (2018) have proposed an alternative set of assumptions fordistributing non-fiscal income and have founda much more modest increase in top 1 percentincome shares. Auten and Splinter use the individual adult unit. All these series are depictedon Figure 1.To cast light on these discrepancies and helpunderstand better the overall plausibility of thelarge set of assumptions in PSZ and Auten andSplinter (2018), this paper develops a simplifiedmethodology that starts from the fiscal incometop income share series and makes very basicassumptions on how each income component‡Discussants: Katharine G. Abraham, University ofMaryland; Claudia Sahm, Federal Reserve Board.* Piketty: Paris School of Economics, 48 BoulevardJourdan, 75014 Paris, France (email: piketty@psemail.eu);Saez: University of California, 530 Evans Hall, Berkeley,CA 94720 (email: saez@econ.berkeley.edu); Zucman:University of California, 530 Evans Hall, Berkeley, CA94720 (email: zucman@berkeley.edu). We acknowledgefunding from the Berkeley Center for Equitable Growth,the Sandler Foundation, and the Institute for New EconomicThinking. We thank Katherine Abraham and David Johnsonfor helpful comments and discussions.†Go to https://doi.org/10.1257/pandp.20191035 to visitthe article page for additional materials and author disclosure statement(s).289
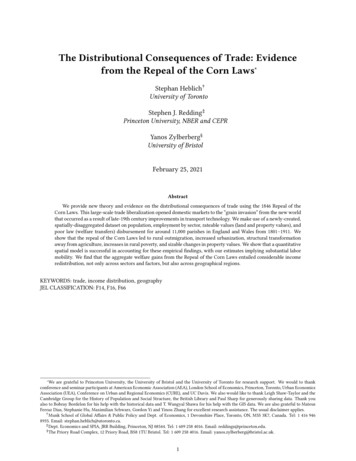
290AEA PAPERS AND PROCEEDINGS25%20%15%10%Piketty-Saez fiscal income (tax unit)PSZ pretax national income (tax unit)PSZ pretax national income (adult unit)Auten and Splinter (2018) (adult 619600%Figure 1. Top 1 Percent Income Shares, 1960 –2016Notes: This figure displays (i) the top 1 percent fiscal incomeshare from Piketty and Saez (2003) using tax units and pretaxfiscal income excluding capital gains; (ii) the top 1 percentincome share from PSZ using tax units and pretax nationalincome; (iii) the top 1 percent income share from PSZ usingthe individual adult unit (with equal split of income withinmarried couples) and pretax national income; (iv) the top 1percent pretax income share from Auten and Splinter (2018)using the individual adult unit and pretax national income.This paper shows how to reproduce approximately the PSZand Auten and Splinter series starting from the Piketty andSaez fiscal income series and making simple assumptions onhow nontaxable income is distributed.Sources: Piketty and Saez (2003); PSZ; Auten and Splinter(2018).from national income that is not included in fiscal income is distributed. This simplified methodology has two main goals.First and most important, it can be used tocreate distributional national income statisticsin countries where fiscal income inequality statistics are available but where there is limitedinformation to impute other income at the individual level. Alvaredo et al. (2016, Section VII)proposed a simplified methodology for countrieswith less data. The methodology proposed herecan be seen as an even simpler method that canbe applied to countries for which fiscal incometop income share statistics exist1 and for whichnational accounts and fiscal income aggregatesare sufficiently detailed.1Such series exist for a large number of countries andare available online in the World Inequality Database wid.world. See Atkinson, Piketty, and Saez (2011) for a reviewof this literature.MAY 2019Second, this simplified methodology canalso be used to assess the plausibility of thePSZ assumptions. In particular, we will showthat the simplified methodology can be used toshow that the alternative assumptions proposedby Auten and Splinter (2018) imply a drasticequalization of income components not in fiscalincome which does not seem realistic.I. Simplified Distributional National AccountsIn what follows, we focus solely on pretaxnational income defined as market income afterthe operation of public and private pension systems (i.e., net of pension contributions eitherpublic through social security payroll taxes orprivate through defined benefit and defined contributions pension plans and including all pension benefits public and private). Pretax nationalincome is before all taxes (except payroll taxesfunding social security benefits) and before anygovernment transfers (except public pensions).As discussed extensively in Alvaredo et al.(2016), considering income after the operationof pension systems allows to control for theeffects of aging (as retirees typically have verylittle factor income) and whether a country organizes pensions privately or publicly. PSZ pretaxincome benchmark series also use this pretaxnational income definition.We consider tax units (as opposed to individual adults as in the main PSZ series) because fiscal income series by Piketty and Saez (2003) arebased on tax units (following the tax definition).Moving from tax units to individual units withincome equally split within married couples (thebenchmark series of PSZ) is fairly easy to dobut would require recomputing fiscal incomeseries. As shown in Figure 1, using tax units versus the individual adult (with equal split withinmarried couples) has only a very minor effecton series as displayed in Figure 1.22Auten and Splinter (2018) estimates—as well as theCongressional Budget Office estimates (CBO 2018)—donot use consistent definitions when ranking units to definethe top 1 percent and when defining income to computetop income shares. Incomes for ranking are normalized byhousehold size including children, but incomes for computing top shares are not. This inconsistency in definitionsmechanically biases downward the top 1 percent incomeshare (as the incomes of the top 1 percent are actually not thehighest top 1 percent incomes). This does not seem s ensible
291SIMPLIFIED DISTRIBUTIONAL NATIONAL ACCOUNTSto us. In our view, the top 1 percent should be the top 1 percent highest income earners.Panel A. From taxable to total pretax national income100%90%80%70%60%50%40%30%20%10%0%Tax-exempt capital incomeTax-exempt labor 0Taxable income196Percent of factor-pricenational incomePanel B. Separating taxable labor and taxablecapital income100%90%80%70%60%50%40%30%20%10%0%Other tax-exempt capital incomeTax-exempt capital income in pension fundsTaxable capital incomeTax-exempt labor incomeTaxable labor income19619 0619 4619 8719 2719 68019819 4819 8919 2920 6020 0020 4020 8122016To simplify the exposition, here as in therest of the computations presented below,we exclude taxes on products and production (primarily sales and excise taxes) fromnational income. This implies that we considerfactor-price national income (instead of fullnational income). This has no consequenceon the distributional analysis as distributionalnational income methodology distributes taxeson products and production proportionally tofactor-price national income on a pretax basis.Conceptually, factor-price national income canbe seen as the income that would allow to buy allthe production carried out by the factors (laborand capital) owned by residents provided thatthis production can be bought at prices that donot include taxes on products and production.The exclusion of taxes on products and production has only a very modest effect on the evolution of the top 1 percent income share.The simplified methodology starts with the fiscal income top income share series developed byPiketty and Saez (2003). As shown on Figure 1,the top 1 percent fiscal income share (excludingcapital gains) has increased from 8.4 percent in1960 to 17.8 percent in 2016. Everybody agreesthat the concentration of reported fiscal incomehas increased a lot since 1960. This is uncontroversial because this fiscal income is directlyobservable in tax data.Reported fiscal income (excluding capitalgains) adds up to 64 percent of factor-pricenational income in 2016 down from 70 percent in 1960. As shown in Figure 2 panel A,the majority of the pretax income not visible onindividual tax returns is capital income (corporate retained earnings, corporate income taxes,tax-exempt interest, imputed rents, propertytaxes, investment income earned by pensionfunds, income paid to trusts, fiduciaries, etc.).As shown in Figure 2 panel B, untaxed capitalincome accounts for the vast majority of totalcapital income in the economy. As pensionfunds grow over time and are more equally distributed than other forms of wealth, it is usefulto split untaxed capital income into the untaxedcapital income earned by pension funds andother untaxed capital income.Percent of factor-pricenational incomeVOL. 109Figure 2. From Taxable to Total Pretax NationalIncome, 1960–2016Notes: Panel A decomposes factor-price national income(defined as national income excluding taxes on production and production) into taxable income (reported on taxreturns), tax-exempt labor income (not reported on taxreturns), and tax-exempt capital income (not reported on taxreturns). Panel B further splits taxable income into taxablelabor income and taxable capital income and tax-exemptcapital income into tax-exempt capital income in pensionfunds and other tax-exempt capital income. In both panels,realized capital gains are excluded from taxable income.Source: PSZ, series updated to 2016.PSZ offers a sophisticated treatment ofuntaxed income that involves a detailed reconciliation with national accounts totals component by component. However it is possible toreproduce the PSZ results quickly and to understand what their methodology amounts to doingin a simple way. The 36 percent of pretax (factor-price) national income not reported in taxdata in 2016 can be decomposed as follows: 12.7 percent is untaxed labor and pensionincome (employer contributions to healthinsurance, Social Security benefits, untaxedprivate pension benefits such as Roth IRAs,and after-tax Defined Contribution plans,under-reported labor income most of whichis from noncorporate business profits);
AEA PAPERS AND PROCEEDINGS 10.6 percent is untaxed capital incomeearned on pension plans (including the fraction of the corporate income tax, businessproperty tax, and retained earnings attributable to pension plans); and 13.0 percent is untaxed capital income otherthan earned on pension plans.We use the following two assumptions in oursimplified methodology:(i) Untaxed labor and pension income anduntaxed capital income earned on pension plans is distributed like taxablelabor and pension income.(ii) Other untaxed capital income is distributed like taxable capital income.With these two assumptions and using the composition of top fiscal incomes (broken down in(a) labor and pension income, and (b) capitalincome) provided by Piketty and Saez (2003)compositional series, we can compute pretaxnational income top income shares as follows(see the supplemental materials for completecomputations).The share of untaxed labor and pensionincome and untaxed capital income earned onpension plans accruing to top 1 percent earnersis assumed to be the same as the share of laborand pension income in fiscal income accruing totop 1 percent earners. It grows from 6 percentin 1960 (when labor income had low concentration) to 15 percent in 2016 (when labor incomeis much more concentrated). The share of otheruntaxed capital income in national income accruing to top 1 percent earners is assumed to be thesame as the share of taxable capital income infiscal income accruing to top 1 percent earners.Such taxable capital income has always beenhighly concentrated with the share accruing tothe top 1 percent growing from 40 percent in1960 to 48 percent in 2016. These two calculations use the two assumptions stated above andassume that any effects due to re-ranking (whenmoving from fiscal income to national income)are negligible.Figure 3 displays the resulting simplified top1 percent pretax national share. It shows that thissimplified top income share tracks very closelythe corresponding sophisticated PSZ incomeshare in both levels and trends. Put another way,MAY 201925%20%15%10%5%Simplified PSZ (tax units)PSZ (tax 102015292Figure 3. Top 1 Percent Pretax National Income Share:PSZ versus Simplified ComputationsNotes: This figure displays the top 1 percent pretax nationalincome share from PSZ in solid line and using our proposedsimplified computation in dashed line. The simplified computation uses realistic assumptions and reproduces closelythe PSZ series both in levels and trends.Sources: PSZ and authors’ computations.the PSZ methodology delivers results that areabout the same as the results one would obtainby decomposing national income into taxableincome and three categories of untaxed income,and making simple assumptions about how thesethree categories are distributed.The PSZ series and the simplified series trackeach other closely with an almost perfect matchin 1960 and 2016. The main difference is in thelate 1970s and early 1980s when very little taxable capital income was reported (due to largebusiness losses due in large part to the development of tax shelters). Such business losseswere corrected for in PSZ (by ignoring businesslosses) but not with this simplified method. As aresult, the simplified series undershoot slightlythe PSZ series in that period.More generally, the simplified assumptionsare clearly too coarse. In particular, the aggregate of untaxed labor and pension income is amixed bag of heterogeneous income categoriesthat are distributed very differently (e.g., SocialSecurity benefits are equally distributed, whileunder reported labor income, most of which is inbusinesses, is unequally distributed.) Similarly,untaxed capital income includes elements thatare very concentrated (such as retained earningsof corporations not owned by pension plans) andelements that are much less concentrated (suchas imputed rent of homeowners). Therefore,
VOL. 109SIMPLIFIED DISTRIBUTIONAL NATIONAL ACCOUNTSthe sophisticated PSZ approach is required todeliver more accurate results. But at least ourtwo basic assumptions are a reasonable wayto distribute the aggregate amount of untaxedincome, and for all its complexity the PSZ methodology amounts to making roughly these simple assumptions.II. Comparison with Auten and Splinter (2018)Auten and Splinter (2018) also propose todistribute national income by income groupsbut make different assumptions than PSZ alongmany dimensions. They start from the fiscal income series of Piketty and Saez (2003),make a number of definitional changes, andadd various income components not includedin fiscal income. In the end, they find a top 1percent income share of 14.2 percent in 2015.Using the national income at factor prices totalof 14.98Tr in 2015, this means that their top1 percent earns 2.13Tr in 2015. In the Pikettyand Saez (2003) fiscal series including realizedcapital gains, the top 1 percent income share in2015 is 21.6 percent of a 10.26Tr fiscal incometotal, which means that the top 1 percent earns 2.22Tr in fiscal income in 2015. Therefore,Piketty and Saez (2003) find more income goingto the top 1 percent by simply looking at theirreported fiscal income (including realized capital gains) than what Auten and Splinter (2018)obtain after adding various income componentsthat enlarge the denominator income base by 46percent from 10.26Tr to 14.98Tr.As shown on Figure 1, Auten and Splinteralso find that the top 1 percent share of pretaxnational income has barely increased since 1960( 2.8 points instead of 9.4 for fiscal income).For this to be true, it must be the case that the36 percent of national income which are notreported on individual tax returns have becomeenormously less concentrated over time. Thisequalization process must have been so powerfulas to offset the upsurge in the concentration ofthe (much larger) flow of reported fiscal income.Piketty, Saez, and Zucman (2018) find that the36 percent of national income not in tax returnshas become slightly less concentrated over time.Is it conceivable that it has in fact become dramatically less concentrated?What assumptions on the evolution of the distribution of the untaxed income categories areneeded to recover the Auten and Splinter (2018)293results? One can recover the Auten and Splinter(2018) top 1 percent pretax income shares bychanging our two assumptions as follows.Under our assumption 1, nontaxable laborand pension income and capital income earnedon pension plans is distributed like taxablelabor income. The share going to the top 1 percent grows from 6 percent in 1960 (when laborincome had low concentration) to 15 percent in2016 (when labor income is much more concentrated). Instead, to replicate Auten and Splinter,we assume that the concentration of nontaxablelabor and pension income and capital incomeearned on pension plans remains frozen at its1960 level, i.e., the top 1 percent get only 6 percent of such income throughout the full period1960–2016. This is a very low level that essentially states that the rich have been largely leftout of the explosion of pension funds, fringebenefits, and the surge of business income thatis under-reported on tax returns.3Under our assumption 2, the share of otheruntaxed capital income in national incomeaccruing to top 1 percent earners is assumedto be the same as the share of taxable capitalincome in fiscal income accruing to top 1 percentearners. It is very concentrated with the shareaccruing to the top 1 percent growing from 40percent in 1960 to 48 percent in 2016. Instead,to replicate Auten and Splinter, we assume thatthe share of other untaxed capital income earnedby the top 1 percent declines linearly from 30percent in 1960 to 10 percent in 2016. Hence,we assume that this share declines dramaticallyso that nontaxable capital income (outside ofpension funds) is now more equally distributedthan labor income. This assumption is thereforeextreme and amounts to assuming that capitalincome and wealth are now extremely equallydistributed in the United States.Figure 4 shows that our simplified methodology combined with these two alternative3The classical reference on the distribution of under-reported income Johns and Slemrod (2010) finds that addingunder-reported income does not affect the distribution of fiscal income (their Table 5). Johns and Slemrod (2010) alsofind that the fraction of Schedule C business income evadedby the top 0.5 percent is 55 percent and almost identical tothe full population average of 57 percent (their Table 4). Thisis consistent with PSZ methodology but in sharp contrast toAuten and Splinter (2018) who attribute a disproportionatelylarge and growing fraction of under-reported income to thebottom 90 percent.
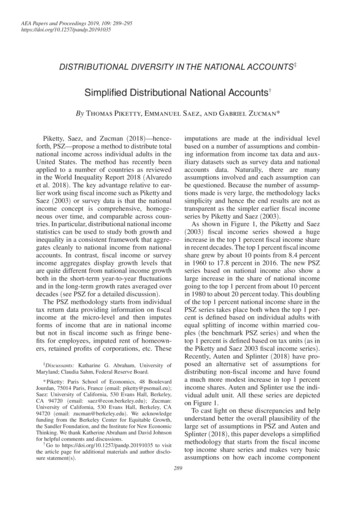
294MAY 2019AEA PAPERS AND PROCEEDINGS25%40%20%15%Capitalized 519901985198019751971960Figure 4. How to Recover Auten and Splinter Top1 Percent Income Share Series Using SimplifiedComputationsNotes: This figure displays the top 1 percent pretax nationalincome share from Auten and Splinter (2018) in solid lineand using a simplified computation in dashed line. The simplified computation needs to use unrealistic assumptions toreproduce closely the Auten and Splinter series both in levels and trends. We need to assume that the concentrationof nontaxable labor income and capital income on pensionfunds is stable and low even though the concentration of taxable labor income increases sharply. We also need to assumethat the concentration of other nontaxable capital incomedeclined sharply from 1960 to 2016 to unrealistically lowlevels by 2016.Sources: Auten and Splinter (2018) and authors’computations.assumptions reproduces closely the Auten andSplinter (2018) estimates both in levels andtrends. However, these alternative assumptionsare extreme and hence unrealistic. In particular,assumption 2 goes starkly against a body of evidence showing that the concentration of wealthin the United States has in fact increased sharply(as summarized in Zucman forthcoming). As faras we can see, Auten and Splinter do not provideany corroborating evidence which could justifyassumption 2, while there is ample evidence tojustify assumption 1 as a benchmark hypothesis.The share of total household wealth owned bythe top 1 percent of households in the Surveyof Consumer Finances (SCF) (which excludesthe Forbes 400) has increased from 29.7 percentin 1989 to 38.8 percent in 2016 (Bricker et al.2017). The share of wealth owned by the Forbes400 has been multiplied by more than threesince 1982 (see Zucman forthcoming) growingfrom less than 1 percent in the early 1980s toover 3 percent in the 2010s. Saez and Zucman(2016) created wealth inequality series usingthe capitalization method and 7051970%20%196Simplified Auten and SplinterAuten and Splinter1965%196SCF (including Forbes 400)35%Figure 5. Top 1 Percent Wealth Share in the UnitedStates: Capitalized Incomes and SCFNotes: This figure displays the top 1 percent wealth shareobtained by capitalizing incomes and obtained from theSurvey of Consumer Finances (SCF). The wealth of theForbes 400 richest Americans (which by design are excludedfrom the SCF) is added to the wealth of the top 1 percent inthe SCF. The unit of observation is tax units for capitalizedincomes and households for the SCF.Sources: Saez and Zucman (2016), updated, and Bricker etal. (2017). Series are reproduced from Zucman (forthcoming, figure 2).distributing all sources of household wealthfrom financial accounts. They also find a largeincrease in wealth concentration. These findings are illustrated in Figure 5 (reproduced fromZucman forthcoming). Figure 5 displays the top1 percent wealth share estimates based on Saezand Zucman (2016) series capitalizing incometax returns and the top 1 percent wealth sharecombining the official SCF estimates of Brickeret al. (2017) and the Forbes 400 wealth share (asthe Forbes 400 are excluded by definition fromthe SCF). Both series show a sharp increase inthe top 1 percent wealth share. In 2016, bothseries show that about 40 percent of total household wealth is owned by the top 1 percent. TheSCF estimates for 2016 show a slightly highertop 1 percent wealth share (40.7 percent) thanthe Saez-Zucman capitalized income estimates(38.9 percent). These 2016 estimates are upfrom 30.8 percent in 1989 using the SCF seriesand up from 23.6 percent in 1980 using the capitalized income tax series.Therefore, our simplified methodology canshow very simply that one needs extreme andhence unrealistic assumptions on equalizationof income components not in fiscal income toreverse the large increase in income concentration obtained from fiscal income series ofPiketty and Saez (2003).
VOL. 109SIMPLIFIED DISTRIBUTIONAL NATIONAL ACCOUNTSREFERENCESAlvaredo, Facundo, Anthony B. Atkinson, LucasChancel, Thomas Piketty, Emmanuel Saez,and Gabriel Zucman. 2016. “DistributionalNational Accounts (DINA) Guidelines: Concepts and Methods Used in WID.world.”World Wealth and Income Database WorkingPaper 2016/1.Alvaredo, Facundo, Lucas Chancel, ThomasPiketty, Emmanuel Saez, and Gabriel Zucman.2018. World Inequality Report 2018. Cambridge, MA: Harvard University Press.Atkinson, Anthony B., Thomas Piketty, andEmmanuel Saez. 2011. “Top Incomes in theLong Run of History.” Journal of EconomicLiterature 49 (1): 3–71.Auten, Gerald, and David Splinter. 2018. “IncomeInequality in the United States: Using TaxData to Measure Long-Term Trends.” http://davidsplinter.com/AutenSplinter-Tax Dataand Inequality.pdf (accessed January 5, 2019).Bricker, Jesse, Lisa J. Dettling, Alice Henriques,Joanne W. Hsu, Lindsay Jacobs, Kevin B.Moore, Sarah Pack, John Sabelhaus, JeffreyThompson, and Richard A. Windle. 2017.295“Changes in U.S. Family Finances from 2013to 2016: Evidence from the Survey of Consumer Finances.” Federal Reserve Bulletin 103(3): 1–42.Congressional Budget Office. 2018. The Distribution of Household Income, 2015. Washington,DC: Congressional Budget Office.Johns, Andrew, and Joel Slemrod. 2010. “TheDistribution of Income Tax Noncompliance.”National Tax Journal 63 (3): 397–418.Piketty, Thomas, and Emmanuel Saez. 2003.“Income Inequality in the United States, 19131998.” Quarterly Journal of Economics 118(1): 1–39.Piketty, Thomas, Emmanuel Saez, and GabrielZucman. 2018. “Distributional NationalAccounts: Methods and Estimates for theUnited States.” Quarterly Journal of Economics 133 (2): 553–609.Saez, Emmanuel, and Gabriel Zucman. 2016.“Wealth Inequality in the United States since1913: Evidence from Capitalized Income TaxData.” Quarterly Journal of Economics 131(2): 519–78.Zucman, Gabriel. Forthcoming. “Global WealthInequality.” Annual Review of Economics.
Simplified Distributional National Accounts† By Thomas Piketty, Emmanuel Saez, and Gabriel Zucman* Piketty, Saez, and Zucman (2018)—hence-forth, PSZ—propose a method to distribute total national income across individual adults in the United States. The method has recently been applied to a number of countries as reviewed