Transcription
United StatesDepartment ofAgricultureForest RP–543Roof Temperaturesin Simulated AtticsJerrold E. WinandyRhett Beaumont
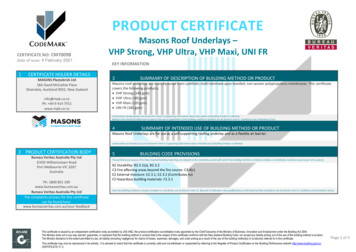
AbstractAcknowledgmentThe degradation of wood treated with fire retardant (FR)chemicals in roof systems is a problem of major nationalsignificance. Understanding of this phenomenon is limited bylack of information on how the performance of FR-treatedwood in the laboratory correlates to that of FR-treated woodin the field. In this study, five outdoor field exposure chambers were constructed near Madison, Wisconsin, in the summer of 1991. These structures were intended to simulate the“attics” of multifamily structures for which model buildingcodes sometimes allow the use of FR-treated roof sheathing.Interior attic air, exterior air, inner and outer sheathing, andinternal rafter temperatures of black- and white-shingledchambers were monitored. Temperatures were measured usingthermocouples and recorded over a 3-year period from October1991 through September 1994 using a datalogger/multiplexerdevice. Overall, the plywood sheathing in black-shingled roofsystems tended to be 10 F to 15 F (5 C to 8 C) warmer during the midafternoon of a sunny day than the plywood incomparable white-shingled roof systems. The maximumsheathing temperatures recorded were 168 F (76 C) for blackshingled roofs and 147 F (64 C) for white-shingled roofs.The results suggest that roof-sheathing plywood and rooftruss lumber temperatures, which are the primary factors thatinfluence thermal degrade of FR-treated materials, are primarily controlled by solar gain rather than attic ventilation orattic insulation. These results are tempered by the fact thatthe effect of moisture content was not evaluated nor wasmoisture controlled by attic ventilation.The authors acknowledge the financial assistance of the NewJersey Department of Community Affairs and the technicalassistance of Mike Grambsch and Earl Geske, who monitoredand programmed the temperature datalogging equipment atthe Valley View test site. We also wish to thank CertainTeedCorporation for their donation of the roofing materials usedon the outdoor simulated-attic exposure chambers.Keywords: Roof temperature, plywood, roof sheathing, rafter,thermal degrade, fire-retardant treatment, shingles, ethod.3Exposure Chambers.3Temperature Monitoring System.3Results and Discussion .5Comparison of Black- and White-Shingled Chambers.6Difference in Yearly Temperature Histories.6Temperature Trends.8Concluding Remarks.9September 1995Winandy, Jerrold E.; Beaumont, Rhett. 1995. Roof temperatures insimulated attics. Res. Pap. FPL–RP–543. Madison, WI: U.S. Department ofAgriculture, Forest Service, Forest Products Laboratory. 14 p.A limited number of free copies of this publication are available to thepublic from the Forest Products Laboratory, One Gifford Pinchot Drive,Madison, WI 53705–2398. Laboratory publications are sent to more than1,000 libraries in the United States and elsewhere.The Forest Products Laboratory is maintained in cooperation with theUniversity of Wisconsin.The United States Department of Agriculture (USDA) prohibitsdiscrimination in its programs on the basis of race, color, national origin,sex, religion, age, disability, political beliefs, and marital or familial status.Persons with disabilities who require alternative means of communicationof program information (braille, large print, audiotape, etc.) should contactthe USDA Office of Communications at (202) 720–2791. To file acomplaint, write the Secretary of Agriculture, U.S. Department ofAgriculture, Washington, DC 20250, or call (202) 720–7327 (voice), or(202) 720–1127 (TTD). USDA is an equal employment opportunityemployer.References.9
Roof Temperaturesin Simulated AtticsJerrold E. Winandy, Research Wood ScientistForest Products Laboratory, Madison, WisconsinRhett Beaumont, Consulting EngineerHazard Engineering, Inc., Morton Grove, IlinoisProblemThe degradation of wood treated with fire retardant (FR)chemicals in roof systems has been reported in thousands ofcases over the eastern half of the United States (NAHB1990). Understanding of this wood deterioration phenomenonis currently limited since there is little information that correlates the results of laboratory experiments using steady-stateand cyclic temperature exposures to actual diurnal (that is,daily cyclic) field temperature histories experienced by FRtreated wood in service. This lack of a consensus “lab-tofield” correlation has inhibited the ability to predict thermalinduced degradation of FR-treated wood in the field fromthermal-degradation rates derived in the laboratory.Current model studies have generally been limited toisothermal rate studies performed in the laboratory withselected model FR chemicals. Factors other than temperatureappear to play a secondary role in the degradation of FRtreated wood. These secondary factors, which are currentlybeing studied in greater detail in additional laboratory experiments, include relative humidity (as it influences wood moisture content) and moisture content cycling. Each factor(temperature and moisture content) contributes to the rate ofthermal-induced degradation. However, a significant problemis the lack of reliable and scientifically reproducible data thatrelates the performance of FR-treated wood products inlaboratory exposures to performance in the field. Accuratemodeling of the degradation of FR-treated and untreated woodwill require obtaining sufficient and comprehensive data fromboth laboratory and field studies to establish creditable acceptance criteria for evaluating roof sheathing performance.3. mechanical evaluation and development of a lab–fieldcorrelation factor.This report presents actual roof temperature data fromPhase 1 of this experiment obtained over a 3-year periodfrom October 1, 1991, through September 30, 1994.In Phase 2 of our experiment, the five field exposure chambers serve as platforms in which nominal 0.5-in.- (standard12-mm-) thick, 4- by 22-in. (100- by 559-mm) plywood testspecimens are being exposed to diurnal/seasonal cyclic fieldconditions. The inside of each exposure chamber was constructed such that 96 plywood samples could be inserted intothe frames, providing direct contact with the shingle/roof feltroofing membrane. A future report will describe the potentialfor thermal degrade of untreated controls and various genericFR treatments exposed to either simulated field conditions ina field exposure chamber or to a steady-state high-temperatureenvironment in the laboratory at 150 F (66 C) and 75 percentrelative humidity.Background1. construction and monitoring of five field exposurechambers near Madison, Wisconsin,Fire retardants were first used in the United States by theNavy in 1895 (Moreel 1939), but use was discontinued in1902, in part because of their corrosiveness to fasteners.Preliminary research by Prince (1915) and the ForestProducts Laboratory, USDA Forest Service, in the 1930s(Hunt and others, 1930,1931,1932; Truax and others,1933,1935) led to the use of combinations of ammoniumsulfate, diammonium phosphate, borax, and boric acid ascommercial fire retardants. Materials treated with thesesystems have been used successfully in structures at or nearroom temperature for more than 50 years. Histories of FRtreated wood and its acceptance by building codes and intreating standards, respectively, can be found in the literature(Catchpole 1976, Barnes 1994).2. exposure of side-matched specimens treated withvarious FR treatments in either a steady-state 150 F(66 C)/75-percent relative humidity laboratory exposureor a diurnal/seasonal exposure in one of these five fieldchambers, and finallyIn the 1970s, concern over hygroscopicity and fastener corrosion led the industry to develop improved systems with lowercorrosion potential and hygroscopicity, known generically assecond-generation fire retardants (Davies 1979). Thesesystems entered the marketplace in the early 1980s. At nearlyOur study consists of three phases:
the same time, a change in the model building codes allowedthe use of FR-treated plywood sheathing as a replacement fornoncombustible roof deck and parapet–wall systems in multifamily structures. Because of the energy crisis, constructionpractices were also changed to provide more resistance topassive indoor air infiltration, and designers relied more onbuilt-in passive attic ventilation or active mechanical atticventilation. In addition, structures were better insulated in anattempt to make them more thermally efficient. Each changehad the potential for affecting the in-service temperatures towhich wood roof systems were exposed.Heyer (1963) reported temperature histories for wall and roofsystems for six houses and one office building located acrossthe United States. The houses were located in Tucson,Arizona; Athens, Georgia; Portland, Oregon; Diboll, Texas;and Madison, Wisconsin. The office building, the originalheadquarters of the Forest Products Society, was also locatedin Madison, Wisconsin. The results of this study found thatthe maximum temperature of the roofs could reach 170 F(76 C), but that the cumulative duration of temperatures over160 F (71 C) was not observed to exceed 21 h in any oneyear. In addition, the cumulative duration of temperaturesover 150 F (66 C) was not observed to exceed 64 h in anyone year, which is important considering that design standards for wood (AF&PA 1991) require a strength propertyadjustment for sustained exposures above 100 F (38 C) andgreater adjustment for prolonged exposure above 150 F(66 C).Several studies modeled the roof temperatures attained bystructural buildings. Ozkan and Wilkes studied the temperatures of the surface and various components in flat roofsystems, but they did not consider wood sheathing temperatures. In the study by Ozkan (1993), temperatures on roofingsurfaces of a field station in a very hot, dry Arabic climatereached 200 F (93 C) during April 1989 to November 1990.The primary use of this station was to observe the effects ofweathering and to measure the temperatures of the bituminous and polymeric waterproofing membranes in addition tothat of thermal insulation materials. In the study by Wilkes(1989), metal roof temperatures reached as high as 163 F(73 C) during January and May in eastern Tennessee. Formore exposure temperature histories for shingles the reader isreferred to publications by the National Bureau of Standards(NBS 1979) and Blackenstowe (1987). The temperatureshistories discussed hereafter pertain to wood components ofroof systems.Computer models have been developed that predict the average temperature and moisture content of plywood roof sheathing and other lumber roof members based on various construction details, materials, ventilation factors, and solar gain(that is, radiation load) on the roof. A model studied by theAmerican Plywood Association predicted that flat-roofed2systems with a black membrane might experience high-endtemperatures of 150 5 F (66 3 C), 160 5 F (71 3 C),170 5 F (76 3 C), and 180 5 F (82 3 C) for up to 36, 13,5, and 2 h, respectively, over the course of an average yearin Hartford, Connecticut (APA 1989). Wilkes (1989) developed and verified a predictive roof temperature model formulti-layer nonwood roof systems. However, the model doesnot account for moisture flux, which may be critical in woodroof systems.TenWolde (1988) described a model (still under developmentand needing verification) that estimates that the surface temperature of plywood roof sheathing is dominated by solargain and the heat exchange between the roof surface andambient air. Diurnal temperature variation and hourly sheathing temperature histories are also influenced by the radiantenergy absorptivity of roofing surface, the pitch of the roof,and the presence of insulation and attic ventilation. TheTenWolde model predicts that wet plywood sheathing driesquickly under warm summer conditions. For example, ifplywood with a moisture content of 60 percent is installed,the plywood moisture content is roughly 15 percent after1 week and is reduced to 8 percent in roughly 2 weeks. Themodel also indicates that the absorptivity of solar/radiant energy of the roofing material has the greatest effect on increasing or reducing the average temperature of the plywood roofsheathing. If the absorptivity of the roofing material is 0.92,the model predicts that the maximum hourly temperature forthe roof sheathing plywood is 140 F (60 C) and the maximum predicted exterior roof membrane temperature is 150 F(66 C). If the absorptivity is changed to 0.2, supposedly representing a metal roof system, the maximum predictedsheathing temperature drops to 95 F (35 C) and the maximum predicted membrane temperature is 95 F (35 C). Thepitch of the roof has only a moderate influence on reducingboth the exterior surface temperature and the average temperature of the plywood. The TenWolde model also predicts thatthe presence of insulation installed directly on the undersideof the sheathing has virtually no influence on sheathing temperature on the top surface but raises the average sheathingtemperature relative to that of the top surface. When the ventilation rate in uninsulated systems is increased from 8 airchanges per hour to about 21, almost no reduction of thetop surface sheathing temperature or average sheathing temperature is predicted.In 1992, a test facility was constructed at the BuildingResearch Council of the University of Illinois to measureheat transfer, moisture movement, and airflow in typical residential attic structures under natural conditions (Rose 1992).The results of this study showed that during the summer inIllinois attic ventilation could lower attic air temperature by28 F (15.5 C) and sheathing temperature by almost 10 F(5.5 C). However, attic ventilation had only a minor effecton roof shingle temperature.
MethodTo obtain the necessary roof sheathing temperature data torelate diurnal and seasonal-cyclic field exposure to steady-statelaboratory exposures, five field exposure chambers were constructed at the Valley View exposure site near Madison, Wisconsin (43 latitude). On the winter solstice (December 21),the average incidence angle of sunlight is 19.5 from thesouthern horizon and on the summer solstice (June 21), 43 .Thus, the annual average declination angle in Madison is31.25 . Considering these facts, the chambers were constructed to face south in a shadeless area open to direct sunlight. In addition, the chambers were also spaced far enoughapart to prevent any one chamber from shading the nextchamber. The exposure chambers are shown in Figure 1.Exposure ChambersThe 12-ft- (3.7-m-) wide by 16-ft- (4.9-m-) long, identicalexposure chambers were constructed to simulate part of atypical multifamily attic/roof system in which model building codes sometimes allow FR-treated plywood roof sheathing. To achieve this type of construction, the chamberssimulated in cross section the 1/8- to 3/8-span section of a48-ft (14.6-m) span, 3:12 pitch roof system in both roof areaand attic volume (Fig. 2). Each chamber was completelyenclosed and kept unventilated. The four exterior walls weresheathed with 1/2-in.- (12-mm-) thick, 8-in.- (200-mm-)grooved Southern Pine siding attached to nominal 2- by 4-in.(standard 38- by 89-mm) wall studs. The exterior surfaces ofeach building were coated with one coat of primer and twotop coats of latex solid-color stain or paint. The color of thestain or paint was light gray, almost white. The walls andthe 5/8-in. (16-mm) plywood and nominal 2- by 10-in.(standard 38- by 235-mm) joist floor system of each chamberwere not insulated. The chambers were roofed with CertainTeed XT-25 fiberglass roofing shingles that weighed 233 lb(106 kg) per square.1 These shingles were essentially identical to those used in Champaign, Illinois, to study the behavior of attics constructed and ventilated in various ways (Rose1992). White shingles were used on two chambers and blackshingles on the remaining three chambers, which allowed usto address the effect of shingle color on thermal absorptivity.Because of the gentle slope of the test site, the north side ofthe chambers was approximately 12 in. (0.3 m) off theground, whereas the south side was about 16 in. (0.4 m)off the ground.In 1994, similar exposure chambers were constructed at theMississippi Forest Products Laboratory at Mississippi StateUniversity in Starkville as part of an ongoing effort to relate1The use of trade or firm names in this publication is forreader information and does not imply endorsement by theU.S. Department of Agriculture of any product or service.Figure 1—Outdoor field exposure chambersbuilt near Madison, Wisconsin (latitide 43.4 north). Each chamber holds 96 field exposurespecimens. (M95 0057–24A)temperatures in matched northern and southern U.S. roof systems (Barnes and others 1993). The conditions in the Mississippi study are expected to be more severe (that is, highersolar loading) than those in the Madison study. When available, the data from the Mississippi study will be integratedwith field data from the Madison study.Temperature Monitoring SystemTwo of the five field exposure chambers—one black-shingledchamber and one white-shingled—were instrumented withnine thermocouples variously located within the structure(Figs. 3 and 4). In each chamber, the first two thermocouples(T0 and T1) measured interior chamber temperature at 8 ft(2.43 m) and 5 ft (1.52 m) above grade, respectively. Thesethermocouples were centrally located along the back (north)wall. The third thermocouple (T2) measured exterior chambertemperature and was centrally located on the back wall. It waslocated 6 ft (1.83 m) above the grade. The fourth thermocouple (T3) was placed in the roof system below the roofing feltand attached by wood-fiber-based adhesive to the top veneer ofthe 3/4-in. (19-mm) plywood sheathing. This thermocouplewas located high in the roof structure: at one-third of the rafter span approximately 4 ft (1.22 m) from the north (ridge)wall. The fifth thermocouple (T4) was similarly placed in theroof system below the roofing felt and attached to the top plyof the plywood sheathing, but it was located lower in theroof structure: at one-third of the rafter span approximately4 ft (1.22 m) from the south (eave) wall. These two locationswere selected because small roof systems such as this theoretically might not become as hot as large roof structuressince air heats as it travels across the roof surface. Rose(1992) reported such a phenomenon affecting sheathingtemperatures when comparing a 30-ft- (9.2-m-) wide systemto a 42-ft- (12.8-m-) span system. However, we believe that3
128-ft field exposure chamber (see Figure 3)Area 5 x 12 1/2(3 x 12) 78 ft28 ft3 Field chambers have approximately one-half the5 ftsouth-facing solar load area and one-half theattic volume as a 48-ft roof truss-attic system. 48-ft multifamily roof trussArea 144 ft2 (total)72 ft2 south-facing half section4.5 ft1.5 ft6 ft123 Figure 2—View of field exposure chamber in relation to roof truss of multifamily structure. Field chamberhas approximately half the south-facing solar load area and half the attic volume as that of a 48-ft (14.6-m)roof truss–attic system. 1 ft2 0.09 m2.Specimen NorthRoof feltPlywoodShingles RaftersSpecimenT8 3:12 pitchT6T3T5T4T0 Datalogger Roof felt Shingle6in. T2 PlywoodsheathingT18 ftT7Test specimenT3T5T8Embeddedinsiderafter5 ft 2 x 6 in.rafterFigure 3—Schematic cross section of instrumented field exposure chamber showing location ofthermocouples (T0–T8) and channels for datalogger/multiplexer.4
overall the roof systems that we used were able to simulatethermal loading conditions within the small 4-in. (100-mm)by 22-in. (559-mm) plywood test specimens in a nearlyidentical manner to that experienced by full-sized 4-ft.(1.22-m) by 8-ft (2.44-m) sheets of treated roof sheathing.The sixth thermocouple (T5) was attached to the bottom ofthe roof sheathing plywood, one-third of the rafter spanfrom the north wall. Similarly, the seventh thermocouple(T6) was also attached to the bottom of the roof sheathingplywood, but one-third of the rafter span from the southwall. The eighth thermocouple (T7) was used as the external reference thermistor; it was a single channel identical toboth buildings. This thermistor had a rated accuracy of 0.4 F ( 0.2 C) between 27 F ( 33 C) and 120 F (48 C).The ninth thermocouple (T8) was located within the interiorof the roof rafter/joist. Specifically, this thermocouple wasinserted in the center of the 2- by 6-in. (38- by 140-mm)cross section at the midspan of the Western Hemlock rafter.The position of the T8 thermocouple allowed us to correlaterafter and sheathing temperatures directly to one another andeventually to solar load as monitored by the U.S. WeatherService at Truax Field in Madison ( 8.5 mi [ 13.5 km]east–northeast of the test site).185 F (85 C). The datalogger and multiplexer were placedin a weather-sealed box inside the white-shingled chamber,on the east wall approximately 6-ft (1.83-m) above thefloor. The datalogger–multiplexer system collected temperature data every 5 min for each exposure chamber; the datalogger was programmed to calculate and record hourly average temperatures. Each week, the hourly data were downloaded to disk with a laptop computer. The set-up of thedatalogger–multiplexer system and a temporarily attachedlaptop computer is shown in Figure 5.Results and DiscussionThe fact that the field chambers were neither ventilated norinsulated means that the results reported here are truly indicative of only such construction. Furthermore, as mentioned earlier, a larger structure might theoretically experience higher temperatures, but to exactly what degree is unknown (Rose 1992). However, we believe that much practical information can be learned from studying the data generated by our field exposure study.A Campbell–Scientific Model CR10 datalogger and aModel AM416, 32-channel multiplexer were used to collectand record the temperature data from the 17 thermocouplelocations. The CR10 has a reported accuracy of 0.2 percentover the service temperature range of 67 F ( 55 C) toFigure 4—Placement detail of thermocouplesfor monitoring temperatures inside field exposure chamber and openings in sheathing plywood intended to accept sample specimens.All data were recorded with field exposurespecimens in place. (M95 0057–22A)Figure 5—Set-up of datalogger–multiplexer,temporarily attached to downloadable, portable computer system. (M95 0057–21A)5
Top-of-sheathing and bottom-of-sheathing temperatureswere monitored at the one-third and two-third roof spanlocations midway between the eaves and the ridge(thermocouples T3–T6). The difference in recorded hourlytemperatures between the top-of-plywood locations(thermocouples T3 and T4) and between the bottom-ofplywood locations (thermocouples T5 and T6) seldomexceeded 2 F (1 C). This small difference in temperatureacross the span of the structure may be indicative of theshort span or lack of ventilation. Rose (1992) found thatincreased ventilation with pitched, cathedral ceiling systemsincreased this across-the-span temperature differential. However, subsequent results comparing vented and unvented flatroof systems showed few differences in sheathing temperature between the eaves and the ridge (Rose n.d.). Because ofthe small temperature differential between the two sets ofmidspan locations in our study, temperature readings foreach set of locations were averaged; this average hourlyvalue is henceforth reported. The actual number of hours atgiven temperatures for the black-shingled and whiteshingled exposure chambers for each 12-month periodbetween October 1991 and September 1994 are shown inTables 1 to 6. Figures 6 to 11 depict these data for three locations in the chambers. In these figures, the abscissashows the “exceedence temperature,” which is defined as therange between some minimum temperature limit and thenext higher exceedence temperature limit; the ordinate is thenumber of hours that recorded temperatures at that locationwent beyond the exceedence range. Average values of the3-year test period are given in Figure 12; direct comparisonsbetween the years are given in Figure 13.Comparison of Black- andWhite-Shingled ChambersNote that for most recorded locations, the black-shingledroofs were generally 10 F to 15 F warmer than identicalwhite-shingled roofs on sunny days (Figs. 14 and 15).However, during the evening, the black-shingled roofs alsotended to lose heat faster than did the white-shingled roofs.In obtaining equilibrium with ambient outdoor temperature,both black-shingled and white-shingled roofs generally experienced similar nighttime temperature profiles. Also, notethat on average over the 3-year monitoring period, the plywood of the black-shingled roof systems was annually subject to about 191 h of exposure to 120 F–130 F (49 C–54 C), 116 h of 130 F–140 F (54 C–60 C), 46 h of 140 F–150 F (60 C–66 C), 8 h of 150 F–160 F (66 C–71 C), and2 h above 160 F (71 C) (Tables 1–3). Meanwhile, thewhite-shingled roofs were annually subject to about 63 h ofexposure to 120 F–130 F (49 C–54 C), 9 h of 130 F–140 F (54 C–60 C), and 2 h of 140 F–150 F (60 C–66 C)(Tables 4–6).6Two points are apparent. First, shingle color or, moreappropriately, radiant absorptivity of the shingle was apredominant factor in dictating peak roof sheathing temperatures. Second, the cumulative histograms of top-of-plywoodsheathing temperature (Figs. 6–11) consistently show asaddle between 90 F (32 C) and 120 F (49 C), which mayrepresent the transition from ambient to radiant heating/cooling.Difference in YearlyTemperature HistoriesA comparison of outdoor temperature histories from 1991through 1994 is informative (Figs. 6–11, Tables 1–6).When studying the winter weather/exposure patterns, notethat based on a comparison of the colder periods of outsideambient temperature, the winters of 1991–92 and 1992–93were quite similar in cumulative and minimum cold temperatures (Tables 1–6). Both of these winters were considered average to slightly colder than average. However, thewinter of 1993–94 was considerably colder than normal,which became apparent when comparing the 3-year data.We also noted that the effect of snow cover could often beevaluated by simply monitoring the top-of-plywood temperatures. When snow cover was present, especially a newsnow cover on a previously snow-free roof with eitherblack- or white-shingled chambers, we repeatedly observedthat the top-of-plywood temperature data would hover verynear 32 F (0 C). We assume that as snow melts and refreezes, it acts as a phase-changing medium that stabilizesthe sheathing temperatures. Most importantly, we notedthat trends and/or fluctuations in this top-of-plywood temperature were controlled during snow-covered periods by theair temperature in the interior attic space, which, in turn,dictated the temperature at the bottom of the plywoodsheathing. In other words, the snow cover acted like an insulative blanket in which thermal loads on the roof sheathing were dictated from inside-to-outside heat flux rather thanthe normal outside-to-inside flux.Study of the summer temperature histories readily showsthat the summer of 1994, which was generally consideredaverage to slightly warmer than average, was much warmerthan either the previous summers (Figs. 6–11 and 13).The summer of 1992 was considered cooler than normal(Figs. 6 and 7), and the summer of 1993, considerablycooler than normal (Figs. 8 and 9). In fact, during thesummer of 1993, we did not record an exterior temperatureabove 89 F (32 C), and U.S. Weather Service records indicate that this summer was the second coolest summer recorded in Madison, Wisconsin, in the 20th century. Nevertheless, during the summers of 1992 and 1993, short warmperiods did occur (Fig. 14). In June of 1992, when exteriortemperatures exceeded 90 F (32 C) for several consecutive
Table 1—Temperatures in black-shingled exposurechamber, October 1991–September 1992Table 3—Temperatures in black-shingled exposurechamber, October 1993–September 1994Time (h) at given temperature at various locationsTemp( F)a 20 941155261Time (h) at given temperature at various locationsTempChamberBottomRafter( 401,1601,19471644238223854————— 20 866910————TC (TF – 32)/1.8.Table 2—Temperatures in black-shingled exposurechamber, October 1992–September 1993Table 4—Temperatures in white-shingled exposurechamber, October 1991–September 1992Time (h) at given temperature at various locationsTempChamber( F)InsideOutside 20 100102030405060708090100110120130140150160454
Fire retardants were first used in the United States by the Navy in 1895 (Moreel 1939), but use was discontinued in 1902, in part because of their corrosiveness to fasteners. Preliminary research by Prince (1915) and the Forest Products Laboratory, USDA Forest Service, in the 1930s (Hunt and others, 1930,1931,1932; Truax and others,