Transcription
International Journal of Data Science and Analytics (2021) 24-2REVIEWMeasuring objective and subjective well-being: dimensions and datasourcesVasiliki Voukelatou1 · Lorenzo Gabrielli2 · Ioanna Miliou3 · Stefano Cresci4 · Rajesh Sharma5 · Maurizio Tesconi4 ·Luca Pappalardo2Received: 18 July 2019 / Accepted: 8 May 2020 / Published online: 29 June 2020 The Author(s) 2020AbstractWell-being is an important value for people’s lives, and it could be considered as an index of societal progress. Researchers havesuggested two main approaches for the overall measurement of well-being, the objective and the subjective well-being. Bothapproaches, as well as their relevant dimensions, have been traditionally captured with surveys. During the last decades, newdata sources have been suggested as an alternative or complement to traditional data. This paper aims to present the theoreticalbackground of well-being, by distinguishing between objective and subjective approaches, their relevant dimensions, the newdata sources used for their measurement and relevant studies. We also intend to shed light on still barely unexplored dimensionsand data sources that could potentially contribute as a key for public policing and social development.Keywords Well-being · Objective well-being · Subjective well-being · Well-being dimensions · New data sources · Datascience for social good · Artificial intelligence for social good1 IntroductionEconomists and policy-makers have traditionally consideredgross domestic product (GDP) as a good indicator of well-BLuca Pappalardoluca.pappalardo@isti.cnr.it; info@sobigdata.euVasiliki Voukelatouvasiliki.voukelatou@sns.itLorenzo Gabriellilorenzo.gabrielli@isti.cnr.itIoanna Miliouioanna.miliou@for.unipi.itStefano Crescistefano.cresci@iit.cnr.itRajesh Sharmarajesh.sharma@ut.eeMaurizio Tesconimaurizio.tesconi@iit.cnr.it1Scuola Normale Superiore and ISTI-CNR, Pisa, Italy2ISTI-CNR, Pisa, Italy3University of Pisa, Pisa, Italy4IIT-CNR, Pisa, Italy5University of Tartu, Tartu, Estoniabeing in society, mainly because it is strongly linked withthe standard of living indicators [1]. However, GDP has beencriticized as a weak indicator of well-being and, therefore, amisleading tool for public policies [2]. The Stiglitz Commission [3] in 2009 observed that other statistical tools shouldbe used, complementary to GDP, for the measurement ofwell-being. Therefore, considering that well-being is difficult to be captured only with GDP, researchers with variousbackgrounds, from economists to psychologists, suggestedtwo main approaches to measuring the overall well-being;objective well-being and subjective well-being.Defining objective well-being has always been considereda challenging task, and therefore researchers have focused onexploring its dimensions rather than its definition [4,5]. It isdue to its objective nature that one could claim that objectivewell-being could be measured in terms of GDP. However, itmust reflect both people’s material living conditions and thequality of their lives. In fact, the Organisation for EconomicCo-operation and Development (OECD) [6], the UnitedNations Development Programme (UNDP) [7] and the ItalianStatistics Bureau (ISTAT) [8] have identified six major objective and observable dimensions for its measurement: health,job opportunities, socioeconomic development, environment,safety, and politics. All these dimensions together representthe objective well-being, which is assessed through the extent123
280to which these “needs” are satisfied. The objective approachinvestigates the objective dimensions of a good life, whereasthe subjective approach examines people’s subjective evaluations of their own lives. In 2013, the OECD [9] recognized theimportance of taking into consideration people’s perceivedwell-being, labeled as subjective well-being when investigating the overall well-being. Subjective well-being, also calledhappiness, has been defined by Veenhoven [10], as the degreeto which an individual assesses the overall quality of herlife-as-a-whole favorably. This might as well be different ascompared to GDP, which cannot be representative of societalhappiness. Indeed, GDP explains only a small proportion ofits variations on humans [11], and it might be different frompeople’s perceptions of their well-being [12]. Therefore, subjective well-being has been traditionally captured throughstudies based on data collected by self-reports. These studies highlight five main dimensions of subjective well-being:the role of human genes, which seem to be fairly heritable[13–21], universal needs, meaning basic and psychologicalneeds [22–24], social environment, such as education andhealth [25–29], economic environment, including a lot ofresearch on income [30–34], and political environment, suchas democracy and political freedom [35,36].Traditionally, both objective and subjective well-being aremeasured through surveys of household income and consumption [37]. Although these surveys have been consideredaccurate and valid, they bring some considerable disadvantages. For example, they cannot provide constant updates ofwell-being to policy-makers, and they have high costs to beconducted, making it difficult for many developing countries to estimate well-being frequently. The last few yearshave witnessed a drastic change in the approaches used tomeasure well-being. Researchers of different disciplines propose several innovative data sources and methods, whichcould potentially overcome the limitations of the traditionalmethods for the individual and collective well-being measurement, both objective and subjective.To support research in this direction, the European projectSoBigData [38] has created a virtual environment within aresearch infrastructure that provides theoretical knowledge,data, and innovative methods to scholars that want to addresschallenging questions involving both objective and subjective well-being.Therefore, in line with the purposes mentioned above andthe support of SoBigData, the aim of this paper is to providethe theoretical background on objective and subjective wellbeing, including their relevant dimensions. Additionally, thearticle seeks to present to researchers the new data sourcesused for capturing well-being, as well as discuss indicativeexisting studies.We believe that this study offers great value to the scientific community and especially to researchers interested in“Data Science for Social Good” (DS4SG) or similarly “Arti-123International Journal of Data Science and Analytics (2021) 11:279–309ficial Intelligence for Social Good” (AI4SG) [39], since itcould work as a reference point for adequate measurementof well-being with the use of innovative data sources andtools. In particular, at this critical moment that the globalsociety is under financial and political crisis and instability, policy-makers need frequent updates of well-being. Thiscould facilitate them to react on time on applying the rightpolicies to prevent detrimental societal effects and contributeeffectively to societal progress.The remainder of this paper is organized as follows: It isdivided into two main sections, as suggested from the literature, i.e. objective and subjective well-being. In particular,Sect. 2 is dedicated to objective well-being and Sect. 3 is dedicated to subjective well-being. For both sections, we providea theoretical background on objective and subjective wellbeing and their dimensions respectively. We then provide thedata sources used for monitoring well-being. Besides, wepresent essential studies on well-being; to present them in anorganized flow, we categorize the presentation of the studiesby matching each well-being dimension separately with eachdata source. Finally, in Sect. 4, we provide a discussion onthe study, highlighting the opportunities for future researchon well-being.2 Measuring objective well-beingSuggesting a single definition of objective well-being is asubstantial challenge, mainly due to its multi-dimensionality.Therefore, researchers have focused on carefully specifying its objectively measurable dimensions [4,5]. Objectivewell-being is traditionally captured through surveys, such ashousehold income and consumption surveys [37]. However,usually, such surveys are very costly and time-consuming[40], making it difficult for many countries and global institutes to update their estimates frequently. Therefore, the lastfew years have witnessed a change in the way of measuring objective well-being. In particular, researchers ofvarious disciplines propose several methodologies to measure individual and collective objective well-being, based ona combination of new data sources and traditional surveys[41–44]. The United Nations also stimulate this change ofstudying well-being in two recent reports, where the usageof new, mostly big, data sources, is encouraged for the investigation of patterns of phenomena related to people’s healthand well-being [45,46].2.1 The dimensions of objective well-beingDuring the last years, public institutions and non-governmental companies have worked on identifying dimensions thatare considered essential for the improvement of the societalwell-being and its comparison between countries and years.
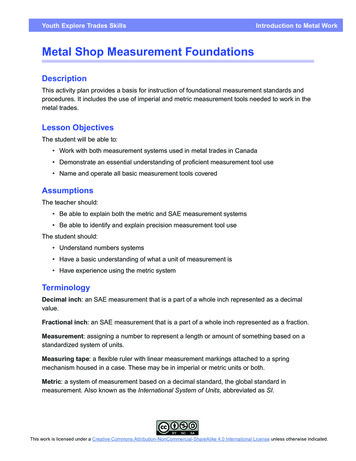
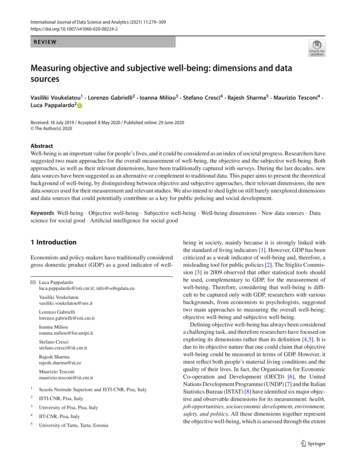
International Journal of Data Science and Analytics (2021) 11:279–309281Fig. 1 The figure relates thesources of data (left) with thedimensions of the objectivewell-being (right)For example, the Organisation for Economic Co-operationand Development (OECD) has identified 11 essential topics labeled as OECD well-being framework [6]; the UnitedNations Development Programme (UNDP) has identified 17sustainable development goals, labeled as SDGs [7]; and theItalian Statistics Bureau (ISTAT) has created an ambitiousproject named “Benessere Equo e Sostenibile” (BES) thatstands for “Fair and Sustainable Well-being” [8]. From theinitiatives mentioned above, it is evident that for differentinstitutions, well-being dimensions might be different, sometimes vague, and statistically hard to be captured. Therefore,based on the aforementioned official authorities, we suggestthe following concrete and measurable dimensions of wellbeing (Fig. 1).2.1.1 HealthHealth status represents an essential factor for people’swell-being, as shown by the WHO Commission on Macroeconomics and Health in 2001 at global level [47], and by theLisbon Strategy for Growth and Jobs in 2000 [48]. Healthbrings together many other benefits, from job opportunities to social relationships, from reduced health care coststo an increased life expectancy. Indeed, there have beenremarkable gains in life expectancy over the past 50 yearsin OECD countries [49], due to the health care spendinggrowth, lifestyle, educational, and environmental changes.Chronic (non-communicable) diseases, such as cancer, diabetes, and chronic respiratory conditions, are nowadays theprimary disability and mortality factors in OECD countries.Fortunately, some indicators can help prevent the diseasesmentioned above. For example, the number of people whoare driving carefully, who are non-smokers or who do notdrink a large amount of alcohol, are risk-indicators, which, iftaken into consideration, could contribute to an improvementin the health status of a territory.2.1.2 Job opportunitiesThis is a crucial dimension of well-being since it has obvious economic and societal benefits, contributing to people’shealth and societal, political, and economic stability. The jobopportunities dimension is composed of three main determinants: employment rate, quality of work, and work–lifebalance. The employment rate is a crucial aspect since individuals in countries with a high level of employment, arewell connected in society. In particular, it is a proxy usedby policy-makers to avoid poverty and social exclusion.The second determinant is the quality of work, in terms ofobjective working stability, retribution, skills, and safety atwork, which might show some differences between differentworking environments. Moreover, work-life balance is thedeterminant that mainly aims to capture the balance betweenwork and life. In the OECD countries, a full-time workerdevotes 62% of the day on average (15 hours) on personalcare (e.g., eating, sleeping) and leisure (e.g., socializing withfriends and family, hobbies) [50]. This determinant is mainlycreated to capture women’s work-life balance. Indeed, the123
282quality of a country’s employment is measured by the balance women have between family care and paid work.2.1.3 Socioeconomic developmentWhile socioeconomic indicators alone do not suffice to represent societal well-being, it cannot be doubted that theypositively influence it. The variables that contribute to itsmeasurement are income, wealth, consumption expenditure,housing conditions, and possession of consumer durables,and it can implicitly influence access to university, healthcare, and more. In particular, the Organization for EconomicCo-operation and Development (OECD) [6] and the ItalianStatistics Bureau (ISTAT) [8] suggest two main determinantsthat constitute the overall economic well-being: availableincome and wealth, and consumption expenditure.In a market economy, income measures the purchasingcapacity of individuals, and it is thus an essential predictorof economic well-being. Wealth, on the other hand, takesinto account savings, monetary gold, stocks, securities, andloans [51]. Therefore, wealth could be considered an essentialsource of revenue, which could make people less vulnerableto difficult economic situations that might affect their life.Additionally, consumption expenditure is a direct estimateof the goods and services that contribute to determining theliving conditions of individuals. Unlike income, consumptionexpenditure can contribute to making interpersonal comparisons, since it captures whether each individual can acquireher desired goods and services.2.1.4 EnvironmentA healthy natural environment is essential for all individuals’well-being in society. Clean water, clear air, and uncontaminated food are examples of goods that can only be possiblein an environmental context where humans’ productive andsocial activities are made with respect to the environment andits natural resources. For the reasons mentioned above anddue to the recent environmental crisis, the United Nationsset sustainable environmental goals [7], such as Clean Waterand Sanitation, Climate Action, and more. Similarly, ISTAT[8] suggests five determinants for describing the interactionsbetween society and the environment that are connected.These determinants are quality of the water, quality of theair, quality of the soil and the land, biodiversity, and matter,energy, and climate change. Finally, the “OECD Environmental Outlook to 2050” projects the number of prematuredeaths associated with exposure to PM10 and PM2.5 toincrease from just over 1 million worldwide in 2000 to about3.5 million in 2050 [52]. Therefore, the more these determinants are taken into consideration by policy-makers andby citizens’ activities, the more the citizens can contribute toradical changes for the protection of societal well-being.123International Journal of Data Science and Analytics (2021) 11:279–3092.1.5 SafetyIt includes the risk of people being physically assaulted,falling victims, and suffering from other crimes, such aseconomic loss, physical damage, and psychological posttraumas stress. Reducing violent crime, sex trafficking,forced labor, and child abuse are clear global goals, as suggested by the United Nations [7]. Besides, the Italian BESproject [8] suggests that safety is characterized by two determinants: criminality and violence.Criminality is one of the most common security threats indeveloped and emerging countries, and it has both a directand indirect impact on people. It directly influences individuals’ health (physical and mental) and economic situation.According to the latest OECD data, the average homiciderate in the OECD is 3.6 murders per 100,000 inhabitants[53]. Indirectly, criminality has an impact on non-victims’well-being when being on victims’ social network or by newsspread on (social) media.Another determinant is violence suffered inside and outside the family and it has both a direct and indirect impact onpeople. In particular, victims suffer from the direct effects,which can last for long periods, if not for the whole life,depending on individuals’ ability to manage their daily life,medical expenses, dependence on others, and capacity toachieve happiness. Indirectly, it causes insecurity and anxiety, which brings difficulties in their daily activities [54].2.1.6 PoliticsThis dimension is also essential for objective well-being.Today, due to the economic crisis, more than ever, citizensdemand greater transparency from their Governments andthe Public Institutions. Fair civic and political participation,as well as transparency, do not only contribute directly towell-being but also indirectly since they allow greater efficiency of public policies, a lower cost of transactions, andthe minimization of the risk of fraud. Therefore, two determinants fall under this category, which are associated withthe Public Sphere as a driver of the individuals’ well-being,on either local or national level: civic and political engagement, and trust and social cohesion. Voter turnout is the bestexisting means of measuring civic and political engagement,and is measured as the percentage of the registered populationthat voted during elections. According to OECD data, voterturnout, is averaged 69% in OECD countries, which showsthat not everyone exercises the voting right [55]. Regardingtrust and social cohesion, OECD suggests public engagement(e.g., stakeholder engagement) for developing regulations[55]. If citizens have the possibility to participate in the development of laws and regulations, it is more likely that they willtrust the government institutions and they will comply withthe societal rules.
International Journal of Data Science and Analytics (2021) 11:279–309Table 1 Pros and cons for each data source used for the measurementof objective well-beingData sourceProsConsCDRsTemporal and socialdimensions, worldwide diffusion,repeatabilityNot publicly available,sparsity,geographicallyimpreciseGPS andtransportationCoverage of ruralareas, unbiased andclassified, real-timemonitoringPrivacy issues, indoorspatial inaccuracySocial MediaMeasuring socialdynamics, publiclyavailablePrivacy issues,overrepresentation,social desirability biasCost effective,applicable formultiple studies,prediction ofnear-term risk ofeventsNot publicly available,not necessarilyrepresentative of thepopulation, limitedtime slotsVariety of subjectdomains, range oftargets, 24/h updated,archived historicalnewsGatekeeping bias,coverage bias,statement biasModeling of dynamichousehold behavior,control time-invariantcharacteristics, longterm coverage,quality improvementof HICPDependency onretailer’s permission,legal constraintsWeb SearchPublicly available,speed, convenience,flexibility, ease ofanalysisPopulation size variesacross domains, hardidentifying relevantqueriesCrowdsourcingLarge number of data,speed, relative lowcostRisk of low-qualityresults, trade-offbetween quality andcostHealth andFitnessNewsRetailScanners2.2 Data sources for monitoring the dimensions ofobjective well-beingFigure 1 describes the new data sources (left) that have beenused to estimate one or more dimensions of objective wellbeing (right). The presence of a link in Fig. 1 between adata source and a dimension indicates that there are papersin the literature on monitoring that dimension with that datasource. In this section, we describe, for each data source, itsfeatures (e.g., the process of data collection, its biases andlimitations) and the main works in the literature that use it tomeasure several dimensions of objective well-being. Table 1provides a summary of the data sources used, highlightingthe pros and cons of each one. We refer to a link between adata source and a dimension using a letter-number notation.283Table 2 Example of Call Detail Records (CDRs). Every time a usermakes a call, a record is created with timestamp, the phone tower servingthe call, the caller identifier and the callee identifier (a). For each tower,the latitude and longitude coordinates are available to map the tower onthe territory (b)(a) TimestampTowerCaller2007/09/10 23:34364F804604F803312007/10/10 01:12362B013599H801252007/10/10 01:43382B199356W1199.(b) 83848.22-1.52.For example, B3 indicates the link between GPS data (B) andsocioeconomic development (3).2.2.1 CDRsMany works in the literature are based on the analysis ofmobile phone data, the so-called CDRs (Call Detail Records)of calling and texting activity of users, because they guaranteethe repeatability of experiments in different countries andon different scales given the worldwide diffusion of mobilephones [56].CDRs collect geographical, temporal, and interactioninformation on mobile phone use [57–62], hence providing acomprehensive picture of human behavior at a societal scale.Each time an individual makes a call, the mobile phone operator registers the connection between the caller and the callee,the duration of the call, and the coordinates of the phone towercommunicating with the served phone. Table 2 illustrates anexample of the structure of CDRs.Note that CDRs suffer from different types of bias [63,64].For example, the position of a user is known at the granularitylevel of phone towers, and only when they make a phonecall. Moreover, phone calls are sparse in time, i.e., the timebetween consecutive calls follows a heavy tail distribution[65,66]. In other words, since users are inactive most of theirtime, CDRs allow reconstructing only a subset of a user’sbehavior.CDRs are used to monitor several dimensions of wellbeing, notably health (A1), job opportunities (A2), socioeconomic development (A3), environment (A4), and safety(A5).CDRs provide one of today’s most exciting opportunitiesto study human mobility and its influence on disease dynam-123
284ics (A1). Many researchers use mobile phone data for publichealth, as the analysis of individual and population mobilitypatterns is more objective and with finer spatiotemporal resolution in comparison to traditional methods. Furthermore,mobile network data can also provide insights into humanbehavior that can support the assessment and monitoring ofthe health of specific communities at risk, thus paving theway toward improved health promotion and prevention [67].Taking into consideration that the spatiotemporal evolutionof human mobility and the related fluctuations of populationdensity are essential drivers of disease outbreaks, Finger et al.[68] use CDRs to track the cholera outbreak in 2005 in Senegal. Findings show that a mass gathering taking place duringthe initial phase of the outbreak has an essential impact on thecourse of the disease. Besides, Kafsi et al. [69] contribute tothe fight against epidemics of infectious diseases using CDRsprovided by France Telecom-Orange. They use 2.5 billioncalls made by 5 million users in the Ivory Coast, recordedover 5 months, from December 2011 to April 2012, to studyand model behavioral patterns of the affected population andpropose several strategies for personalized behavioral recommendations to reduce the infections. Lima et al. [70] usethe same data set to build a model that describes how diseasescirculate the country as people move between regions, andthey enhance the model with a concurrent process of relevantinformation spreading. This process corresponds to peopledisseminating disease prevention information, e.g., hygienepractices, vaccination campaign notices, and others, withintheir social network. Finally, Madan et al. [71] use CDRs andmobile phone-based co-location sensing to measure characteristic behavior changes in symptomatic individuals. Thesebehavior changes are reflected in their total communication, interactions with respect to time of day, diversity, andentropy of face-to-face interactions and movement. Usingthese extracted mobile features, they manage to predict thehealth status of an individual, without having actual healthmeasurements from the subject.Besides, researchers use CDRs to study job opportunities (A2). Pappalardo et al. [72] use CDRs to study thelink between human mobility and the employment rate ofFrench cities, finding a strong correlation between measuresof mobility entropy and the unemployment rate in urban environments. Toole et al. [73] show that changes in the callingbehaviors of individuals, aggregated at regional level, canimprove forecasts of macro unemployment rates. Sunds et al.[74], use CDRs to create a model which predicts unemployment with a 70.4% of accuracy. They also provide promisingsupport to the collection of data for populations in developing countries, which are often under-represented in officialsurveys.Most of researchers use CDRs to investigate socioeconomic development (A3). A seminal work analyzes landlinecalls and a nationwide mobile phone data set to show that,123International Journal of Data Science and Analytics (2021) 11:279–309in the UK, regional communication diversity is positivelyassociated with a socioeconomic ranking [75]. Other worksaddress the issue of mapping poverty [76] and other socioeconomic determinants [77] with mobile phone communicationdata, combined with airtime credit purchases data in theIvory Coast [78]. Blumenstock et al. [79,80] show preliminary evidence of a relationship between individual wealthand the history of mobile phone transactions. Frias-Martinezet al. [81–84] analyze the relationship between human mobility and the socioeconomic status of urban zones, presentingwhich mobility indicators correlate best with socioeconomiclevels and building a model to predict the socioeconomiclevel from mobile phone traces. Pappalardo et al. [85] analyzemobile phone data and extract meaningful mobility measuresfor cities, discovering an interesting correlation betweenhuman mobility aspects and socioeconomic determinants.Lotero et al. [86] analyze the architecture of urban mobilitynetworks in two Latin-American cities from the multiplexperspective. They discover that the socioeconomic characteristics of the population have an extraordinary impact on thelayer organization of these multiplex systems. In a successivework, Lotero et al. [86] analyze urban mobility in Colombiarepresenting cities by mobility networks. They encode theorigin-destination trips performed by a subset of the population corresponding to a particular socioeconomic status andthey show that spatial and temporal patterns vary across thesesocioeconomic groups. Amini et al. [87] use mobile phonedata to compare the human mobility patterns of a developingcountry (the Ivory Coast) and a developed country (Portugal). They show that cultural diversity in developing regionscan present challenges to mobility models defined in less culturally diverse regions. Smith-Clarke et al. [88] analyze theaggregated mobile phone data of two developing countriesand extract features that are strongly correlated with povertyindexes derived from official statistics census data.Moreover, researchers use CDRs to monitor the qualityof the environment and its impact on people’s lives (A4).For example, Picornell et al. [89] evaluate the populationexposure to NO2 on a research published recently. They useCDRs from one of the three most important Spanish mobilephone network operators (MNOs), with around 30% market share. The analysis is conducted for the capital of Spain,Madrid, for the 17th of November 2014, as a typical dayin terms of population mobility and NO2 levels. Comparing the results with traditional census-based methods, theydemonstrate relevant discrepancies at disaggregated levelsand underline the importance of integrating CDRs data forthe evaluation of population exposure to NO2 . Lu et al. [90]study people’s behavior affected by climate stress. In particular, by exploring the individuals’ behavioral response to theCyclone Mahasen, which struck Bangladesh in May 2013,they find out that anomalous patterns of mobility and calling frequency correlate with rainfall intensity, showing the
International Journal of Data Science and Analytics (2021) 11:279–309affected regions and when the storm moves. Lu and Bengtsson [91,92] analyze the movement of 1.9 million mobilephone users before and after the 2010 Haiti earthquake, andthey show that CDRs can be a valid data source for estimatesof population movements during disasters. Wilson et al. [93]build a tool within nine days of the Nepal earthquake of 2015,to provide spatiotemporally detailed estimates of populationdisplacements from CDRs based on movements of 12 millionmobile phones users. Nyarku et al. [94] use CDRs to explorewhether mobile phones could be reliably used to monitorindividual exposure to selected air pollutants when movingbetween indoor and outdoor microenvironments. In particular, data are collected from two BROAD life mobile phones,which are equipped with sensors for direct measurements ofair pollutants. The two phones bring similar results, both forparticles and formaldehyde, making them potentially suitable for applications in polluted environments, even if thereseem to be some exceptions where the readings of the twophones do not correspond well to each other. Liu et al. [95]map personal trajectories using mobiles in an urban environment to assess the impact of traffic-related air pollutionin society. They estimate traffic pollution exposure to individuals based on the exposure along the individual humantrajectories in the estimated pollution concentration fields byutilizing modeling tools and manage to identify trajectorypatterns of particularly exposed human groups. In addit
quality of their lives. In fact, the Organisation for Economic Co-operation and Development (OECD) [6], the United NationsDevelopmentProgramme(UNDP)[7]andtheItalian bjec-tive and observable dimensions for its measurement: health, ent, safety, and .