Transcription
Cost Feasibility Analysis for Embedded System Development and theImpact of Various Methodologies on Product Development CycleAnkur Agarwal, Ravi Shankarankur@cse.fau.edu, ravi@cse.fau.eduCenter for System IntegrationDept of Computer Science and EngineeringFlorida Atlantic University, Boca Raton, FL-33431AbstractThe cost and the time-to-market for a product will increase exponentially if innovations are not brought and deployed intothe product development cycle (PDC). This is due to the fact the system complexity is increasing exponentially with time.This increasing complexity results from introduction of new protocols, higher radio frequencies, and increasing number ofapplications, among others, in the case of mobile devices. Such factors have led to the exploration of the multi-corearchitecture. The software (SW) and hardware (HW) concurrency, and need for optimization, in such architectures, willfurther complicate the product development process. Therefore, it is imperative that we introduce new and innovative waysto enhance productivity. Researcher have proposed new concepts such as executable specifications, component baseddesign, system modeling language (SysML), model driven design (MDD), software decomposition, abstract performanceevaluation, system level verification, field programmable gate array (FPGA) based network-on-chip (NOC), and abstractconcurrency modeling. These proposed modeling, design and development techniques aim at increasing productivity byintroducing leading edge design methodologies into PDC. In this paper we present a cost model that aims at understandingthe current PDC and at evaluating the impact of new technologies on PDC. We focus on cost and product developmenttime, and compare them for the existing PDC and the new PDC that we have conceptualized. We refer to this new PDC as“One Pass to Production” (OPP). This cost model may also help one identify potential bottlenecks and areas for furtherautomations.Key words: Design Productivity, Feasibility Analysis, System Design Flow, Software Design Flow, FPGA Design FlowTools and Languages: Excel Sheet, The GUI is being developed in Microsoft Visual Studio.NETIntroductionSystem complexity, driven by both increasing transistor count and customer need for increasingly savvy applications, hasincreased so dramatically that system design and integration can no longer be an after-thought. As a consequence, systemlevel design, long the domain of a few expert senior engineers, is coming into its own as a discipline. For the field to growand enhance engineering design productivity, many key concepts have had to be adopted from other domains. Advances insemiconductor technologies have led to continual and rapid transistor scaling; this will soon facilitate the integration of abillion transistors on a small size integrated circuit. Product development time will increase from the current two years tofive years or more, thanks to the increasing hardware complexity and the concomitant increasing sophistication of theapplications demanded by the consumer. In order to maintain the product development time at two years or less, manyconcepts, such as architecture platforms, software design reuse, and model driven architecture, have been recently proposedand implemented. However, an integrated approach that synergistically combines the stages of specification, design,development, and prototyping has been missing. Our research center “Center for System Integration” has undertaken toaddress this.Under such scenario, companies are looking for ways to get the most out of their design resources. In keeping up with themarket pressure new technologies, languages, design methodologies and tools have been introduced. It is seen that a newtechnology is introduced in form of a language, which is represented in form of a design methodology after it gets matured.A successful design methodology is then later represented in form of an EDA tool. Design, development and verificationengineers are then able to use these tools in their cutting edge produced design cycle (PDC). For example, SystemC – ahardware-software co-design language was introduced back in. New design methodologies were developed aroundCopyright 2008 Center for Systems Integration, Florida Atlantic University.
SystemC involving the design flows for hardware/software co-design, co-development and co-verification process. Newtools such as, platform architecture, model designer, virtual platform designer, catapultC, NCSim simulator among otherswere introduced in order to support these design methodologies. It is expected that future design methodologies mustsupport an increase in the amount of automation, design reuse and at the same time these design methodologies must beable to address the design concern at the highest level of abstract – System Level. Customers in today’s competitive marketenvironment are resistant to even “moderate” increase in cost; and the rate of doubling functions per chip (Moore’s Law) isslowing [9]. Thus semiconductor manufacturers and systems companies must seek a new model to deliver the same costper function reduction that has fueled the industry growth.Today, embedded system companies have to bet on consumer preferences two years hence and start developing a product tomeet that demand which may not come to pass. A wrong bet may adversely the fortunes of a company. Therefore, theproduct design cycle needs to be further shortened, not just maintained at 24 to 30 months. Hence, more innovation isneeded, especially at the earlier stages, since errors introduced there get magnified at later stages. As an example, NASAestimates that an error at the specification stage will require 138 times the effort to fix it at the prototyping stage and 536times the effort to fix it in the field, as it would at the. It is expected that the future systems will have an increasing role ofdesign automation, reusability, and componentization, thus increasing the market share for the EDA industry.2. Impact of Cutting Edge Research Areas on Product Development CycleIn this research we have analyzed the bottleneck and pitfalls in the current design methodology. This analysis has beencarried out based on Cocomo cost and time analysis for software product development. We have further extended this studyto represent the overall cost of PDC which includes hardware, software and RF cost. From this analysis we have focused onthese resource consuming phases in a PDC and have researched innovative and multidisciplinary approaches for enhancingthe productivity of system design. This research also takes advantage of many system engineering innovations that theindustry has already evolved and applies them to requirement specification, design, development and prototyping phases.2.1. Requirement Analysis2.2. Specification ProductivityEliminating errors in requirements phase can lead to substantial reduction in development cost and time. It is veryimportant that as requirements pass through different phases of product development they are not misinterpreted andapplied incorrectly or omitted. This can happen due to language grammar barrier, ambiguity, and incorrectness in therequirements. We show a process which implements the use of executable specification (digitization of requirements). Wehave focused on communication between user, marketing team, architects and developers with the use of UML, XMI, Javabased Animation.2.3. Executable Specification2.4. XML2.5. Concurrency ModelingDesigners exploit design reuse to enhance system design productivity. Integration of pre-designed reusable blocks may failif these blocks execute in parallel, share resources, and/or interact with each other. Such concurrency issues, if notaddressed, may be detrimental to normal functioning of the system and may lead the system into a deadlock or a livelockstate. Multiprocessor architectures, recently introduced to extend the applicability of the Moore’s law, depend uponconcurrency and synchronization in both software and hardware to achieve that goal. System design integration andverification approaches will not be cost-effective in exposing concurrency failures as they are intermittent; this can becostly (significantly increased time to market and field failures). One would have to develop abstract concurrency modelsand do exhaustive analysis on these models to test for concurrency problems. We have conceptualized a systematicapproach that models concurrency by using an abstract symbolic modeling language to build a systematic high levelconcurrent system model; we also use an exhaustive analysis and verification tool to confirm that the system is devoid ofconcurrency failures. We propose that concurrency issues must be modeled after the system specification step and beforedefining system components. Concurrency modeling will help us to design reusable design block, thus is likely to enhancesystem design productivity.2.6. Automated Code GenerationUnified Modeling Language (UML) provides is the ability of modeling at different levels of abstractions. Since C isobject oriented, a modeling language such as the UML can be used to develop object modeling based systems.Accordingly, UML satisfies the basic requirements to link specifications with implementation: visualization,modularization and abstractions. The Unified Modeling Language provides model visualization through a variety ofdifferent types of diagrams. The UML diagrams are divided into three main categories: interaction diagrams, structuraldiagrams, and behavioral diagrams. Interaction diagrams show the existing relationships as well as the exchange ofmessages within the system. Structural diagrams show the building blocks of the system. Behavioral diagrams show thesystem’s reactions to external and internal events. UML provides thirteen different diagrams. The usage of these diagramsdepends on what is being visualized. For instance, use case diagrams show the services that actors can request from the
system, while sequence diagrams show the exchange of messages among the different modules in the system, and classdiagrams show real-world entities and their relationships.2.7. System Modeling Language2.8. Component Based Design2.9. Abstract Performance ModelingWith the continuing exponential growth of circuit complexities, early planning and understanding of the different trade-offsearlier in the design cycle becomes very critical, especially given the huge cost of correcting an early stage mistake later on.Traditionally, in this stage, a senior engineer (‘Architect’) with expertise and/or background in all the related engineeringdisciplines uses a spread sheet type of tool to conduct ‘What-If’ scenarios and decide on various component technologies(RF, Applications, OS, Architecture, Communication, and VLSI) that, based on technology projections and legacyexperience, will lead to a new generation product two years hence. However, today’s Architect is burdened with componenttechnologies that are rapidly advancing and their integration into a synergistically working system is a virtual impossibility,unless of course certain system engineering principles are applied and supported a priori.This software is for designing and analyzing systems on a multi-domain environment. The simulations on MLDesignerprovide performance parameters, such as throughput, latency, resource usage, and network load. These parameters can beadded with performance parameters extracted from hardware implementation such as, power consumption, maximumfrequency of operation and cost (in terms of silicon area) to generate a specification set for different configuration of theNOC. This specification set can be used by the system architect to select the NOC configuration. Thus, system performanceevaluations and what-if scenarios can be performed in the beginning of the design phase. This meets the requirements of thesystem to be designed without the need to invest time in designing the communication backbone from scratch.2.10.Layered ArchitectureLayered architecture is an effective way of dividing and conquering a problem. We have seen it working in an effectiveway in the of open system interconnection (OSI) model. It provides a way to separate the concerns of each different domainthus providing an effective solution to a domain specific problem. Such a platform can separate domain specific issues inseparate layers, which will allow for more effective modeling of concurrency and synchronization issues, in an attempt todevelop an optimized system. It can also be argued that this approach will provide us with a scalable solution in addressinginter-domain specific issues. We have defined a NOC based layered architecture for future embedded systems.2.11.Software DecompositionMulticore Architectures cannot be fully and effectively utilized with sequential model based software. Software cannot bere-written entirely in order to utilize next generation multicore architectures. We have developed a 10-Step methodologywhich effectively reverse engineers existing (Legacy) software to convert it into concurrent model based software. The aimis to solve embedded software and real-time concurrency issues while partitioning code over multiple concurrentarchitectures. We utilize top-down representation, bottom-up annotation, and middle out analysis to effectively implementthis methodology. We perform performance annotation by analyzing computation, communication and concurrency cost.2.12.SystemC : Hardware Software Co-design2.13.System Level VerificationTypically, about 50% of the product design cycle time was spent on testing the product [12] [14]. Thus, more automation inthe verification and testing phases of circuit design became inevitable. This reduced the product design time and effort.Several test methodologies have evolved during in past. This included assertions, RTL test benches, verification languages(such as Vera), fault coverage and automatic test generation. It also saw the introduction of formal verification methodswith languages such as Sugar [15] [16]. However, these more abstract and early verification tools are yet to be adoptedwidely.2.14.NOC ArchitectureNOC communication sub-system is likely to enhance the productivity of system design phase as it provides an architecturalplatform for managing complexity and incorporate a reusable communication backbone. The NOC design comprises of twolayers: network protocol layer and communication backbone layer. One of the aims of this NOC implementation is todevelop IP libraries for packet-switched communication backbones for multi-core systems. This reduces development timespent on the communication backbone for multi-core system, the cost of designing the final product. The developedlibraries have reusable, customizable and parameterizable components.2.15.2.16.2.17.2.18.2.19.Model Driven ArchitectureResource EstimationAnnotationAutomating Overall OPP ProcessIntegrating Legacy Applications
3. Common Factors Affecting Cost Model for Embedded SystemFor developing an overall system cost model, we have partitioned the cost model into two different sub-models for software(SW) and hardware (HW). The final system cost model has been evolved from SW and HW cost model. For theconventional methodology (referred to here as Non-OPP methodology) has been developed based on the fact that it takesabout two years time to develop an embedded system. We refer to our design methodology as OPP design methodology.For developing this cost model, we have assumed various parameters. Some of these parameters are common to both OPPand Non-OPP design methodologies while others are specific to a particular design methodology. The parameters which arecommon to both design methodologies – OPP and Non-OPP have been listed below:3.1. Engineer’s CostWe assumed the following: the cost of an engineer is about 150K per year (including all the fringe benefits; there areabout 230 working days in a year (365-52-52-31); and thus, the cost of an engineer per day is about 652.3.2. System Complexity FactorWe know that the embedded system complexity is increasing every year as per the Moore’s law. In today’s technology thenumber of transistors in a chip and hence, the functionality of an embedded device doubles in approximately three yearsinstead of eighteen months. Thus, approximately there is a 33% increase in the complexity of embedded devices. Thisincrease in complexity can be realized in form of various advances that embedded systems are going through. Some ofthese advancements include (1) Introduction of new protocols. (2) More complex user interface. (3) Higher Quality ofServices. (4) Higher radio frequencies (5) Multi-core architectures (6) Increasing Power Consumption (7) Advance videoapplications (8) High support for user services. This has increased the software component is the embedded devices and hasresulted into the research of new domains viz. software decomposition for multi-core architectures, system verification,managing power consumption on embedded system devices among others. Thus, we represent this increase in complexityby a “Complexity Factor” in the cost model. We have assumed that the complexity increase every year. The rate of thisincrease in complexity for five years is shown in Table 1.Table 1: Complexity Factor for next five years2nd YearFactor1st YearComplexity Factor1.001.333rd Year1.674th Year2.005th Year2.67Thus, it is expected that the design time and the cost of embedded system would increase in accordance with thiscomplexity factor if new innovations are not bought into the PDC.3.3. Management and Co-ordination FactorAs the design complexity increases, a company will have to devote more resources in handing with this increase in thedesign complexity. Thus, it is likely that an increasing amount of management of the product development team and anequally increasing amount of co-ordinations among various engineers in a team might be needed. We represent thisparameter in terms of “Management and Co-Ordination Factor”. We represent this parameter in Table 2.Table 2: Management and Co-ordination Factor for next five years2nd YearFactor1st YearManagement and Co-ordination Factor0%5%3rd Year10%4th Year20%5th Year40%As this factor increase with time the cost and time of product development is likely to increase declining the system designproductivity.4. Cost Analysis for Non-OPP Design MethodologyA high level system design flow include requirement analysis, specification, architectural selection, RF Design anddevelopment, HW/SW Co-design, HW/SW co-development, HW/SW co-verification and virtual prototyping. It is a myththat the product is designed in different phases of PDC: specification, design, development and verification. But the realityis that the most of these phases are overlapping with each other. This is due to various reasons. (1) Sometimes a newspecification/requirement has to be accommodated in the middle of the design phase. Thus, we re-do some of thespecification and design – an overlap between specification and design phase. If this new requirement comes during thedevelopment phase then we will see an overlap among specification, design and development phase. (2) We usually startthe verification process early in development phase. In particular, unit testing is done before the complete developmentphase, thus providing an overlap between development and verification phase. (3) An error or a glitch in theverification/testing phase pushes the product to the design phase followed by the development and then verification phase.
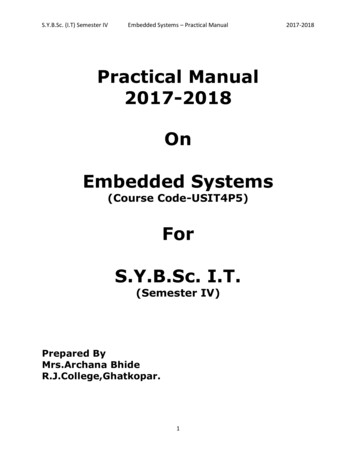
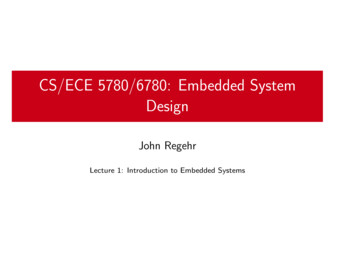
This in reality instead of sending 100% time in the design flow shown above, we usually send 150% time. This projectmyth is shown in Figure 1(a) and the project reality is shown in Figure 1(b).EFFORTEFFORTTIMETIMEFigure 1(a): Project Effort MythFigure 1(b): Project Effort RealityIn table 3 we have we have summarized this project reality in terms of the time spent during each phase of PDC. It can beseen from the table 3 that the final engineering time spent (in days) is about 720 for developing an embedded system for thecurrent year.Table 3: Product Development time with Current Design methodologyDesign PhasesPercent Time SpentRequirement Analysis10Specification15Architectural Selection15RF Design & Development20HW-SW Co-Design15HW-SW Co-Development30Hw-SW Co-Verification30Virtual Prototyping15Total150Eng. Time (in Days)487272967214414472720But there is always some amount of concurrency involved in design phases of PDC. For example, RF design anddevelopment can be carried out at the same time as the co-development of HW-SW. But such design concurrency is limitedin its nature as these design phases are dependent upon each other. Table 4 lists our assumption on this design concurrencyfactor we have chosen.Table 4: Design Concurrency Factor for next five yearsFactor1st YearConcurrent Engineering Factor1.52nd Year1.53rd Year1.54th Year1.55th Year1.5We have chosen the value of this parameter to be constant as this value does not depend on the increase in complexity eachyear. Thus, this concurrent engineering factor must be accounted in the development time for PDC. Along with concurrentengineering factor, management and co-ordination (M&C) factor also needs to be included (by adding with the total timegiven in table 3) while calculating the actual product development time. This M&C factor (in table 2) is 0% for the firstyear, thus, will not effect the design time. Thus the total time for and embedded product development is given by equation1.Final Pr oductDevelopmentTime TotalTime Management & CoordinationTime (1)ConcurrentEngineeringFactorApplying equation (1) we get the final product development time to be 480 days. We can realize that these 480 daysrepresents a true scenario of embedded industry. This is due to the fact there are about (365-52-52-30) working days in ayear. We are excluding weekends and possible leaves allocated to an engineer. Thus, a two year development time can berepresented as about 465 days. This number is very close to what we have calculated from our calculation (480), thus alsoverifies the correctness of our methodology adopted for calculating the cost model.We have used the above discussed methodology to extrapolate the number for next five years. These numbers are tabulatedin table 5. In table 5 column TS represent the percentage of Time Spent and ET represents the Engineering time in Days.
Table 5: Predicted Product Development time with Current Design methodologyDesign PhasesRequirement AnalysisSpecificationArchitectural SelectionRF Design & DevelopmentHW-SW Co-DesignHW-SW Co-DevelopmentHw-SW Co-VerificationVirtual PrototypingTotalM&C TimePDT with Non-OPP1st 802nd 86703rd 12021208824th 144021611045th 119223841538In table 5 the entries for 2nd year are calculated by using the table 1. This has been represented in form of equation 2.%TimeSpent I DesignPhase I ConcurrenyFactorJ (2)In above equation subscript “I” represent the value in a row and subscript “J” represents the value in a column. The columnvalues from concurrency factor (from table 1) have been multiplied with percent time spent column (from table 3) to get thefinal value corresponding to each design phase (table 3). The total time is given by equation 3.n %TimeSpent (3)I 1In equation 3, the value of I 1 represent the value corresponding to requirement analysis phase and I n represent the valuecorresponding to virtual prototyping design phase. Similarly, the M&C time has been calculated by equation 4.M & CTime J TotalEngineeringTime(inDays) J M & CFactorJ .(4)In calculating M&C Time we have multiplied the corresponding total engineering time (in days) (from table 5) withcorresponding M&C factor value for a year (table 2).Final PDT for Non-OPP design methodology is calculated by using equation 5.FinalPDTwithNon OPPJ TotalEngineeringTime(inDays) M & CTime . (5)ConcurrentEngineeringFactorJ 1stYear5 thYear We have added the value of total engineering time is days (in table 5) with the M&C time spent (table 5) and divided it bythe concurrent engineering factor to accommodate the overlap among various design phases in PDC. This procedure hasbeen repeated for each year to get it final PDT for Non-OPP design methodology.We have also calculated the final product development cost. We have represented the time of product development in termsof “Man-Hours”. Man Hours have been calculated from equation 6.ManHours EngineeringTime(inDays) 30 8 .(6)For calculating the man-hours we have assumed that a team comprises of 30 engineers and each engineer works for 8 hoursin a day. Similarly, we calculate the man-hours for the five year period of cost analysis. These man-hours have then beenconverted into the cost of product development. For calculating the cost entry in each row of table 6, we have used equation7.
Cost ManHours CostofEngineerPerYear (7)( No.ofWorkingDaysInAYear 365 52 52 31) ( HoursPerDay 8)This has been summarized in table 6.Table 6: Product Development Cost with Current Design Methodology2nd year3rd Year1st YearEngg.ManCostManCostManCostDesign HoursHoursHoursTimeRequirementAnalysis4th YearManCostHours5th YearManCostHours4811520 938,88015,322 1,248,71019,238 1,567,93023,040 1,877,76030,758 2,506,810SpecificationArchitectureSelectionRF Design &Development7217280 1,408,32022,982 1,873,06628,858 2,351,89434,560 2,816,64046,138 3,760,2147217280 1,408,32022,982 1,873,06628,858 2,351,89434,560 2,816,64046,138 3,760,2149623040 1,877,76030,643 2,497,42138,477 3,135,85946,080 3,755,52061,517 5,013,619SW Design7217280 1,408,32022,982 1,873,06628,858 2,351,89434,560 2,816,64046,138 3,760,214HW DesignSW/HW CoDevelopmentSW/HW CoVerificationVirtual RadioPrototyping14434560 2,816,64045,965 3,746,13157,715 4,703,78969,120 5,633,28092,275 7,520,42914434560 2,816,64045,965 3,746,13157,715 4,703,78969,120 5,633,28092,275 7,520,4297217280 1,408,32022,982 1,873,06628,858 2,351,89434,560 2,816,64046,138 3,760,2147217280 1,408,32022,982 1,873,06628,858 2,351,89434,560 2,816,64046,138 3,760,2140% 05%720190080 1,408,32012,640 21,633,90831,743 28,457,92257,024 35,630,496101,503M&C FactorTotal10%20%40% 49,634,830It should be noted that the concurrent engineering factor does not affect the cost of the product development but onlyreduces the time of product development. This concurrent engineering factor is not included in (7) while calculating thefinal cost of product development.5. Cost Model for OPP Design MethodologyWe have divided the OPP cost model into SW cost model and hardware cost model. These HW/SW cost model has beenfurther divided into component cost model, sub-system cost mode and system cost model. We are proposing a componentbased design methodology along with other innovations for designing future embedded systems as discussed earlier insection 2 of this paper. Such methodology will have a good amount of reuse factor. Thus, we propose to build a set ofreusable components at various levels of abstractions and design phases. We will discuss design reuse parameter in moredetail while describing HW and SW cost model. We further assumed that the complexity of each SW or HW component isequal to that of a digital camera in an embedded system. These components will be integrated together to form a SW/HWsub-system and these sub-systems will be combined together to form the final embedded system.5.1 Factors for OPP Cost ModelAlong with the common factors for the cost model, as discussed in previous section, we have assumed additionalparameters for evolving this cost model. These parameters for methodology learning factor, concurrent engineering factor,reuse factor for software cost model, reuse factor for hardware cost model and HW and SW maintenance factor.5.1.1. Methodology Learning Factor (MLF)As OPP aims at introducing various new design methodologies and techniques into PDC, it will take some time for theproduct development team to get expertise in these areas. With time as OPP design methodology gets more matured thisfactor will not be dominant any more. Thus, in the beginning yeas we have represented this parameter by a bigger numberand its value slowly decreases over a period of five years. This parameter gets multiplied with the final PDT increasing thecost and time to market. MLF has been shown in Table 8.Table 8: Methodology Learning FactorFactor1st Year2nd Year3rd Year4th Year5th Year
Methodology Learning Factor2.01.51.21.11.05.1.2. OPP Concurrent Engineering FactorSimilar to Non-OPP Design methodology, we have some design concurrent in OPP PDC as well. But due to immaturity ofOPP design methodology in its recent phase of deployment, we assume that there is no design concurrency. As OPP getsmore matured design bottleneck will be addressed and more design concurrency would evolve. Finally, in five years time itis expected that this parameter will have the same value as in case of Non-OPP design methodology. We have representedthe value of this parameter in table 9.Table 9: Concurrent Engineering Factor for OPP Design MethodologyFactor1st Year 2nd YearConcurrent Engineering Factor1.01.13rd Year1.24th Year1.35th Year1.5This parameter gets divided by the final PDT. Thus, a larger value of this parameter will reduce PDT further. It should benoted that the concurrent engineering factor will not affect the development cost but will effect the development time only.5.2 Software Cost and Time Feasibility Analysis for OPP Design MethodologyAs discussed earlier we have proposed a component
A successful design methodology is then later represented in form of an EDA tool. Design, development and verification engineers are then able to use these tools in their cutting edge produced design cycle (PDC). For example, SystemC - a hardware-software co-design language was introduced back in. New design methodologies were developed around