Transcription
KNIGHT DIVERSITY OF ASSETMANAGERS RESEARCH SERIES:HIGHER EDUCATION,INTERIM RELEASEAn interim study on the degree to which theendowments of the country’s wealthiestprivate and public colleges and universitiesare hiring asset management firms owned bywomen and racial or ethnic minorities2022Global Economics GroupCandice Rosevear, PrincipalKNIGHTFOUNDATION
Foreword from Knight Foundation and Center forBusiness and Human Rights, New York UniversityStern School of BusinessThis study is part of Knight Foundation’s ongoing research series studying diversity in asset management.The first step to equity is transparency. Without a shared understanding of the facts, we cannot know wherewe stand, where we want to go or whether we are making any progress.We applaud the 16 of 50 colleges and universities that participated in this initial Knight Diversity of AssetManagers (KDAM) study of higher education—12 by providing data for GEG’s independent analysis and fourby providing summary statistics from their own internal analysis. Collectively these 16 schools hold 54% ofthe group’s endowment assets, or 314 billion. They deserve special recognition and our thanks for theircommitment to transparency. These schools are: University of California System University of Chicago University of Colorado Columbia University Duke University University of Illinois Michigan State University Princeton University Rice University Rutgers University University of Texas System Vanderbilt UniversitySelf-reporting Schools Dartmouth College Harvard University University of Pennsylvania Stanford UniversityAt the same time, it is disheartening and revealing that 34 institutions elected not to participate, denying anyvisibility into who is managing the 273 billion in assets they hold. These schools are: Boston College Brown University California Institute ofTechnology Carnegie Mellon University Cornell University Emory University University of Florida Georgia Institute ofTechnology Indiana University University of Iowa Johns Hopkins University Kansas University The University System ofMaryland Massachusetts Institute ofTechnology University of Michigan University of Minnesota University of Missouri System University of Nebraska New York University University of North Carolina Northwestern University University of Notre Dame The Ohio State University Pennsylvania State University University of Pittsburgh Purdue University University of SouthernCalifornia University of Virginia Virginia CommonwealthUniversity Washington University University of Washington Williams College University of Wisconsin Yale UniversityKnight Diversity of Asset Managers Research Series: Higher Education, Interim ReleaseIn that spirit, in the fall of 2021, Knight and Global Economics Group (GEG) embarked on a study to assess thedegree to which the endowments of the country’s wealthiest 25 private and 25 public colleges and universitieshire asset management firms owned by women and racial or ethnic minorities. Our partner in this study is theCenter for Business and Human Rights at New York University’s Stern School of Business (“the Center”), thefirst human rights center housed in a business school.2
These 50 institutions of higher learning hold enormous power to influence change in our society, includingvia their investment decisions. For example, their choice of asset management firms can provide importantjob opportunities for their graduates. It is a natural fit for schools to invest with firms whose teams arerepresentative of their students and alumni. But without more complete data, we can’t fully assess howwell asset management firms are tapping into underutilized, but high-performing talent that can help themachieve their investment goals.Knight and the Center have been historically committed to the issue of diverse asset management. Morethan 10 years ago, Knight was asked publicly how much of its endowment was invested with diverse-ownedasset management firms. The answer at the time amounted to a tiny fraction—just 7.5 million managed bya single firm. Today, more than a third of Knight Foundation’s endowment—over 1 billion—is overseen byasset management firms owned primarily by women and/or people of color. Passing this milestone requireda decade of careful planning and consistent execution. In addition, Knight Foundation is enormously proudthat three other foundations join us in having over 30% of their portfolios invested with diverse-owned firms:Silicon Valley Community Foundation, Tulsa Community Foundation/George Kaiser Family Foundation andCasey Family Programs.As part of Knight’s ongoing research series studying diversity in asset management, in 2020 and 2021,GEG also analyzed the use of diverse asset managers by the nation’s largest charitable foundations. In itsmost recent study, GEG was able to analyze the assets of 30 of the nation’s top 55 foundations, as 19 activelyprovided data and 11 included the necessary information in their IRS-990 PF. In addition, three foundationsprovided self-reported statistics.Since 2017, the Center has been working with university leaders, including investment officers, to promotegreater diversity in the asset management firms the schools work with. In April 2018, the Center hostedrepresentatives from 13 universities to explore ways to promote the inclusion of more firms owned by womenor underrepresented minorities. The Center continues to build on those relationships, and this survey is anextension of its efforts.We encourage colleges, universities, foundations and corporations to follow the lead of the 16 academicparticipants and be more transparent about the management of their assets. These institutions will play acentral role in shaping the 21st-century global economy and represent huge opportunities for college anduniversity graduates. Transparency and better data would help us improve our fields while better preparingsociety to meet future challenges and opportunities.Juan Martinez, Vice President/Chief Financial OfficerAshley Zohn, Vice President/Learning and ImpactThe John S. and James L. Knight FoundationMichael Posner, DirectorKerin McCauley, Senior Associate DirectorCenter for Business and Human Rights, New YorkUniversity Stern School of BusinessKnight Diversity of Asset Managers Research Series: Higher Education, Interim ReleaseDue to the low response rate, we are publishing the information we have without drawing conclusions aboutthe wider field. At the same time as we are grateful for the transparency of some institutions, we also want toalert the public to the opacity that remains. We are committed to securing further participation and, when wedo, plan to publish a final report.3
Executive SummaryThis interim study assesses the representation of women- and racial or ethnic minority-owned investmentfirms (“diverse-owned firms”)1 among those used by the country’s wealthiest 25 private and 25 public collegeand university endowments. The endowments collectively hold 587 billion in total assets.Twelve of the 50 institutions fully participated in the study by providing their asset manager rosters forindependent analysis. Table A provides the results for those institutions. These 12 institutions allocate 97.36billion in assets under management (“AUM”) to U.S.-based firms that are eligible for analysis in this study(“Analyzed AUM”) as of the fiscal year ending June 30, 2021.2AUMManagedby MinorityOwned Firms*AUMManagedby DiverseOwned FirmsAUMManagedby DiverseOwned FirmsInstitutionTotalAssetsAnalyzedAUMAUMManagedby WomenOwned FirmsPrinceton University 37.70 21.80 2.39 3.25 5.8426.8%Columbia University 14.35 8.80 0.03 1.60 1.6318.6%Duke University 12.69 7.60 0.28 2.28 2.4432.1%University of Chicago 11.60 7.25 0.20 0.97 1.1616.0%Vanderbilt University 10.93 8.12 0.06 1.14 1.2014.7%Rice University 8.06 5.15 0.35 0.65 0.8316.1% 95.33 58.72University of Texas System 60.94 15.86 0.50 1.42 1.6510.4%University of California System 27.61 14.13 0.16 1.62 1.7912.6%Michigan State University 3.93 3.14 0.14 0.30 0.3210.3%University of Illinois 3.38 1.76 0.19 0.13 0.3217.9%University of Colorado 2.12 2.09 0.00 0.28 0.2813.6%Rutgers University 2.00 1.66 0.05 0.08 0.116.6%Subtotal, Public Institutions 99.98 38.64Total 195.31 97.36Subtotal, Private Institutions* “Minority” in the available datasets refers to people who are Hispanic, Black, Asian and “other,” which includes Native American, Pacific Islanders and others.We are unable to provide a breakdown by race and ethnicity due to data limitations.1By “diverse-owned,” we mean 50% or more of a firm’s equity ownership is held by women and/or minorities; similarly, “women-owned” or “minorityowned” means a firm has 50% or greater representation by women or racial/ethnic minorities. We include only U.S.-based firms because we define aminority as is typically defined from the perspective of the United States. See Appendix A for details on definitions and methodology.2Analyzed AUM is based on the market value of invested assets. It excludes uninvested capital commitments. Investment values for University of TexasSystem and Rutgers University are as of August 31, 2021, and September 30, 2021, respectively.Knight Diversity of Asset Managers Research Series: Higher Education, Interim ReleaseTable A. Institutions That Provided Asset Manager Rosters, Study Results ( Billions)4
Additionally, four private institutions chose to self-report diversity statistics using this study’s definitions.3Table B provides the results for those institutions.Table B. Institutions with Self-Reported Diversity Statistics ( Billions)Institution TypeTotal AssetsAnalyzed AUM*AUM Managed byDiverse-Owned Firms(Self-Reported %)Harvard UniversityPrivate 51.90Not Available19.0%Stanford UniversityPrivate 37.80Not Available38.0%University of PennsylvaniaPrivate 20.52Not Available25.0%Dartmouth CollegePrivate 8.48Not Available24.0%InstitutionTotal 118.71* Self-reporting institutions only provided summary statistics without underlying data.The remainder of this report is organized as follows:1. Introduction to the Interim Release2. Why (and How) Do We Measure Diversity of Asset Managers?3. Interim Results from the 2022 Diversity of Asset Managers Study4. Conclusion5. Acknowledgements6. Appendix A: Data and Methodology7. Appendix B: Institution Comments8. Appendix C: Detailed Results9. Appendix D: Notes on the Available DataKnight Diversity of Asset Managers Research Series: Higher Education, Interim ReleaseThe remaining 34 institutions with 273 billion in total assets elected not to participate in the study.53The institutions worked with Global Economics Group to understand and apply the study’s definitions. GEG did not independently validate the analysis.See Appendix B for institution commentary on the calculations.
Introduction to the Interim ReleaseThis study strives to measure the representation of women- and racial or ethnic minority-owned investmentfirms (“diverse-owned firms”)4 among those used by the country’s top 25 private and top 25 public collegeand university endowments.5 The endowments collectively hold 587 billion in assets, more than two-thirds ofthe nation’s higher education endowment dollars. In addition to this vast financial capital, these endowmentssupport the operations of some of the most socially influential institutions in the country and hold tremendouspotential to exert influence via investment decisions.Despite sustained outreach efforts led by the Center for Business and Human Rights at New York University’sStern School of Business (“the Center”) from November 2021 to May 2022, only 12 of the 50 eligibleendowments provided their asset manager rosters to Global Economics Group for analysis or, in the case ofthree prominent state school systems, made their asset manager rosters publicly available on their websites.Table A provides the individual results for these endowments. We applaud these institutions for theirtransparency on this important issue: University of California System, University of Chicago, Universityof Colorado, Columbia University, Duke University, University of Illinois, Michigan State University,Princeton University, Rice University, Rutgers University, University of Texas System and VanderbiltUniversity.In addition to these 12 institutions, four institutions provided self-reported diversity statistics using theirown internal analysis and this study’s definitions.7 The four self-reported figures could not be independentlyverified. Table B provides the statistics for these endowments.The 16 schools that are study participants are among the largest of the invited endowments and collectivelyhold 54% of the group’s total endowment assets, or 314 billion. While we commend all 16 institutions for theirvarying levels of participation in the study, there is vast room for improvement, as 34 of the 50 institutions, or68%, elected not to disclose diversity statistics––or any data at all––leaving us with no visibility into the 273billion in assets they hold.4By “diverse-owned,” we mean 50% or more of a firm’s equity ownership is held by women and/or minorities; similarly, “women-owned” or “minorityowned” means a firm has 50% or greater representation by women or racial/ethnic minorities. We include only U.S.-based firms because we define aminority as is typically defined from the perspective of the United States. See Appendix A for details on definitions and methodology.5The term “top” colleges and universities refers to the market value of endowment assets according to the National Association of College andUniversity Business Officers (NACUBO) as of June 30, 2021. National Association of College and University Business Officers, “2021 NACUBO-TIAAStudy of Endowments,” February 18, 2022. The top 25 public and top 25 private institutions were identified using NACUBO’s 2020 list, with endowmentasset values as of June 30, 2020. Prior to publication of this report, we updated endowment asset values using NACUBO’s most recent 2021 list, withendowment asset values as of June 30, 2021. FY 2021 asset values for University of California Regents, University of Chicago and Cornell University weresourced directly from the respective investment office websites.6The higher education field participation rate is 32% in terms of number of institutions and 54% in terms of endowment assets. For comparison, in2021, we conducted this same study on the country’s largest philanthropic foundations and achieved higher participation: 60% in terms of number ofinstitutions and 58% in terms of endowment assets.7The institutions worked with Global Economics Group to understand and apply the study’s definitions. See Appendix B for institution commentary on thecalculations.Knight Diversity of Asset Managers Research Series: Higher Education, Interim ReleaseWe are releasing this report on an interim basis to disclose what we have learned to date and to recognize theinstitutions that broke the mold among this relatively secretive group of endowments.66
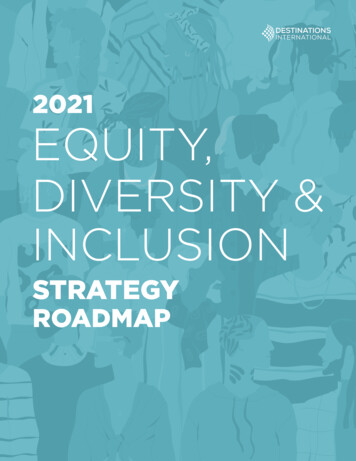
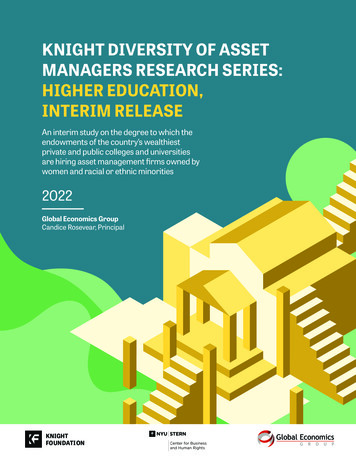
Figure 1. Reporting Status of the 50 Institutions Asked to Participate1224%Numberof Institutions 27346.5%EndowmentAssets ( B)48%Institutions That Provided Asset Manager Rosters 11920.2%Self-Reporting InstitutionsDid Not ReportWe anticipated a higher level of reporting given robust outreach efforts by the Center, Knight Foundation andGlobal Economics Group. Appendix A provides a detailed chronology of our efforts. Notably, key stakeholdersat several institutions that declined to participate did verbally commit to working to increase awareness withintheir institutions regarding diversity in asset management. Twenty-two endowments––including ten of the 34nonparticipants––provided 200-word comments describing their efforts on this issue or explaining why theydid not participate. Those comments are provided in Appendix B.Because of the relatively low participation rate, we cannot assert that the findings in this report arerepresentative of higher education as a whole. But we will continue our outreach and, if we can generategreater participation, will publish a full report in the coming months.That said, we believe the results from this interim study provide a valuable starting point for understandingwhere we are today and for setting future goals.Knight Diversity of Asset Managers Research Series: Higher Education, Interim Release3468% 19533.3%7
Why (and How) Do We MeasureDiversity of Asset Managers?Why Do We Measure Diversity of Asset Managers?This report is the latest release in the KDAM research series. Prior to this report on higher education, we havereported on diversity in the asset management field and the charitable sector. We are not alone in our efforts.Lawmakers, investment offices and others have directed attention at measuring the diversity of asset managers: In the summer of 2020, Rep. Emanuel Cleaver II (D-Mo.) and Rep. Joseph P. Kennedy III (D-Mass.)asked 25 colleges and universities associated with the largest endowments: “How much of yourinstitution’s endowment assets are under management with diverse-owned firms? (Defined as womenor minority ownership above 50%).” Twenty-four of the 25 institutions provided letters in response tothe inquiry and 16 provided a direct response to the question.9 In the fall of 2020, David Swensen, Yale University’s late chief investment officer, sent a letter to Yale’sasset managers implementing annual diversity reporting requirements and requesting “a moresystematic approach to the problem of the lack of women and minorities in the asset managementindustry.”10 We note that Yale declined to participate in this study. In early 2022, the National Association of College and University Business Officers (NACUBO) and theTeachers Insurance and Annuity Association of America (TIAA) released an annual report on highereducation endowments for the fiscal year ending June 30, 2021. The study found that “the percentageof endowments reporting that their institution had a formal policy addressing diversity and inclusionrelated to investment manager selection increased modestly in FY2021 [from 5.8% to 7.7%]. Nearly allthis increase was driven by private institutions.” It also found that “nearly two-thirds of respondentsreported at least some level of gifting that was specifically tagged to support diversity, equity andinclusion (DEI) initiatives.”11We commend those acting to improve diversity in asset management––and especially the institutions thatparticipated in this study––for paving the way for greater transparency. As change continues to occur, clearlydefined measurement will allow us to best monitor progress.8United States Census Bureau’s American Community Survey (ACS) Public Use Microdata Sample (PUMS) 5-Year Estimates, 2019.9Emanuel Cleaver II and Joseph P. Kennedy III, “Inquiry Into Use of Diverse Asset Managers by College and University Endowments, and Related Diversityand Inclusion Practices,” October 8, 2020. Five of the 24 institutions replied to the survey question with statistics computed under a diversity metricother than ownership and three did not reply to the question at all.10 David Swensen, “Diversity and Inclusion Letter,” Yale Investments Office, October 2, 2020.11National Association of College and University Business Officers, “2021 NACUBO-TIAA Study of Endowments,” February 18, 2022. See also, “Presentationof key insights from the 2021 NTSE.”Knight Diversity of Asset Managers Research Series: Higher Education, Interim ReleaseThe field of asset management suffers from a lack of racial, ethnic and gender diversity. Minorities andwomen make up 70% of the U.S. working-age population and 68% of college graduates,8 yet diverse-ownedfirms manage only 1.4% of assets under management (AUM) in the United States, according to a recentKnight Diversity of Asset Managers (KDAM) study. That study, and the two in the series that preceded it,found no statistically significant difference in risk-adjusted returns between diverse and non-diverse assetmanagement firms. Put another way, despite no statistically significant performance advantage, firms ownedby white men manage 98.6% of the 80 trillion under management in the United States. And that 80 trillionrepresents more than three times the entire GDP of the United States. A separate KDAM study shows thatfirms led by white men are also significantly less likely to employ diverse portfolio management teams thanthose owned by women and people of color. Findings such as these are helping fuel a passionate nationaldiscourse around racial, ethnic and gender diversity in the United States.8
How Do We Measure Diversity of Asset Managers?Diversity studies face inherent challenges. The United States has no federal regulatory reportingrequirements on this topic, and we lack even consistent informal standards. This leads to limitations onpublicly available demographic data on investment firms and a lack of consensus on how to best measurediversity in the first place.We conducted this study by measuring diversity with the most comprehensive data and applying a processthat is clear and replicable, based on objectively defined rules, as described in Appendix A. We have stressedtransparency, a commitment to accuracy and an openness to participant input.Several institutions also raised concerns about potentially incomplete investment firm demographic data. Inresponse, while this study uses third-party data as a starting point for determining the ownership diversityof investment firms, we encouraged institutions to provide insight into the diversity profile of the firms withwhich they have investment relationships. We then used these insights to inform the study and enrich thedemographics dataset the study relies upon.In the spirit of collaboration and transparency, Global Economics Group shared underlying individualresults with each participant to allow the institutions to review, audit and, if necessary, correct or clarifythe underlying data.13 Institutional due diligence data and the participant review process were critical tothe success and accuracy of this study. This is an important example of why increased study participationenhances the collective knowledge of the field.Knight Diversity of Asset Managers Research Series: Higher Education, Interim ReleaseThis study focuses on diversity of investment firm ownership because it is the most widely available metric.Several eligible participants in this study––and in KDAM’s 2020 and 2021 philanthropy studies––suggesteddecision-maker diversity would be a better measure if widely available. In response, Knight Foundation andGlobal Economics Group released a report that explored the statistical relationship between these twometrics and found a statistically significant positive correlation between the diversity of ownership and thediversity of decision-making portfolio management teams.12912The application of the team diversity metric to individual institutional portfolios could increase or decrease diversity levels relative to an analysis underthe ownership diversity metric, depending on the mix of firms and funds present in the portfolio and their respective AUM.13We only shared each institution’s own results with each respective institution. We did not disclose the full results of the study for all institutions before thestudy was finalized.
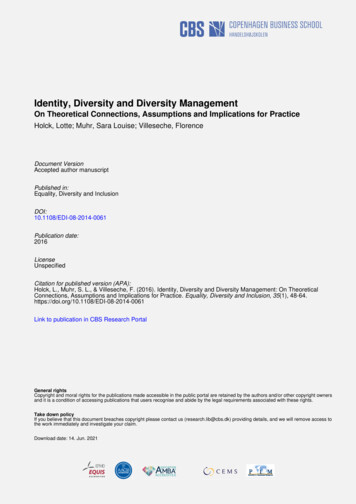
Interim Results from the 2022 Diversity of AssetManagers StudyTable A shows the results of the study for the institutions that provided asset manager rosters, sortedby private/public status, and ranked by total assets.14 These 12 institutions allocate 97.36 billion in AUM toU.S.-based firms that are eligible for analysis in this study (“Analyzed AUM”) as of the fiscal year ending June30, 2021.15All 12 institutions invest more than 5% of their U.S.-based assets with diverse-owned firms, 11 invest more than10% of their assets with such firms and two, Princeton University (managed by PRINCO) and Duke University(managed by DUMAC), invest more than 20% of their U.S.-based portfolios with diverse-owned firms.16AUMManagedby MinorityOwned Firms*AUMManagedby DiverseOwned FirmsAUMManagedby DiverseOwned FirmsInstitutionTotalAssetsAnalyzedAUMAUMManagedby WomenOwned FirmsPrinceton University 37.70 21.80 2.39 3.25 5.8426.8%Columbia University 14.35 8.80 0.03 1.60 1.6318.6%Duke University 12.69 7.60 0.28 2.28 2.4432.1%University of Chicago 11.60 7.25 0.20 0.97 1.1616.0%Vanderbilt University 10.93 8.12 0.06 1.14 1.2014.7%Rice University 8.06 5.15 0.35 0.65 0.8316.1%Subtotal, Private Institutions 95.33 58.72University of Texas System 60.94 15.86 0.50 1.42 1.6510.4%University of California System 27.61 14.13 0.16 1.62 1.7912.6%Michigan State University 3.93 3.14 0.14 0.30 0.3210.3%University of Illinois 3.38 1.76 0.19 0.13 0.3217.9%University of Colorado 2.12 2.09 0.00 0.28 0.2813.6%Rutgers University 2.00 1.66 0.05 0.08 0.116.6%Subtotal, Public Institutions 99.98 38.64Total 195.31 97.36* “Minority” in the available datasets refers to people who are Hispanic, Black, Asian and “other,” which includes Native American, Pacific Islanders and others.We are unable to provide a breakdown by race and ethnicity due to data limitations.14See Appendix C for detailed full results and a second version of the analysis presented in Table A that excludes publicly traded firms and Vanguard.15Analyzed AUM is based on the market value of invested assets. It excludes uninvested capital commitments. Investment values for University of TexasSystem and Rutgers University are as of August 31, 2021 and September 30, 2021, respectively.16Private institutions are listed first in Table A because of their collectively higher use of diverse-owned asset managers compared to public institutions.Knight Diversity of Asset Managers Research Series: Higher Education, Interim ReleaseTable A. Institutions That Provided Asset Manager Rosters, Study Results ( Billions)10
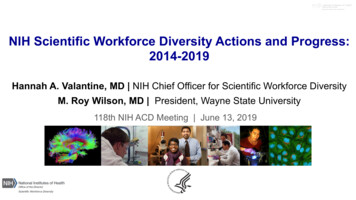
INDICATIONS OF CHANGE:Trends in Recent Hiring and Capital CommitmentsEndowment asset manager rosters can be slow to change. There are several reasons for this, includingasset managers’ intentionally long-term investment objectives and processes, established relationshipswith current managers, low manager turnover and the need for extensive due diligence before hiringnew managers.Our analysis shows that, collectively, these institutions have allocated a greater portion of investmentcommitments from their endowments to diverse managers than they had in the past. Figure 2 showsthat, of the 1.7 billion in total investment commitments made in 2021, 36% were invested with diverseowned firms. Among the total investments made prior to 2021, that figure was 20%. This 16-pointincrease indicates a trend toward greater representation of diverse-owned firms among these sixendowments. Notably, 100 percent of the 2021 investment commitments made by Princeton University(managed by PRINCO) were awarded to diverse-owned firms, accounting for approximately one-half ofthe group’s increase.Figure 2. Portion of Investment Dollars Committed to Diverse-Owned Firms, by Hire Date, Across the SixInstitutions with Data40%35%30%25%20%36%Knight Diversity of Asset Managers Research Series: Higher Education, Interim ReleaseTo look into recent roster decisions, we offered participants the option to provide data on the hire dateand “uncalled commitments” for the firms that manage their endowment. Uncalled commitmentsare assets committed to a firm for future investment that have yet to be invested, typically by privateinvestment strategies. Uncalled commitments plus the market value of invested assets provide ameasure of total investment dollars allocated to each firm. A subset of the participating institutionsprovided us with that optional data: University of Chicago, University of Colorado, Columbia University,Princeton University, Rice University and Rutgers University.15%10%20%115%0Asset Management FirmsHired Prior to 2021Asset Management FirmsHired in 2021
Additionally, four private institutions chose to self-report diversity statistics using this study’s definitions.17The self-reporting institutions did not provide asset manager rosters and the provided statistics could not beindependently validated. In the interest of transparency, we have included these self-reported statisticsin Table B.Table B. Institutions with Self-Reported Diversity Statistics ( Billions)AUM Managed byDiverse-Owned Firms(Self-Reported %)Institution TypeTotal AssetsAnalyzedAUM*Harvard UniversityPrivate 51.90Not Available19.0%Stanford UniversityPrivate 37.80Not Available38.0%University of PennsylvaniaPrivate 20.52Not Available25.0%Dartmouth CollegePrivate 8.48Not Available24.0%InstitutionTotal 118.71Of the 34 nonparticipating institutions with insufficient publicly available data, 18 declined to participate and16 did not respond to our requests. With 34 of the 50 institutions electing not to disclose diversity data, wecannot assess the 273 billion in collective assets they hold.However, ten of the 18 institutions that declined to participate did provide comments for the study (seeAppendix B). They used their comments to describe other methodological criteria that could be used toassess the diversity of their endowment, to explain why they did not participate or to provide details regardingtheir own work in this area. Table C lists whether institutions declined to participate or did not respond, liststhe total assets associated with each institution and indicates which institutions provided a comment forthe study.Knight Diversity of Asset Managers Research Series: Higher Education, Interim Release* Self-reporting institutions only provided summary statistics without underlying data.1217The institutions worked with Global Economics Group to understand and apply the study’s definitions. See Appendix B for institution commentary on thecalculations.
Table C. I
GEG also analyzed the use of diverse asset managers by the nation's largest charitable foundations. In its most recent study, GEG was able to analyze the assets of 30 of the nation's top 55 foundations, as 19 actively provided data and 11 included the necessary information in their IRS-990 PF. In addition, three foundations