Transcription
Estimating Daily Domestic HotWater Use in North American HomesFSEC-PF-464-15June 30, 2015Presented at2015 ASHRAE ConferenceAuthorsDanny S. Parker and Philip W. Fairey, Florida Solar Energy CenterJames D. Lutz, ConsultantThis article or paper was published in ASHRAE Transactions, Volume 121, Part 2. Copyright 2015 ASHRAE.Reprinted by permission at www.fsec.ucf.edu. This article may not be copied and/or distributed electronically or inpaper form without permission of ASHRAE. For more information, visit www.ashrae.org.ASHRAE1791 Tullie Circle, NE, Atlanta, Georgia 30329-2305phone: 404-636-8400 fax: 404-321-5478 web: http://www.ashrae.org
DisclaimerThe Florida Solar Energy Center/University of Central Florida nor any agency thereof, nor any oftheir employees, makes any warranty, express or implied, or assumes any legal liability orresponsibility for the accuracy, completeness, or usefulness of any information, apparatus,product, or process disclosed, or represents that its use would not infringe privately owned rights.Reference herein to any specific commercial product, process, or service by trade name,trademark, manufacturer, or otherwise does not necessarily constitute or imply its endorsement,recommendation, or favoring by the Florida Solar Energy Center/University of Central Florida orany agency thereof. The views and opinions of authors expressed herein do not necessarily stateor reflect those of the Florida Solar Energy Center/University of Central Florida or any agencythereof.
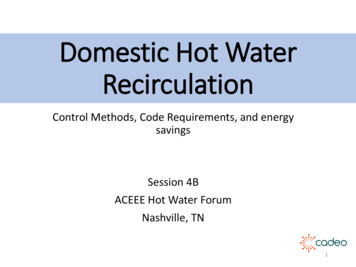
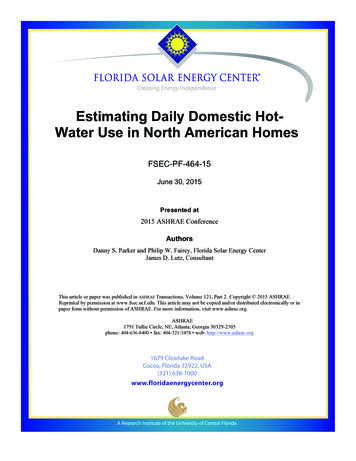
AT-15-021Estimating Daily Domestic Hot-Water Usein North American HomesDanny S. ParkerPhilip FaireyJames D. Lutz, PEMember ASHRAEMember ASHRAEABSTRACTWater heating in the U.S. is a major component of totalenergy consumption in buildings, accounting for approximately18% of total consumption in the residential sector (EIA 2010).While there are many factors influencing hot-water energy use(location, fuel, combustion and heating efficiency, and standbylosses), the actual volume of daily water to be heated is a fundamental quantity for any reasonable estimate of hot-water energyuse. This study uses measured annual hot-water use in variousNorth American climates to evaluate hot-water use in homes. Thefindings show that the quantity of hot-water use is correlated mostclosely to the mains water temperatures and the occupant demographics of the homes with 70% of the available measurementdata explained when occupant demographics are well known.Thestudy proposes a new methodology for estimating the quantitiesof hot-water use in homes as a function of climate location andoccupancy demographics, segregating machine hot-water use,fixture hot-water use, and distribution system hot-water waste.Often cited, the Perlman and Mills data (1985) were takenfrom five residences in Toronto and another fifty homes inOntario. Evaluation of the data showed that daily household hotwater use for a typical household of four persons was 63.1 gallons(239 liters), although with strong seasonal variation: 45.2 gallons(171 liters) per day in summer against 65.7 gallons (249 liters) inwinter. Moreover, these data are potentially biased as an averageas the household size in the sample was 3.8 persons.U.S. household size—which is a large factor in hot-waterdemand—has dropped over time. Figure 1 shows how household size has changed since 1940, dropping precipitously fromINTRODUCTIONWater heating in the U.S. is a major component of totalenergy consumption in buildings, accounting for approximately 18% of total consumption in the residential sector (EIA2010). While there are many factors influencing hot-waterenergy use (location, fuel, combustion and heating efficiency,and standby losses), the actual volume of daily water to beheated is a fundamental quantity for any reasonable estimateof hot-water energy use.Measuring hot-water volumetric consumption is moredifficult than measurement of energy and thus, measurementsare also more limited. Early studies on hot-water use in singlefamily residences included Weihl and Kempton (1985),Kempton (1986), and Perlman and Mills (1985).Figure 1 Changing occupancy in U.S. households, 1940–2010.Danny S. Parker is principal research scientist and Philip Fairey is Deputy Director at Florida Solar Energy Center, Cocoa, FL. James D.Lutz is a consultant in Oakland, CA. 2015 ASHRAE. THIS PREPRINT MAY NOT BE DISTRIBUTED IN PAPER OR DIGITAL FORM IN WHOLE OR IN PART. IT IS FOR DISCUSSION PURPOSES ONLYAT THE 2015 ASHRAE ANNUAL CONFERENCE. The archival version of this paper along with comments and author responses will be published in ASHRAETransactions, Volume 121, Part 2. ASHRAE must receive written questions or comments regarding this paper by July 20, 2015, for them to be included in Transactions.
1970 to 1990. Also, machine-related hot-water draws fromboth washing machines and dishwashers have become lowerwith newer, more efficient machines. In fact, it can be arguedthe four-person household chosen for the DOE test procedurewas not typical even when ASHRAE Project RP-600 wascompleted. Data from 1982 to 1983 were collected when datafrom the U.S. Census showed that the typical occupancy ofU.S. households was only about 2.8 persons.Current occupancy is essentially unchanged since 1990.In single-family homes, occupancy is slightly greater, but inthe 2009 RECS data, the average number in the household wasstill only 2.8 persons. Thus, a “typical” household, as termedby Perlman and Mills (1985)., is more often a three personhousehold than one with four persons.In a follow-on research project designed to update thedata on residential hot-water use patterns, Becker and Stogsdill (1990) gathered, analyzed, and reported on nine differentdata sets consisting of more than 3 million data points on hotwater use in residences. This project included the data used byPerlman and Mills (1985) as well as a number of additionaldata sets that were gathered in both Canada and the continentalU.S. This included measurements from 110 single-familyresidences from 11 utilities reported by Gilbert (1985), whichfound average household hot-water consumption to average66.2 gallons (251 liters). Included were measurements from142 homes in the Hood River Oregon area reported by Hirst etal. (1987) and monitoring data from 74 homes in Florida and24 homes in North Carolina reported by Merrigan (1988).Each of these data sets contained measured hot-water use dataof one year or greater in duration, from which Becker andStogsdill reported the average hourly hot-water use in gallonsfor the continental U.S.It is worthwhile examining a subset of these homes insome greater detail. Merrigan (1988), in Florida from 1982 to1983, measured hot-water use per household to average60.0 gallons (227 liters) per day, in 74 homes with 3.53 average occupants. Consumption was found to roughly vary withoccupancy: gallons per day averaged 44, 56, 68, and 72 gallons(167, 212, 257, and 273 liters) per day in homes with 2, 3, 4,or 5 occupants, respectively. Similarly, 24 homes monitored inNorth Carolina (Merrigan 1988) showed average hot-waterconsumption of 56.9 gallons (215 liters) per day, but with theaverage varying seasonally: 64 gallons (242 liters) in Januarydown to only 48 gallons (182 liters) in July.Measurement over a year long period by Abrams andShedd (1996) of 13 single-family homes in theAtlanta area withelectric resistance water heaters showed 62.1 gallons(235 liters) per day of hot-water consumption but with strongseasonal variation. However, these homes were intentionallychosen for high-occupancy (3.77 occupants per household)—considerably greater than the typical-occupancy single familynow, which is approximately 2.8 persons per household.Considering the above data as well as the advent of moreefficient hot-water fixtures and less hot water used for moderndishwashers and clothes washers, these data suggest lower2average hot-water needs. Further, the dropping number ofoccupants per household is also important such that the64.3 gallons (243 liters) per day reported by Department ofEnergy (DOE) is almost certainly high as an average by about15%. An Electric Power Research Institute (EPRI) evaluationof a compendium of studies in the late 1990s (Hiller 1997)concluded that:The figure of 64.3 gallons per day which was establishedin the 1960s and 1970s, and is currently used in U.S.Department of Energy testing and rating procedures—isn’t representative of actual use.It would appear thatthere is general agreement among data sets collected sincethe 1980s that the average hot-water consumption forsingle-family residences is less than 50 gallons per day.Recent studies have included Lowenstein and Hiller(1998), Mayer et al. (1999), and Henze et al. (2002). In14 sites, Lowenstein and Hiller (1998) saw an average hotwater consumption of 56.9 gallons (215 liters) per day withshowers and baths accounting for 51% and dishwashing andclothes washing accounting for 11% and 13%, respectively.Henze et al. (2002) measured four Nebraska residences insignificant detail using the flow-tracing methodology, butfound only 35 gallons (132 liters) of hot-water use per day,with 59% of this coming from showers and baths, 17% fromsinks, and the 10% and 12% coming from dishwashers andclothes washers, respectively.Another study, using the flow-tracing methodology by theU.S. Environmental Protection Agency (EPA) (Aquacraft2005), recorded hot-water use in ten homes each in Seattle andthe East Bay of California in 2003. Measured hot-water usewas 55.4 gallons (210 liters) in the Seattle Homes and49.2 gallons (186 liters) per day in the East Bay homes.1Approximately 80% of hot-water consumption was found tocome from baths, showers, and faucet use. These numberswere reduced by approximately 17%–25% by installing morewater conserving fixtures, although only half of these savingscame from fixtures.2Another assessment done by Lutz (2005) at LBNL examined fifty studies using a flow-tracing methodology where itwas concluded that average hot-water use was approximately52.6 gallons (199 liters) per day of which approximately 20%(10.35 gallons [39 liters]) was wasted due to draws waiting forhot water to reach household service points as well as heat1.2.One caution: these studies were only of two weeks duration. Aswill be shown, unlike overall water use, hot water varies significantly by season as the largest end use; bath and hand washing aresensitive to temperature and thus to the mix of hot and cold toarrive at a favorable temperature—typically 105 F (40.6 C) (seeAbrams and Shedd 1996). At least six months of data spanningwinter and summer are necessary to obtain representative data.Daily hot-water use for clothes washing in the 20 monitored homesaveraged 6.7 gpd (25.4 L/d), dropping to 3.0 gpd (11.4 L/d) aftermore efficient horizontal-axis clothes washers were installed.Dishwasher hot-water use averaged 2.2 gpd (8.3 L/d) in the samesample. It is also interesting that the study showed that an averageof 2.2 gpd (8.3 L/d) of hot-water use was due to fixture leakage.AT-15-021
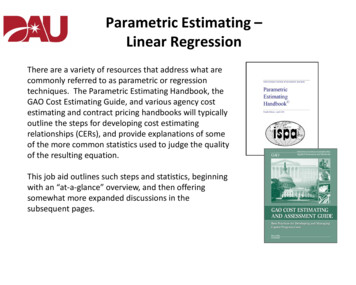
losses from hot water remaining in piping following hot-waterevents. More evidence of hot-water waste and its magnitudecomes from a recent study by Henderson and Wade (2014),who found an average of 22.6% hot-water waste from detailedmeasurements in New York homes.For the Building America Benchmark estimation,Hendron and Engebrecht (2009) came up with an estimationprocedure based on the number of bedrooms. The estimateswere based on using RECS data along with some empiricaldata sources. The study methodology does account forseasonal variation in inlet water temperatures using a sinusoidal estimate of annual inlet water temperature based on empirical data. For showers, baths, and sinks, the water usage isbased on the average of three DHW studies (Burch and Salasovich 2002; Christensen et al. 2000; CEC 2002).MONITORED DATAThe authors compiled 105 sites of annual data where hotwater use was explicitly measured: a sample of 10 homes inHomestead, Florida; 18 houses in California; 29 homes fromMinnesota; 13 in upstate NewYork; and 35 homes from Ottawa,Ontario. The homes had a variety of different water-heatingsystem types spanning from natural gas and electric resistancestorage tanks as well as tankless gas and combo systems. Interestingly, the investigation found no statistically systematicdifference associated with water heating system type.The overall sample had characteristics as shown inFigure 2. There were 2.75 occupants per household with48.0 gallons (182 liters) per day of use. However, the Ottawasample did not have important age-distribution and inlet hotwater temperature data and had fairly low occupancy in manyof the homes. Thus, the sample was reduced to 69 homes fromMinnesota, California, South Florida, and New York. Thissample, which was used for our analysis, had 3.0 occupantsper household and 51 gallons (193 liters) per day of hot-wateruse. Table 1 summarizes the sample.Past models of average household hot-water use haveoften been biased by the household size of the sample. Manyolder studies had households with more than three occupants,which is not typical of recent housing trends. Also, it is important to obtain information on modern fixtures and appliances.This comes largely because hot-water consumption is not onlyan issue related to fixtures, tanks, and plumbing, but also tohot-water consumption habits, household member behavior,and associated use.MACHINE-RELATED HOT-WATER CONSUMPTIONEstimates on clothes washer and dishwasher hot-water useare taken from “Updated Miscellaneous Electricity Loads andAppliance Energy Usage Profiles for Use in Home EnergyRatings, the Building America Benchmark and Related Calculations,” FSEC Report No. FSEC-CR-1837-10 (Parker et al.2011), where the actual hot-water use is derived from algebraicderivation of the DOE test standards for dishwashers and clotheswashers (CFR 430.32) combined with 2005 Residential EnergyConsumption Survery (RECS) data on occupancy. These estimates are updated here for the RECS 2009 data based on a statistical reevaluation of occupancy to determine cycles per year forclothes washers and dishwashers. We note that while bedroomsmust be used for various energy rating schemes, occupants themselves are statistically the most important drivers of thefrequency of laundry and dishwashing appliance use.Clothes WashersCWcpy 123 61 (Occ)(1)whereCWcpy washer cycles per yearOcc occupantsGiven the water factor and estimated hot-water use in theDOE test procedure for washing machines, one can show thatabout 38% of the estimated water use (the water factor) ishot. However, the Cadmus report showed that about 13% ofwashing machine water was hot in actual metering of115 laundry systems (Korn and Dimetrosky 2010). Otherstudies (detailed in the Cadmus report) showed about 18%Table 1.Figure 2 Variable width box plot of gallons of hot-wateruse per day vs. occupants. Box width is proportional to the number of homes in the sample withthat number of occupants.AT-15-021Characteristics of Sample Usedfor AnalysisCharacteristicValueHot water per dayOccupants per householdAdults per householdYoung adults per householdTeenagers per householdChildren per household51.1 gal (193 L)3.021.900.130.510.553
but nothing close to 38%. Given the Cadmus study, a simpleadjustment is made that the estimated hot-water use from theDOE procedure is reduced by 50% (0.5) to match what isseen in the field. Again, from FSEC Report No. FSEC-CR1837-10, hot-water gallons per cycle are as follows:The impact on daily hot-water gallons (liters) per day ofa dishwasher is then as follows:DWgpd DWgpc [(91 30 Occ)/365](5)Standard clothes washer 2008 or later: 4.62 gal (17.5 L) percycle 0.5 2.3 gal (8.7 L) per cycleThus, a three-occupant home with a base unit would use4.0 gallons (15.1 liters) per day and an ENERGY STAR unitwould use 2.8 gallons (10.6 liters) per day. This compares tothe Aquacraft (2005) data which showed an average2.2 gallons (8.3 liters) per day in twenty measured households.Interestingly, three households (15% of the sample) had coldwater plumbed to the dishwasher, which then did not serve toincrease water heating loads.ENERGY STAR clothes washer: 3.0 gal (11.4 L) per cycle 0.5 1.5 gal (5.7 L) per cycleTOTAL DAILY HOT-WATER USEClothes washer hot-water use per cycle:Standard vintage clothes washer: 8.07 gal (30.5 L) per cycle 0.5 4.0 gal (15.1 L) per cycleAs a reality check, the Cadmus study metered an averagehot-water use of 3.8 gallons (14.4 liters) for standard clotheswashers and 2.9 gallons (11 liters) for ENERGY STAR washers. As another reasonability check, the Aquacraft (2005)study estimated 6.7 gallons (24.4 liters) per day in Seattle,Washington and East Bay, California in their baseline data and3.0 gallons (11.4 liters) per day for more efficient horizontalaxis-type clothes washers.The impact on daily hot-water gallons per day of a clotheswasher is then:CWgpd CWgpc [(123 61 Occ)/365]Building America Research Benchmark Definition(Hendron and Engebrecht 2009) provides a useful frameworkfor a hot-water estimation procedure. It estimates total dailyhot-water use as a function of fixture use where skin sensitivitymakes the consumption temperature delivery dependentversus that for machines that are not:Total hot-water use Fixture gallons per day CWgpd DWgpd(6)For a home with three occupants and a basic clotheswasher and dishwasher, the values just described are:(2)CWgpd 4.0 306/365 3.4 gpd (12.9 L/d])DishwashersDWgpd 8.0 181/365 4.0 gpd (15.1 L/d)DWcpy 91 30 (Occ)(3)DWgpc 4.64 (1/EF) – 1.9295(4)whereDWcpy dishwasher cycles per yearDWgpc dishwasher gallons per cycleEF dishwasher energy factorA standard base unit has an EF of 0.46.A minimum energy star unit (as of 2014) has an EF of0.73 which results in the following: Base unit: 8.0 gallons (30.3 liters) per cycleENERGY STAR unit: 4.4 gallons (16.7 liters) per cycleNote the assumption that hand washing and a base unitdishwasher have the same impact on hot-water use(8.0 gallons [30.3 liters] per washing cycle) in that studiesshow no advantage to hand washing, and regression analysisin a large utility sample of 171 homes found no significantchange (reduction or increase to monitored hot-water energyuse) from having a dishwasher in the 81% of households inthe sample with a dishwasher (Parker 2002). Adding to thisconclusion is a widely cited study by Berkholz et al. (2010),which found that hand washing dishes actually uses more hotwater than doing the same job with a dishwasher (13 gallons[49 liters] versus 3.4 gallons [13 liters]).4Fixture Hot-Water UseIn Building America Research Benchmark Definition, thefixture gallons (liters) per day is obtained versus householdbedrooms.3Fixture gallons per day Fmix (30 10.0 Nbr)(7)whereFmix the fraction of fixture water consumption that is hotNbr number of bedroomsFmix is determined by the target temperature, generallyassumed to be 105 F [40.6 C] at point of end-use (Tuse), thehot-water supply temperature (Tset) and the inlet mains watertemperature (Tmains). The DOE Building America Benchmarkprocedure includes a detailed estimation procedure to showhow mains water temperature varies by month:Tmains (Tamb,avg offset) ratio ( Tamb,max/2) · sin(0.986 (day# – 15 – lag) – 90)(8)where3.The specific values for various end uses can be seen in the originalreference. Showers: 14.0 4.67(bedrooms); baths: 3.5 1.17(bedrooms); other faucets: 12.5 4.16(bedrooms). Aggregate total 30.0 10(bedrooms) Fmix.AT-15-021
Tmains mains (supply) temperature to domestic hot-watertank, F ( C)Tamb,avg annual average ambient air temperature, F ( C) Tamb,max maximum difference between monthly averageambient temperatures (e.g., Tamb,avg,july –Tamb,avg,january), F ( C)0.986 degrees/day (360/365)day# Julian day of the year (1–365)offset 6 F (3.3 C)ratio 0.4 0.01 (Tamb,avg – 44)lag 35 – 1.0 (Tamb,avg – 44)This equation is based on analysis by Burch and Christensen of NREL using measured inlet water temperature datafrom multiple locations (2007). Practically, however, ifseasonal accuracy is not needed, the annual average is equal tothe average mains water temperature, which is generally foundto be the average annual air temperature plus 6 F (3.3 C).4The average annual temperature is available from the sourceTMY3 data for relevant locations in North America.The fraction of the water use for bathing, showers andfaucet is based on Fmix, which is determined as follows:Fmix 1 – [(Tset – Tmix)/(Tset – Tmains)](9)A study of 127 homes with electric resistance water heaters in Central Florida (Parker 2002) showed that audited hotwater set temperature averaged 127 F (52.8 C) (Std. Dev:11.5 F [6.4 C]) and field measurement studies in Californiaby Lutz (2012) showed the median average hot-water settemperature to be 123 F (50.6 C). Here, we simplify andassume that 125 F (51.7 C) is a good average for hot-waterstorage temperature.In Central Florida, where Tamb averages 75 F (23.9 C), sothat the variables going into the model are as follows:Tmix: 105 F (40.6 C)4.It is useful to note that for analysis of water heating systems withstrong seasonality in performance, such as solar or heat pumpwater heaters, it is probably useful to consider the seasonal variation in water heating loads since the performance of such systemsare lower in months where water heating loads are highest.Table a.Tset:125 F (51.7 C)Tmains: 81 F (27.2 C)Under these parameters, Fmix is 0.545; total daily hotwater use for a three-person home using Equation 7 wouldcalculate the following:Fixture hot water 32.7 gal (124 L) per dayTotal hot water fixture gal per day CWgpd DWgpdTotal hot water 32.7 gal/day 3.4 4.0 40.1 gal (152 L)per dayIn Duluth, Minnesota, with an annual average Tamb of 39 F(3.9 C), the value for Fmix would be 0.75 and the fixture hotwater use would climb to 45.0 gallons (170 liters) per day, yielding total hot-water consumption of 52.4 gallons (198 liters) perday. In San Francisco, with an average annual temperature of57 F (13.9 C), the value for Fmix would be 0.677 and totalconsumption would be 48.0 gallons (182 liters) per day.In 1992, the Energy Policy Act of 1992 went into effect,although the market changed by 1997–1998 as existingplumbing fixture inventory was depleted (Selover 2012). Thislimited showerheads to 2.5 gallons per minute (0.158 liters persecond) and faucets to 2.2 gallons per minute (0.139 liters persecond). If the home was built before 1997 (or not remodeledand using pre-1997 plumbing fixtures), it would be reasonableto increase the fixture gallons by approximately 10%, based onthe Aquacraft (2005) data, which showed older fixtures lead toincreased consumption, particularly for showers and faucets.It is noteworthy that the same report showed that while specialwater-saving showers may save 20% or more of water, themeasured reduction to hot water was much less—likely due toan altered mix for optimal shower temperature.MAKING IMPROVEMENTSTO THE BUILDING AMERICA MODELExamination of the data shows a differing form of therelationship of gallons (liters) to occupants than seen in theBuilding America model, which is correlated based onnumber of bedrooms (Nbr) as shown in Equation 10 below.Current NREL model [30 10(Nbr)] Fmix(10)Regression A: Regression of Gallons per Day by Normalized Occupancy.regress gpd OccNorm if obs 70Number of obs 69F(1, 67) 64.52SourceSSdfMSProb F 0.0000Model28156.081128156.081R-squared 0.4906Residual29240.53967436.42595Adj. R-squared 0.4829Total57396.6268844.06793Root MSE 20.891gpdCoef.Std. Err.tP t 5-02195% Conf. Interval5
Fmix is the fraction of occupancy uses that are hot basedon water inlet temperatures. We created a new variable,OccNorm, which is the occupancy times the Fmix valuecomputed for that location that expresses preference forfixture related hot-water use. We then regress on the measuredhot-water gallons (liters) per day against the occupancynormalized for inlet water temperatures in our sample of 69homes with reasonably complete data (see Table a).We assume the intercept term represents the machinerelated hot-water draws. This works well as the computedmachine related hot-water use from the data set is 7.3 gallons(27.6 liters) per day, very similar to the intercept in the aboveregression.HWgpd 22 (Occ Fmix) CWgpd DWgpd(11)Fmix averaged 0.68 across the sites where most of the inletwater temps were measured.Example: three occupants and Fmix 0.68.Standard clothes washer and dishwasher with three occupants 7.4 gallons (28 liters) per day.The new model from the data is as follows:HWgpd (22 3 Fmix) 7.4 52.3 gpd (198 L/d) (12)The original BA hot-water model is solely meant forbedrooms and not occupants, but in that case one must adjustfor the relationship of occupants and bedrooms in singlefamily homes. The relationship of occupants to bedrooms isestablished from the 2009 RECS data (as shown in Table b).Thus, for the purposes of using the relationships shownabove, the assumed occupancy per bedroom is shown inTable 2.Since occupancy does not differ a lot with bedrooms,some of the fixed nature of the Building America model willreappear in any version of the calculations focused solely onbedrooms rather than occupancy. However, the resultinginfluence on potential accuracy is important—most of theTable b.predictive ability of any estimation of daily hot-water usewill depend on numbers of occupants and their ages—andnot on bedrooms, which is a poorer predictor. The new relationship has a stronger response relative to occupancy as theold Building America definition was focused on bedroomsinstead.Statistical Analysis ofOccupant Demographic InfluencesGiven the indicated importance of occupant demographics from ANOVA tests to the individual variables, we use datafrom the first 69 homes where we have good occupant data. Astepwise regression method is used with variables removed toyield the most simple, yet powerful explanation of the variation in our data:The stepwise regression was run with a p 0.1 requiredto keep statistically influential independent variables in themodel. The stepwise regression (see Table c) drops adult occupants as not significantly different from occupants in general.However, youth and child counts are highly significant—asseen from early review of the CA data alone. Youths (13 to 23,inclusive) are much different than older adults. They useapproximately 13 gallons (49 liters) more per day. By way ofbalance, children use less. We also note that the coefficient ofdetermination, R-squared, increases dramatically from 0.49 to0.71 within the same data set. Once we consider occupantdemographics, we do much better at predicting hot-waterloads. What would the above model indicate for the followingthree-occupant households (Fmix 0.68)? Three adult occupants, no kids: 46.6 gpd (176 L/d)Two adults; one child: 41.2 gpd (156 L/d)One single parent: two children: 35.8 gpd (136 L/d)Two adults: one teen: 59.6 gpd (226 L/d)One single parent; two youths: 72.6 gpd (275 L/d)Three college kids in a rental: 85.6 gpd (324 L/d)Regression B: Occupancy versus Bedrooms in Single Family HomesNumber of obs 8693F(1, 8691) 1001.94. reg occupants bedrooms if SF 16SourceSSdfMSProb F 0.0000Model2097.626812097.6268R-squared 0.1034Residual18195.21686912.0935698Adj R-squared 0.1033Total20292.84286922.3346574Root MSE 1.4469OccupantsCoef.Std. Err.tP t 4395% Conf. IntervalAT-15-021
Even ignoring the three college students scenario, we seea 2:1 difference indicated for hot-water consumption from theage-related consumption characteristics to the occupancy ofthe household. Household demographics appear to matterquite a bit for estimating site-specific hot-water consumption.Of course, across buildings and over their useful life, thesefactors cancel out. However, they are potentially useful relative to understanding variance, for sizing related issues and topredict immediate retrofit savings from water heating technology changes in specific households.This allows an accuracy approaching 70% at predictingvariation in hot-water consumption, but without understanding that a portion of the occupancy-related hot-water use isactually arising from waste rather than intrinsic use for bathing, washing, etc.Hot-Water WasteExplicit within Equation 11 is the fact that the occupantcoefficient is derived from measured annual hot-water use inhomes. Thus, the result of applying the equation a prioriincludes any hot-water waste associated with the hot-waterdistribution system. Structural waste in hot-water distributionsystems arises from the fact that following a hot-water event,Table 2. Occupants per Bedroomsfrom 2009 RECS DataBedroomsAverage Occupants23452.172.713.253.79Source: 2009 RECSTable c.the hot water in the piping loses heat to its surroundings. Thequantity of hot-water waste that a distribution system experiences is dependent on three principle factors: The length and diameter of the hot-water pipingbetween the hot-water heater and the point of hot-wateruse (i.e., the volume of hot water that can be left in thepiping)The amount of insulation on the hot-water pipingThe elapsed time between multiple hot-water events thatuse the same pipingThe first two of these factors are self-evident and havebeen measured in laboratory tests by Hiller (2005 and 2006)but the third factor can be more difficult to grasp. The timeinterval between multiple hot-water events that use the samepiping is important because it determines the quantity of heatthat will be lost from the piping between hot-water events. Iftwo ho
2 AT-15-021 1970 to 1990. Also, machine-related hot-water draws from both washing machines and dishwashers have become lower with newer, more efficient machines.