Transcription
Shondelle Wilson-Frederick, Ph.D.; Tracy Branch, M.P.A.S., PA-C;Munira Gunja, M.P.H.; Wendy Lee, M.P.H.; Minh Wendt, Ph.D., and Rashida Dorsey,Ph.D., M.P.H.OverviewThe U.S. Department of Health and Human Services (HHS) Office of Minority Health (OMH) is committedto improving the health of racial and ethnic minorities and eliminating disparities in health and health care.This year marks both the 30th anniversary of the Report of the Secretary’s Task Force on Black and MinorityHealth (also known as the Heckler Report) and the 5th anniversary of the Affordable Care Act. The HecklerReport was the federal government’s first comprehensive study of the health status of minorities and led tothe creation of the HHS Office of Minority Health. And with approximately 16.4 million uninsuredAmericans gaining health insurance coverage since the Affordable Care Act was enacted, the AffordableCare Act is one of the most significant pieces of legislation since the passage of Medicare and Medicaidthat will help reduce health disparities and advance health equity.Since the first open enrollment period for the Health Insurance Marketplace in October 2013, the uninsuredrate among males fell by 30 percent (6.6 percentage points) with 6.5 million men gaining coverage. Someof the largest improvements in reducing the ranks of the uninsured occurred among racial and ethnicminorities, with a drop of 9.2 percentage points among African Americans and 12.3 percentage pointsamong Latinos. Under the Affordable Care Act, most health insurance plans are required to providecoverage for recommended preventive health care services without cost sharing. Today, 17 million Latinos,15 million Blacks, 8 million Asian Americans, and 1 million American Indians have access to preventiveservices such as blood pressure and obesity screenings and immunizations without cost sharing.In June 2014, in observance of Men’s Health Month, OMH released a data brief that examinedcharacteristics of uninsured adult males (ages 19 to 64 years) by race and ethnicity, using data from the2012 American Community Survey (U.S. Census Bureau). The analytic sample only included non-elderlyAsian, Black, Latino, and White males.This year, in commemoration of Men’s Health Month 2015, OMH presents the findings of three years ofdata from the 2011-2013 American Community Survey that examines demographic and health measuresamong racial and ethnic minority males (ages 19 to 64 years). The analytic sample builds upon the previousbrief by including data collected prior to the first open enrollment period of the Affordable Care Act onAmerican Indian/Alaska Native and Native Hawaiian/Pacific Islander males. Findings described hereinwill assist health care, public health and policy professionals develop sex specific interventions to improvehealth care access and health outcomes as well as reduce racial and ethnic health disparities among adultmales.
Shondelle Wilson-Frederick, Ph.D.; Tracy Branch, M.P.A.S., PA-C;Munira Gunja, M.P.H.; Wendy Lee, M.P.H.; MinhWendt, Ph.D., andHighlightsRashida Dorsey, Ph.D., M.P.H.BackgroundOver the past several decades, our nation has made vastimprovements in scientific knowledge, public health, andhealth care. However, the health status of racial and ethnicminority males still lags behind the general population.Nationally, obesity rates are higher in males, age 20 andolder, across all racial and ethnic groups except Asians[1]. Rates of cardiovascular disease are nearly one-thirdhigher for non-elderly racial and ethnic minority males ascompared to White males [2]. In particular, Black malestend to have poorer health outcomes across most healthmeasures [1]. To gain a better understanding of theunderlying causes of these health disparities in males, it isimportant to conduct studies focusing on single sexgroups. The paucity of reports examining demographicand health measures among diverse groups of malesunderscores the timeliness of this report.This report examines demographic, socioeconomic, andhealth characteristics by race and ethnicity among adultmales (ages 19 to 64 years). This data brief presents datafrom the most recent national three-year estimates of the2011-2013 American Community Survey Public UseMicrodata Sample (ACS PUMS) [3] and providesadditional information on the patterns of health and wellbeing among non-elderly males prior to the establishmentof the Health Insurance Marketplace and the expansion ofMedicaid eligibility under the Affordable Care Act. Forthe purposes of this brief, males described herein areconsidered as non-elderly persons who lawfully reside inthe United States. The total sample includes 89,242,898of non-elderly males: Whites (68 percent), Latinos (14percent), Blacks (13 percent), Asians (5 percent),American Indians/Alaska Natives (1 percent), and NativeHawaiian or Pacific Islanders (less than 1 percent).KeywordsAmong non-elderly males between theages of 19 to 25 years, 79% of Whites,77% of Asians, 70% NativeHawaiians/Pacific Islanders, 62% ofBlacks, 57% of Latinos, and 49% ofAmerican Indians/Alaska Natives hadhealth insurance coverage.Non-elderly American Indian/AlaskaNative (19%) and Black (15%) maleshad the highest percentage ofdisability.Among non-elderly males, 20% ofAsians and 17% of Latinos reside inlimited English proficient households.Among non-elderly males, more than70% of Native Hawaiians/PacificIslanders and American Indians/AlaskaNatives had a high school diploma astheir highest level of educationalattainment.Among non-elderly males, 47% ofAmerican Indians/Alaska Natives and45% of Blacks report family income ator below 138% of the federal povertylevel (highest among six racial andethnic groups).Over 80% of non-elderly Asian, White,Native Hawaiian/Pacific Islander, andLatino males had a full-time worker inthe household.Data from the 2011-2013 AmericanCommunity Survey Public UseMicrodata SampleAmerican Community Survey (ACS), race, ethnicity, men’s health,minority, men’s health disparitiesPage 2
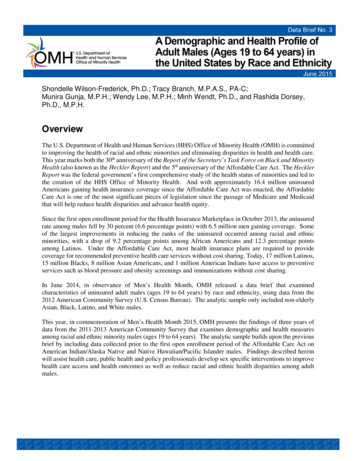
What percentage of adult males (ages 19 to 64 years) have health insurancecoverage?Figure 1. Health insurance coverage for adult males, by age category and race or ethnicity (2011-2013ACS)American Indian/Alaska NativeAsianBlackLatinoNative Hawaiian/Pacific 28582 8379797783846260 585751504940302010019 to 25 years26 to 34 years35 to 54 years55 to 64 yearsAge categoriesNOTE: Data are shown for non-elderly males who had a private or public health insurance plan. A private plan isprovided through an employer or union; a plan purchased by an individual from an insurance company; or TRICAREor other military health coverage. Public coverage includes the federal programs Medicare, Medicaid and other medicalassistance programs, VA Health Care; the Children’s Health Insurance Program (CHIP); and individual state healthplans. Since the Indian Health Service (IHS) is not considered comprehensive health coverage, non-elderly males whoonly have health coverage through IHS are classified as uninsured.19 to 25 years:Among males between the ages of 19 to 25 years, 79 percent of Whites, 77 percent of Asians, 70 percentNative Hawaiians/Pacific Islanders, 62 percent of Blacks, 57 percent of Latinos, and 49 percent ofAmerican Indians/Alaska Natives had health insurance coverage.26 to 34 years:Among males between the ages of 26 to 34 years, 79 percent of Asians, 77 percent of Whites, 72 percentNative Hawaiians/Pacific Islanders, 60 percent of Blacks, 58 percent of Latinos, and 51 percent ofAmerican Indians/Alaska Natives had health insurance coverage.Page 3
35 to 54 years:Among males between the ages of 35 to 54 years, 84 percent of Whites, 84 percent of Asians, 83 percentNative Hawaiians/Pacific Islanders, 73 percent of Blacks, 67 percent of Latinos, and 62 percent ofAmerican Indians/Alaska Natives had health insurance coverage.55 to 64 years:Among males between the ages of 55 to 64 years, 90 percent of Whites, 85 percent NativeHawaiians/Pacific Islanders, 83 percent of Blacks, 82 percent of Asians, 76 percent of Latinos, and 74percent of American Indians/Alaska Natives had health insurance coverage.Page 4Page 4
What percentage of adult males (ages 19 to 64 years) have disabilities?Figure 2. Disability among adult males, by race or ethnicity (2011-2013 ACS)American Indian/Alaska NativeAsianBlackNative Hawaiian/Pacific ledAmong non-elderly adult males, American Indians/Alaska Natives (19 percent), and Blacks (15 percent)had the highest percentages of disability. Non-elderly White (11 percent), Latino (9 percent), and NativeHawaiian/Pacific Islander (9 percent) males reported lower percentages of disability. Non-elderly Asianmales (5 percent) had the lowest percentage of disability.Page 5
What is the highest level of educational attainment for adult males (ages 19 to 64years)?Figure 3. Educational attainment of adult males, by race or ethnicity (2011-2013 ACS)American Indian/Alaska NativeAsianBlackNative Hawaiian/Pacific 313020102718169151111131480Less than high schoolHigh school diplomaCollege graduateEducational AttainmentLess than High School:Across all racial or ethnic groups of non-elderly males, a higher percentage of Latinos (27 percent)completed less than a high school level of education, whereas less than 20 percent of non-elderly AmericanIndian/Alaska Native (18 percent), Black (16 percent), Native Hawaiian/Pacific Islander (11 percent), Asian(9 percent), and White (8 percent) males completed less than high school.High School Diploma:Except for Asians (40 percent), the majority of non-elderly males reported a high school diploma as theirhighest level of educational attainment. The percentage of non-elderly Native Hawaiian/Pacific Islandermales (76 percent) who earned a high school diploma was greater than the percentages for non-elderlyAmerican Indian/Alaska Native (71 percent), Black (69 percent), White (62 percent), and Latino (60percent) males.Page 6
College Graduate:Across all racial or ethnic groups of non-elderly males, a higher percentage of Asians (50 percent) graduatedfrom college. Lower percentages of non-elderly White (31 percent), Black (15 percent), NativeHawaiian/Pacific Islander (14 percent), Latino (13 percent), and American Indian/Alaska Native (11percent) males graduated from college.Page 7
What percentage of adult males (ages 19 to 64 years) are married?Figure 4. Marriage among adult males, by race or ethnicity (2011-2013 ACS)American Indian/Alaska NativeAsianBlackLatinoNative Hawaiian/Pacific riedMarriage appears to vary by racial or ethnic group. Among non-elderly males, 59 percent of Asians, 54percent of Whites, 52 percent of Native Hawaiians/Pacific Islanders, and 46 percent of Latinos weremarried. Lower percentages of non-elderly American Indian/Alaska Native (38 percent) and Black (33percent) males were married.Page 8
What is the family income, as percent of federal poverty level, among adult males(ages 19 to 64 years)?Figure 5. Family income, as percent of the federal poverty level, for adult males, by race or ethnicity(2011-2013 ACS)American Indian/Alaska Native50AsianLatinoNative Hawaiian/Pacific k3532302625232221192020151050138% FPL or less139% to 400% FPLMore than 400% FPLFederal Poverty LevelNOTE: The federal poverty guidelines commonly referred to as the “federal poverty level” are a version of the federalpoverty measure. They are issued each year by the Department of Health and Human Services for administrativepurposes— for instance, determining financial eligibility for certain federal programs.138 percent Federal Poverty Level or Less:Across all racial or ethnic groups of non-elderly males, American Indians/Alaska Natives (47 percent) hadthe highest percentages of family income at or below 138 percent federal poverty level followed by Blacks(45 percent). A lower percentage of non-elderly Latino (37 percent) and Native Hawaiian/Pacific Islander(37 percent) males had family incomes at or below 138 percent federal poverty level. Asians (26 percent)and Whites (22 percent) had the lowest percentages family income at or below 138 percent federal povertylevel.139 percent to 400 Percent Federal Poverty Level:Across all racial or ethnic groups of non-elderly males, Latinos (43 percent) had the highest percentage offamily income between 139 percent to 400 percent federal poverty level, followed by NativeHawaiians/Pacific Islanders (40 percent). Lower percentages of non-elderly White (35 percent), AmericanIndian/Alaska Native (34 percent), Black (34 percent), and Asian (32 percent) males report family incomebetween 139 percent to 400 percent federal poverty level.Page 9
More than 400 percent Federal Poverty Level:Across all racial or ethnic groups of non-elderly males, Whites (43 percent) and Asians (42 percent) hadthe highest percentage of family income of more than 400 percent federal poverty level. In contrast, lowerpercentages of non-elderly Native Hawaiian/Pacific Islander (23 percent), Black (21 percent), Latino (20percent), and American Indian/Alaska Native (19 percent) males reported family incomes of more than 400percent federal poverty level.Page 10
What percentage of adult males report having a full-time worker in theirhousehold (ages 19 to 64 years)?Figure 6. Percentage of adult males with full-time workers in their household, by race or ethnicity (20112013 ACS)American Indian/Alaska Native90AsianBlack86Native Hawaiian/Pacific 100Full-Time Worker in FamilyThe majority of non-elderly males had a full-time worker in their household. Among non-elderly males,Asians (86 percent) had the highest percentage of households with a full-time worker, followed by Whites(85 percent), Latinos (83 percent), and Native Hawaiians/Pacific Islanders (83 percent). Lower percentagesof non-elderly American Indian/Alaska Native (69 percent) and Black (69 percent) males had a full-timeworker in their household.Page 11
What is the household level of limited English proficiency among adult males(ages 19 to 64 years)?Figure 7. Household level of limited English proficiency for adult males, by race or ethnicity (2011-2013ACS)American Indian/Alaska NativeAsianBlackLatinoNative Hawaiian/Pacific IslanderWhite252020Percent171510552110Household Limited English ProficientNOTE: Household Limited English Proficiency (LEP) is classified as non-elderly male living in a household (definedby Census household) that does not contain any adults who speak English as a first language or ‘very well’ as asecond language.Among non-elderly males, 20 percent of Asians and 17 percent of Latinos reported that no adult membersof their household spoke English well. In contrast, only 5 percent of non-elderly Native Hawaiian/PacificIslander males and even lower proportions of non-elderly American Indian/Alaska Native (2 percent),Black (1 percent), and White (1 percent) males reported that no adult members of their household spokeEnglish well.Page 12
SummaryThe Office of MinorityHealth at the U.S.Department of Healthand Human Services isdedicated to improvingthe health of racial andethnic minoritypopulations through thedevelopment of healthpolicies and programsthat will help eliminatehealth disparities.This data brief provides a profile of the social, economic, and healthcharacteristics reported by non-elderly American Indian/AlaskaNative, Asian, Black, Latino, Native Hawaiian/Pacific Islander, andWhite males. Nearly 80 percent of White and Asian males betweenthe ages of 19 to 25 years had health insurance coverage. Less than20 percent of males reported having a disability. With the exceptionof non-elderly Asian males (40 percent), 60 percent or greater ofnon-elderly American Indian/Alaska Native, Black, Latino, NativeHawaiian/Pacific Islander, and White males reported a high schooldiploma as their highest level of educational attainment. With theexception of non-elderly American Indian/Alaska Native (38percent) and Black (33 percent) males, nearly 50 percent of nonelderly males were married. Across all racial and ethnic groups ofnon-elderly males, one out of three males had a family incomebetween 139 percent to 400 percent federal poverty level. Asian andLatino males had the highest percentage of household limitedEnglish proficiency.ConclusionWhile progress in reducing the uninsurance rate through the implementation of the Affordable Care Acthas been seen, the findings in this report demonstrate the challenges the nation faces in addressing healthdisparities and the underlying social determinants of health among racial and ethnic minority males in theUnited States. This brief provides aggregate data on six racial and ethnic groups of men. In the UnitedStates, there is great diversity within racial and ethnic groups, and intra- and inter- group disparities exist.Future work that includes examining social determinants and health behaviors by granular or detailed subgroup could provide even more information to describe the characteristics of males in the United States.As leaders and organizations at national, state, tribal, territorial, and local levels continue to developstrategies and plan innovative efforts to advance health equity, these findings can inform their approachesfor closing the gap of health and health care disparities among racial and ethnic minority males. Mostreports on racial and ethnic males only provide data on Blacks, Latinos, and Asians, largely due to issueswith sample size. With the inclusion of American Indians/Alaska Natives and Native Hawaiians/PacificIslanders, this report provides crucial information on additional racial and ethnic groups of males who havehistorically experienced disparities in health and health care but are often missing from the literature.Page 13Page 13
Definitions 1Adults MalesNon-elderly males (less than 65 years old) who are lawfully residing in the United States.DisabilityIf a non-elderly male responded “yes” to any of the following statements in the American CommunitySurvey, then they were considered to have a disability: Person is deaf or does he/she have a serious difficulty hearing. Person is blind or does he/she have serious difficulty seeing even when wearing glasses. Because of a physical, mental, or emotional condition, person has serious difficulty concentrating,remembering, or making decisions. Person has serious difficulty walking or climbing stairs. Person has difficulty dressing or bathing. Because of a physical, mental, or emotional condition, person has difficulty doing errands alone suchas visiting a doctor’s office or shopping.Educational Attainment Less than high school: Non-elderly male with less than a high school degree. High school diploma: Non-elderly male with a high school degree but no college degree. College graduate: Non-elderly male with a four-year college degree.Federal poverty level [4]The federal poverty guidelines commonly referred to as the “federal poverty level” (federal poverty level)are a version of the federal poverty measure. They are issued each year by the U.S. Department of Healthand Human Services (HHS) for administrative purposes— for instance, determining financial eligibility forcertain federal programs.Health insurance coverage [3]Non-elderly males who had a private or public health insurance were classified as insured. A private planis provided through an employer or union; a plan purchased by an individual from an insurance company;or TRICARE or other military health coverage. Public coverage includes the federal programs Medicare,Medicaid and other medical assistance programs, VA Health Care; the Children’s Health InsuranceProgram (CHIP); and individual state health plans. Since the Indian Health Service (IHS) is not consideredcomprehensive health coverage, non-elderly males who only have health coverage through IHS areclassified as uninsured.Household Limited English Proficiency (LEP)Non-elderly male living in a household (defined by Census household) that does not contain any adults whospeak English as a first language or ‘very well’ as a second language.Racial and Ethnic Groups American Indian/Alaska Native represents non-elderly males reporting ‘American Indian alone,’‘Alaska Native alone,’ or ‘American Indian and Alaska Native tribes specified’ as their race, and whoare not of Latino ethnicity. Asian represents non-elderly males reporting ‘Asian alone’ as their race, and who are not of Latinoethnicity.1Unless otherwise noted, variables were defined according to the Centers for Medicaid and Medicare Services,Health Insurance Marketplace, available from: /censusdata.htmlPage 14
Black represents non-elderly males reporting ‘Black or African American alone’ as their race, and whoare not of Latino ethnicity. Latino represents non-elderly males reporting Latino or Hispanic ethnicity, regardless of race. Native Hawaiian/Pacific Islander represents non-elderly males reporting ‘Native Hawaiian and OtherPacific Islander alone’ as their race, and who are not of Latino ethnicity. White represents non-elderly males reporting ‘White alone’ as their race, and who are not of Latinoethnicity.Data Sources and MethodsUnless otherwise noted, all numbers in this brief are ASPE tabulations from the calendar year 2011-2013American Community Survey Public Use Microdata Sample (ACS PUMS), adjusted to exclude estimatedundocumented persons based on ASPE’s TRIM3 simulation model. Non-elderly males described in thisdata brief exclude the undocumented and the elderly.All estimates were survey-weighted and represent the total non-elderly male population (ages 19 to 64years). This data brief presents crude estimates that are not age-adjusted to a population standard. Measuresincluded in this analysis were defined using the ACS definitions as shown on the CMS.gov Health InsuranceMarketplace website [5].References1. U.S. Department of Health and Human Services-Centers for Disease Control and Prevention. CDCHealth Disparities and Inequalities Report — United States, 2013. 62(Suppl 3): p. 1-186.2. James C, Salganicoff A, Ranji U, et al. Putting men’s health disparities on the map: examining racialand ethnic disparities at the state level. Henry J. Kaiser Family Foundation, Editor. 2012.3. U.S. Census Bureau. ACS Health Insurance Definitions. 2012; Available ology/definitions/acs.html.4. U.S. Department of Health and Human Services-Office of the Assistant Secretary for Planning andEvaluation. Poverty Thresholds and Poverty Guidelines. 2014; Available from:http://aspe.hhs.gov/Poverty/faq.cfm.5. U.S. Department of Health and Human Services-Centers Medicare and Medicaid Services. CensusData to Target the Uninsured. Available from: census-data.html.Page 15
About the AuthorsShondelle Wilson-Frederick, Tracy Branch, Wendy Lee, Minh Wendt, and Rashida Dorsey are with theOffice of Minority Health (OMH) and Munira Gunja is with the Office of the Assistant Secretary ofPlanning and Evaluation (ASPE) at the U.S. Department of Health and Human Services.Suggested citationWilson-Frederick S, Branch T, Gunja M, Lee W, Wendt M, and Dorsey, R. A Demographic and HealthProfile of Adult Males (Ages 19 to 64 years) in the United States by Race and Ethnicity. OMH Data Brief,No 3. Rockville, MD: Office of Minority Health. 2015.Copyright informationAll material appearing in this report is in the public domain and may be reproduced or copied withoutpermission; citation as to source, however, is appreciated.Office of Minority HealthJ. Nadine Gracia, M.D., M.S.C.E., Deputy Assistant Secretary for Minority Health and Director, Office ofMinority Health, U.S. Department of Health and Human ServicesRashida Dorsey, Ph.D., M.P.H., Director, Division of Data and Policy, Office of Minority Health, U.S.Department of Health and Human Services1101 Wootton Parkway, Suite 600Rockville, MD 20852Phone: 240-453-2882 Fax: 240-453-2883Email: info@minorityhealth.hhs.gov www.minorityhealth.hhs.govPage 16
This year, in commemoration of Men’s Health Month 2015, OMH presents the findings of three years of data from the 20112013 American Community Survey that examines demographic and health measures - amon