Transcription
The Obama Administration’s EffortsTo Stabilize The Housing Marketand Help American HomeownersMay 2012U.S. Departmentof Housingand UrbanDevelopment Officeof PolicyDevelopmentResearchU.S Departmentof Housingand UrbanDevelopment U.S.Departmentof the andTreasuryThe Administration’s goal is to stabilize the housing market and providesecurity for homeowners. To meet these objectives in the context ofa very challenging market, the Administration developed a broadapproach implementing state and local housing agency initiatives, taxcredits for homebuyers, neighborhood stabilization and communitydevelopment programs, mortgage modifications and refinancing,housing counseling, continued Federal Housing Administration (FHA)engagement, support for Fannie Mae and Freddie Mac and increasedconsumer protections. In addition, Federal Reserve and TreasuryMortgage-Backed Securities purchase programs have helped to keepmortgage interest rates at record lows over the past year. More detailon the Administration’s efforts can be found in the Appendix.May 2012 Scorecard on Administration’sComprehensive Housing InitiativeThe President’s housing market recovery efforts began immediately aftertaking office in February 2009. The May 2012 housing scorecardincludes the following key indicators of market health and results of theAdministration’s comprehensive response, as outlined above: Market data show promise as indicators continue toshow signs of stability, though officials caution that theoverall outlook remains mixed. Sales of existing homes rose2.4 percent in April, increasing in every region of the U.S. Inaddition, the inventory of newly constructed houses increased forthe first time since April 2007. Since sales outpaced inventorylevels, the supply of homes on the market dipped to 5.1 monthsin April from 5.2 months in March and a peak of 12.2 months inJanuary 2009. Experts consider a six month supply of homes forsale to be a balanced market. However, distressed sales remain akey factor as the impact of serious delinquencies and underwatermortgages continue to temper market gains. The Administration’s foreclosure programs are providingrelief for millions of homeowners as the housing marketcontinues to recover from an unprecedented crisis. Morethan 1.1 million homeowner assistance actions have taken placethrough the Administration’s Making Home Affordable Program,while the Federal Housing Administration (FHA) has offered morethan 1.3 loss mitigation and early delinquency interventions.The Administration’s programs continue to encourage improvedstandards and processes in the industry, with HOPE Now lendersoffering families and individuals nearly 2.9 million proprietarymortgage modifications through April. More than 1.1 million homeowner assistance actionswere granted through Making Home Affordable. Eligiblehomeowners entering HAMP continue to demonstrate a highlikelihood of long-term success in the program. As of April, morethan one million homeowners have received a permanent HAMPmodification, saving approximately 535 on their mortgagepayments each month, and an estimated 12.7 billion to date.Eighty-six percent of homeowners entering the program in thelast 22 months have received a permanent modification, withan average trial period of 3.5 months. Seventy percent of nonGSE customers entering HAMP in recent months have receivedsome form of principal reduction with their modification. Thoseparticipating in the HAMP Principal Reduction Alternative (PRA)have seen a median principal reduction of 68,267 – or 31percent. The April Monthly Report can be found at: ility/results/MHA-Reports/Pages/default.aspxGiven the current fragility and recognizing that recovery will takeplace over time, the Administration remains committed to its efforts toprevent avoidable foreclosures and stabilize the housing market.May 2012 National Scorecard Page 1
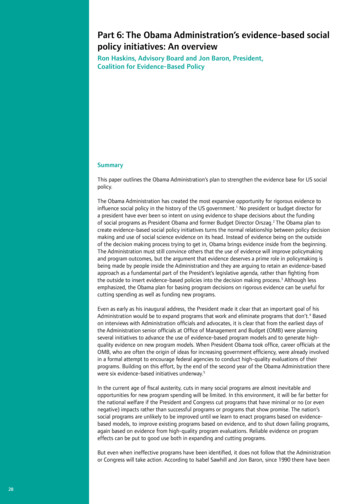
U.S Department of Housing and Urban DevelopmentU.S. Department of the TreasuryU.S Department of Housing and Urban DevelopmentU.S. Department of the TreasuryThe Obama Administration’s Efforts To Stabilize The Housing Market and Help American Homeowners May 2012House Prices Stable in MarchDistressed Sales Remain Key In This Fragile Recovery Expectations On House Prices Remain Above 2009 Projections Existing And New Home SalesExisting Homes On The Market At Low Level,Number Of Units Held Off The Market Remains High *May 2012 National Scorecard Page 2
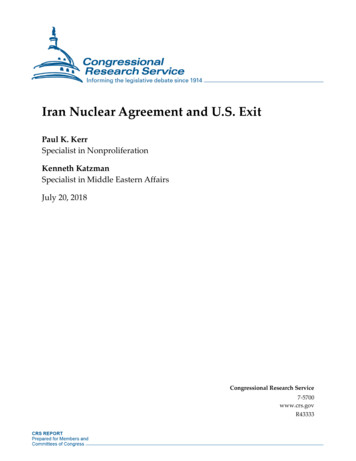
The Obama Administration’s Efforts To Stabilize The Housing Market and Help American Homeowners May 2012Mortgage Rates Near Record Lows,Homes Remain Highly Affordable 14.9 Million Homeowners Have RefinancedSince April 1, 2009 Mortgage Aid Extended More Than 6 Million Times,Outpacing Foreclosures Mortgage Aid Helps Foreclosures Trend Downward,Completions Down For Three Consecutive Months May 2012 National Scorecard Page 3U.S Department of Housing and Urban DevelopmentU.S. Department of the TreasuryU.S Department of Housing and Urban DevelopmentU.S. Department of the Treasury
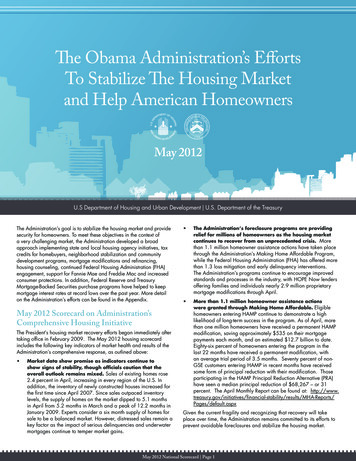
U.S Department of Housing and Urban DevelopmentU.S. Department of the TreasuryU.S Department of Housing and Urban DevelopmentU.S. Department of the TreasuryThe Obama Administration’s Efforts To Stabilize The Housing Market and Help American Homeowners May 2012Homeowners Save From Reduced Mortgage PaymentsTotal Home Equity Slightly Lower Than First Quarter 2009 Housing Counselors Serve Millions Of FamiliesFHA Supports Mortgage Lending During Crisis May 2012 National Scorecard Page 4
U.S Department of Housing and Urban DevelopmentU.S. Department of the TreasuryU.S. Department ofUrban ThDevelopmentOffice ofandPolicyDevelopmentResearch May 2012The Obama Administration’sEffHousingorts ToandStabilizee Housing MarketHelpAmericanandHomeownersIndicatorHOUSING ASSISTANCE AND STABILIZATION PERFORMANCE METRICSThis PeriodLast PeriodCumulative From April 1, 2009Distressed Homeowners Assisted (thousands)HAMP Trial ModificationsHAMP Permanent ModificationsFHA Loss Mitigation InterventionsHOPE Now ModificationsHARP RefinancesLatest h-12March-12420.4411.27,5501st Q 12Borrower Annual Savings ( millions)HAMP Trial ModificationsHAMP Permanent ModificationsAll Refinances--------3375,10227,7051st Q 121st Q 121st Q 12Activities Completed Under NSP (housing units)New Construction or Residential RehabDemolition or ClearanceDirect Homeownership Assistance--------11,719 [54,588]22,975 [26,097]9,050 [18,460]–171.4–88.3Counseled Borrowers (thousands)Change in Aggregate Home Equity ( billions)IndicatorMortgage Rates (30-Yr FRM, percent)–106.1(r)HOUSING MARKET FACT SHEETThis PeriodLast Period3.75Year Ago3.78(b)(b)(b)4.554th Q 11As of Dec 2008Latest Release5.10184.1162.91st Q 121st Q 121st Q 1231-May-12March-12Housing Affordability (index)204.3207.9(r)Home Prices (indices)Case Shiller (NSA)FHFA (SA)CoreLogic - Excluding Distressed Sales 80.8145.5150.5197.0161.6Home Sales (thousands, SA)NewExistingFirst Time BuyersDistressed Sales (percent, l-12March-12Housing SupplyExisting Homes for Sale (thousands, NSA)Existing Homes - Months’ Supply (months)New Homes for Sale (thousands, SA)New Homes for Sale - Months’ Supply (months, SA)Vacant Units Held Off Market 12April-12April-12April-121st Q 12918.1517.8767.2986.41st Q 121st Q ge Originations (thousands)Refinance OriginationsPurchase 21,219.4462.5(r)(r)1,253.6410.3FHA Originations (thousands)Refinance OriginationsPurchase OriginationsPurchases by First Time Buyers53.169.452.3(p)(p)(p)47.665.446.2Mortgage Delinquency Rates 951,6097071,4041,60770811,11910,72311,089--4th Q April-12March-12March-12Seriously Delinquent Mortgages (thousands)PrimeSubprimeFHAUnderwater Borrowers (thousands)Foreclosure Actions (thousands)Notice of Default (Foreclosure Starts)Notice of Foreclosure SaleForeclosure CompletionsShort SalesREO Sales(p)(p)(r)(r)(r)(r)(r)(r)(r)SA seasonally adjusted, NSA not SA, p preliminary, r revised, b brackets include units in process.May 2012 National Scorecard Page 5
U.S Department of Housing and Urban DevelopmentU.S. Department of the TreasuryU.S. Department ofUrban ThDevelopmentOffice ofandPolicyDevelopmentResearch May 2012The Obama Administration’sEffHousingorts ToandStabilizee Housing MarketHelpAmericanandHomeownersA. Items in TablesSOURCES AND METHODOLOGYDescriptionDistressed Homeowners AssistedHAMP Trial ModificationsHAMP Permanent ModificationsHARP RefinancesFHA Loss Mitigation InterventionsHOPE Now ModificationsCounseled Borrowers (thousands)Borrower Annual SavingsHAMP Trial ModificationsFrequencySourcesNotes on suryTreasuryFederal Housing Finance AgencyHUDHope Now AllianceAs reported.As reported.As reported.All FHA loss mitigation and early delinquency interventions.All proprietary modifications completed.QuarterlyHUDHousing counseling activity reported by all HUD-approved housing counselors.QuarterlyHUD, Treasury, and Freddie MacHAMP Permanent ModificationsQuarterlyHUD and TreasuryAll RefinancesQuarterlyHUD, and MBAHUD estimate of annualized savings based on Treasury reported active HAMP trial modificationsand Freddie Mac monthly savings estimates.HUD estimate of annualized savings based on Treasury reported active HAMP permanentmodifications and median monthly savings estimates.Refinance originations (see below) multiplied by HUD estimate of annualized savings per refinance.Completed Activities Under NSP (housing units)New Construction or Residential RehabQuarterlyHUDDemolition or ClearanceQuarterlyHUDDirect Homeownership AssistanceQuarterlyHUDChange in Aggregate Home EquityQuarterlyFederal Reserve BoardMortgage Rates (30-Yr FRM)WeeklyFreddie MacPrimary Mortgage Market Survey, as reported for 30-Year fixed rate mortgages (FRM).Housing AffordabilityMonthlyNational Association of Realtors NAR’s composite housing affordability index as reported. A value of 100 means that afamily with the median income has exactly enough income to qualify for a mortgage on amedian-priced home. An index above 100 signifies that family earning the median incomehas more than enough income to qualify.Home PricesCase-Shiller (NSA)MonthlyStandard and Poor’sMonthlyMonthlyFederal Housing Finance AgencyCoreLogicCase-Shiller 20-metro composite index, January 2000 100. Standard and Poor’s recommendsuse of not seasonally adjusted index when making monthly comparisons.FHFA monthly (purchase-only) index for US, January 1991 100.CoreLogic national combined index, distressed sales excluded, January 2000 100.(Only available as NSA).MonthlyHUD and Census BureauExistingMonthlyNational Association of Realtors First Time BuyersMonthlyNAR, Census Bureau, and HUDDistressed Sales (NSA)MonthlyCoreLogicHousing SupplyExisting Homes for Sale (NSA)Existing Homes - Months’ SupplyNew Homes for Sale (SA)New Homes for Sale - Months’ Supply (SA)Vacant Units Held Off l Association of Realtors National Association of Realtors HUD and Census BureauHUD and Census BureauCensus BureauAs reported.As reported.As reported.As reported.As reported in Census CPS/HPS Table 4. Estimates of Housing Inventory, line item “Year-roundvacant, held off market for reasons other than occasional use or usually reside elsewhere.”Vacant units can be held off the market for a variety of reasons.Mortgage OriginationsRefinance OriginationsQuarterlyPurchase OriginationsQuarterlyMortgage Bankers Associationand HUDMortgage Bankers Associationand HUDHUD estimate of refinance originations based on MBA estimate of dollar volume of refianceoriginations.HUD estimate of home purchase originations based on MBA estimate of dollar volume of homepurchase originations.FHFA (SA)CoreLogic - Excluding Distressed Sales (NSA)Home Sales (SA)NewHousing units constructed/rehabilitated using Neighborhood Stabilization Program.Bracketed numbers include units in process, to be completed by 3/2013.Housing units demolished/cleared using Neighborhood Stabilization Program. Bracketednumbers as above.Completed downpayment assistance or non-amortizing second mortgages by grantee tomake purchase of NSP unit affordable. Bracketed numbers as above.Difference in aggregate household owners’ equity in real estate as reported in the FederalReserve Board’s Flow of Funds Accounts of the United States for stated time period.Seasonally adjusted annual rates divided by 12. A newly constructed house is consideredsold when either a sales contract has been signed or a deposit accepted, even if this occursbefore construction has actually started.Seasonally adjusted annual rates divided by 12. Existing-home sales, which include singlefamily, townhomes, condominiums and co-ops, are based on transaction closings. This differsfrom the U.S. Census Bureau’s series on new single-family home sales, which are based oncontracts or the acceptance of a deposit.Sum of seasonally adjusted new and existing home sales (above) multiplied by NationalAssociation of Realtors annual estimate of first time buyer share of existing home sales.Short sales and REO (Real Estate Owned) sales as a percent of total existing home sales(current month subject to revision).FHA OriginationsRefinance OriginationsPurchase OriginationsPurchases by First Time BuyerMortgage Delinquency Rates DFHA originations reported as of date of loan closing. Estimate for current month scaled upwarddue to normal reporting lag and shown as preliminary.MonthlyMonthlyMonthlyLPS Applied AnalyticsLPS Applied AnalyticsHUDTotal mortgages past due (30 days) but not in foreclosure, divided by mortgages actively serviced.Total mortgages past due (30 days) but not in foreclosure, divided by mortgages actively serviced.Total FHA mortgages past due (30 days) but not in foreclosure, divided by FHA’s insurance in force.Seriously Delinquent MortgagesPrimeSubprimeFHAMonthlyMonthlyMonthlyLPS Applied Analytics, MBA, and HUD Mortgages 90 days delinquent or in foreclosure, scaled up to market.LPS Applied Analytics, MBA, and HUD Mortgages 90 days delinquent or in foreclosure, scaled up to market.HUDMortgages 90 days delinquent or in foreclosure.Underwater BorrowersQuarterlyCoreLogicAs reported.Foreclosure ActionsNotice of Default (Foreclosure Starts)MonthlyRealty TracMonthlyMonthlyMonthlyMonthlyRealty TracRealty TracCoreLogicCoreLogicReported counts of notice of default plus lis pendens. Some foreclosure starts may be omitted instates where the filing of a notice of default is optional.Notice of sale (auctions).Real Estate Owned (REO).Count of Short Sales for the month as reported (current month subject to revision).Count of REO (Real Estate Owned) Sales for the month as reported (current month subject torevision).Notice of Foreclosure SaleForeclosure CompletionsShort salesREO SalesMay 2012 National Scorecard Page 6
U.S Department of Housing and Urban DevelopmentU.S. Department of the TreasuryU.S. Department ofUrban ThDevelopmentOffice ofandPolicyDevelopmentResearch May 2012The Obama Administration’sEffHousingorts ToandStabilizee Housing MarketHelpAmericanandHomeownersSOURCES AND METHODOLOGYB. Notes on Charts.1. Monthly house price trends shown as changes in respective house price indices applied to a common base price set equal to the median price of an existinghome sold in January 2003 as reported by the National Association of Realtors. Indices shown: S&P/Case Shiller 20-metro composite index (NSA), January2000 100, FHFA monthly (purchase-only) index for US (SA), January 1991 100, and CoreLogic-Distressed Sales Excluded (Monthly) for US (NSA),January 2000 100.2. S&P/Case-Shiller 20 metro composite index (NSA) as reported monthly. Futures index figures report forward expectations of the level of the S&P/Case Shillerindex as of the date indicated, estimated from prices of futures purchased on the Chicago Board of Exchange reported by Radar Logic.3. Reported seasonally adjusted annual rates for new and existing home sales divided by 12.4. HUD estimate of refinance originations based on MBA estimate of dollar volume of refinance originations.5. Cumulative HAMP modifications started, FHA loss mitigation and early delinquency interventions, plus proprietary modifications completed as reported byHope Now Alliance. Some homeowners may be counted in more than one category. Foreclosure completions are properties entering Real Estate Owned(REO) as reported by Realty Trac.6. Foreclosure starts include notice of default and lis pendens, completions are properties entering REO. Both as reported by Realty Trac. See “ForeclosureActions” above.7. See “Borrower Annual Savings” above.8. FHA market shares as FHA purchase and refinance originations divided by HUD estimates of purchase and refinance mortgage originations as noted in“Mortgage Originations” above. Data for 2010 and 2011 have been revised.C. Additional Notes.Additional loan servicers were added to the LPS Applied Analytics data base in March 2012, increasing market coverage of active prime loans in the LPSsample by 0.5 percent and active subprime loans by 20 percent. Since the estimated number of delinquent loans from this source have always been scaledto represent the entire market, the additional market coverage would not necessarily increase the number of delinquent loans reported here. The increasedsample size improves the accuracy of the estimates.May 2012 National Scorecard Page 7
U.S Department of Housing and Urban DevelopmentU.S. Department of the TreasuryU.S. Department ofUrban ThDevelopmentOffice ofandPolicyDevelopmentResearch May 2012The Obama Administration’sEffHousingorts ToandStabilizee Housing MarketHelpAmericanandHomeownersAppendixThe Administration has taken a broad set of actions to stabilize the housing market and helpAmerican homeowners. Three years ago, stress in the financial system had severely reducedthe supply of mortgage credit, limiting the ability of Americans to buy homes or refinancemortgages. Millions of responsible families who had made their monthly payments and hadfulfilled their obligations saw their property values fall. They also found themselves unable torefinance at lower mortgage rates.In February 2009, less than one month after taking office, President Obama announced theHomeowner Affordability and Stability Plan. As part of this plan and through other housinginitiatives, the Administration has taken the following actions to strengthen the housing market: Supported Fannie Mae and Freddie Mac to ensure continued access to affordablemortgage credit; The Federal Reserve and the U.S. Treasury purchased more than 1.4 trillion in agencymortgage backed securities through independent MBS purchase programs, helping tokeep mortgage rates at historic lows; Launched a modification initiative to help homeowners reduce mortgage payments toaffordable levels and to prevent avoidable foreclosures; Launched a 23.5 billion Housing Finance Agencies Initiative to increase sustainablehomeownership and rental resources; Supported the First Time Homebuyer Tax Credit, which helped more than 2.5 millionAmerican families purchase homes; Provided more than 5 billion in support for affordable rental housing through lowincome housing tax credit programs and 6.92 billion in support for the NeighborhoodStabilization Program to restore neighborhoods hardest hit by the concentratedforeclosures; Created the 7.6 billion HFA Hardest Hit Fund for innovative foreclosure preventionprograms in the nation’s hardest hit housing markets; Launched the 1 billion Emergency Homeowners Loan Program, as part of the DoddFrank Wall Street Reform and Consumer Protection Act, to help unemployed andunderemployed homeowners pay a portion of their monthly mortgage. Created an FHA Short Refinance Option that helps underwater borrowers refinance intoa new, stable, FHA-insured mortgage that is more aligned with actual property values. Supported home purchase and refinance activity through the FHA to provide access toaffordable mortgage capital and help homeowners prevent foreclosures. Implemented a series of changes to the Home Affordable Refinance Program (HARP) inan effort to attract more eligible borrowers who can benefit from refinancing their homemortgages during this time of historically low mortgage rates.###May 2012 National Scorecard Page 8
May 2012 Scorecard on Administration's Comprehensive Housing Initiative The President's housing market recovery efforts began immediately after taking offi ce in February 2009. The May 2012 housing scorecard includes the following key indicators of market health and results of the