Transcription
ISSN 2304-3415, Russian Open Medical Journal1 of 62016. Volume 5. Issue 3. Article CID e0305DOI: 10.15275/rusomj.2016.0305MicrobiologyResearch letterExtended application of dose-response models of infection on injectable insulin products in vialsMostafa Essam EissaHIKMA Pharma Pharmaceutical Company, Giza, EgyptReceived 13 March 2016, Revised 14 April 2016, Accepted 18 May 2016 2016, Eissa M.E. 2016, Russian Open Medical JournalAbstract: Microbial contamination from in-use application of multidose pharmaceutical products constitutes health hazard to theconsumer especially when considering injectable medicines. In the present study, an attempt has been made to integrate dose-responsemodels of infections with pharmacopeial preservative efficacy test (PET) in a single simulation study that supposed accidental reuse ofhypodermic syringe. Probability risk ratio of infection from assumed equal doses of two types of microbes by two routes of infection wasgreater than 1300 at most equivalent administration doses when considering the same reduction factor for both bacteria in theantimicrobial efficacy test (AET). The probability of infection would diminish much more rapidly for Staphylococcus aureus rather thanPseudomonas aeruginosa. The short interval of product administration increased the risk of infection with regular-type of Insulin vials. Thecurrent quantitative study provided extension and made the best use of the standard AET but also highlighted its limitations.Keywords: preservative efficacy test, hypodermic syringe, Pseudomonas aeruginosa, Staphylococcus aureus, regular-type of insulinCite as Eissa ME. Extended application of dose-response models of infection on injectable insulin products in vials. Russian Open Medical Journal 2016; 5:e0305.Correspondence to Mostafa Essam Eissa. Adddress: P.O. Box 1913, Plot no.1, 6th of October City, Giza, Egypt. Phone: 00201006154853.E-mail: mostafaessameissa@yahoo.comIntroductionMicrobial intrusions emerging from crude materials and amidprocessing, drugs might get to be defiled amid storage and duringconsumption. Sorts and levels of "in-use" tainting are practicallydifficult to anticipate and just constrained distributed informationis obtainable. For medications that are brought into ordinarilysterile parts of the body, the potential hazards are significant. Asurvey of microbial tainting of intravenous (IV) liquids amid useproposed that the little quantities of mostly non-pathogenicmicrobes were by and large all around endured and that diseasewas an uncommon event [1].While microbial pollution of sterile items amid productionprocesses is currently seldom an issue, microbial invasion of IVliquids and device amid clinical use is still known to happen. Froma writing review (1971–1983), Denyer (1984) presumed that themicrobial contamination of IV liquids from packaged bottles andcollapsible plastic dosage forms during consumption was of themagnitude of 4.3 and 2.6%, in order; by and large, the observedbioburden was available in low numbers [1]. When the asepticproduct integrity is broken, the microbial infection risk with itsassociated produced toxins is largely dependent on the ability ofthe product formulation to support microbial proliferation [2]. Inassessing the outcome of the screening of microbial contaminationduring product consumption, it must be understood that pollutionlevels in utilized items reflect the bioburden input from the patientas well as the survival capabilities of the contaminant in themedicinal drug. Unfortunately, Koerner et al. 1997 reported asudden dissemination of septicemia which was accounted for in anintense cardiology ward. The flare-up was credited to Enterobactercloacae (member of Enterobacteriaceae) intrusion of heparinmixtures that were mixed in non-clinical places abutting the wardfrom packs of IV liquids, which stayed open for 24 hours or evenmore at room temperature, and non-single use heparin vials [3].The above described challenges stimulated the study of riskand probability of infection that could arise from contaminatedmultidose injectable products, using commercial Insulin vials thatare commonly found in the drug market. As diabetes is consideredone of the most commonly observed frequently chronic diseasesin the world, the aim of the current research is to combinepreservative efficacy test (PET) with dose-response models ofinfection using indicator microbes in simulation study thatintegrate the most critical parameters which influence theinfectivity of the contaminated pharmaceutical with the possiblehazard to the health of patients.Material and MethodsPET design and methodPET test was performed for each product type (nine differentforms) five times. Product categories included three varieties withthree subset types. The test parameters and guideline referenceswere done as demonstrated by Eissa and Mahmoud (2015) [4, 5].The outcome of the five treatments were combined and averaged.[ 2016, LLC Science and Innovations, Saratov, Russiawww.romj.org
ISSN 2304-3415, Russian Open Medical Journal2 of 62016. Volume 5. Issue 3. Article CID e0305DOI: 10.15275/rusomj.2016.0305MicrobiologyTable 1. Dose-response infection model parameters per route of administration using critical or indicator microorganismsAgentStaphylococcus aureus: Dose response modelPseudomonas aeruginosa (bacterimia): Dose response modelBest fit modelOptimized parameter(s) LD50/ID50exponential-8exponentialk 7.64 x 10k 1.05 x 10⁻⁴Dose units Refs.subcutaneous3injected in eyelids9.08 x 106.61 x 10Route6CFU/cm2CFU[6][7]Table 2. Active pharmaceutical ingredient (API) and other additives that may enhance or modify the preservation power of the formulae as in theinstruction pamphlet of the manufactured productsType of componentAPIInactive ComponentspH rangeWFI, water for injection.Insulin product typeRegular, Neutral and Soluble (RNS)Isophane (IPN)Mixture 30/70 (RNS-IPN)Soluble crystals of zinc-InsulinSuspension-forming crystalline insulinwith zinc and protamine APIIPN 70%APIRNS 30%Glycerol and WFIGlycerol, sodium phosphate and WFIGlycerol, sodium phosphate, protaminesulphate, zinc oxide and WFI6.6 – 8.06.9 – 7.56.9 – 7.5Principle theoryReference or indicator microorganisms and parameters ofdose-response models of infections with references werepresented in Table 1. On the other hand, Table 2 shows the activepharmaceutical ingredient (API) and other inactive componentsthat may influence the antimicrobial strength of the three maincategories of Insulin product vial forms. Preservatives and theusual dosing regimen used for each formula type are indicated inTable 3 as per manufacturer leaflet. Importantly, Table 4 gathersall parameters criteria for assessing the risk of infection.Assumptions about modeling of dose-response of infection tocomplement antimicrobial efficacy test (AET) were as thefollowing:1 – The maximum risk analysis using worst case scenario wasused to measure the highest possibility of infection hazard atwhich the users of the multidose medicinal dosage forms areexposed, i.e. assuming high contamination level and using thelowest logarithmic reduction (LR) values as cut-off figures even ifno microbial populations were recovered from AET after sevendays.2 – The current study assumed accidental reuse of the samehypodermic syringe. The needle in such case presented themedium for transfer of skin flora to the vial and vice versa.However, the present model supposed to use single contaminationspot simulation, while multiple spots contamination will beaddressed in separate evaluation experiment. The transfer factorwould be calculated as 100% from the dermis to the needlesurface according to the surface area of the needle as a maximumpotential risk.3 – Based on the common Insulin administration regimes twocommon possible routes for infections were used in this simulationstudy as determined in Table 1. An exponential model of infectionwould relate microbial reduction from AET, dosing administrationfor each type of Insulin and assumed level of indicatormicroorganisms in colony forming unit (CFU) with probability ofinfection that was expressed as percentage.4 – The probability of infection would provide a quantitativemeasure for measuring for the possibility of getting infection fromcontaminated multidose injectable product which is normallyphysically protected from environmental contamination with theexception of regularly penetrating syringe needle.5 – Data calculation from Tables 3 (under the usual dosingsystem column) and 4 (in determination of microbialcontamination density section) would allow for determination ofthe theoretical dose (D) of the microorganism for calculation ofthe response. The single spot contamination model assumed thatinfection occurred once with the second accidental use of theproduct with the same syringe. Equation of exponential doseresponse model of infection is as the following for Table 1:(ɥ-1)Dɥ [(n / (V * ƒ )]*ѵ(eq. 1)P(response) 1-exp(-k * Dɥ)(eq. 2)Where: D – dose of specific microbial particles to which patientwas exposed in CFU; ɥ – number of the dose rank duringconsumption of single unit dosage form; n – contamination leveldelivered to the product in vial through syringe needle (CFU); V –volume of the product during accidental contamination by n CFU(ml); ƒ – reduction factor of microbial population in thepharmaceutical product obtained from the results of PET; ѵ – thecommon dose volume administered to the diabetic patientsaccording to the product type as shown in Table 3; P(response) –quantitative risk response of the disease response; k – themicrobial particle has Independent and identical probability ofsurviving to reach and infect at an appropriate site.6 – For convinience of comparison between products the samepotency of Insulin per day and the same logarithmic reduction (LR)were assumed for all types of formulae. Also the samecontamination inoculum (CFU) of both Staphylococcus aureus andPseudomonas aeruginosa was selected to contaminated differentvial forms with the final count delivered by the needle was 7500CFU.Statistical analysisDose-response figure and models complex calculations ofinfections were designed using Microsoft Office Excel 2007. Nonparametric comparsion between probabilities of infections usingKruskal-Wallis test (One-Way ANOVA followed by Dunn's multiplecomparisons test at α 0.05) with the aid of GraphPad Prism v6for windows.[ 2016, LLC Science and Innovations, Saratov, Russiawww.romj.org
ISSN 2304-3415, Russian Open Medical Journal3 of 62016. Volume 5. Issue 3. Article CID e0305DOI: 10.15275/rusomj.2016.0305MicrobiologyTable 3. Preservative efficacy test (PET) results of nine forms of recombinant human Insulin vials based on USP 51LR at testing days intervalsAntimicrobial components / usual dosingHuman recombinant insulin typeTest microorganisms*system71428Highly purified isophane suspension (100 U-10 ml) vialPhenol and m-cresolS. aureus 5.66 5.66 5.6650 U single dose/dayE. coli 5.64 5.64 5.64Highly purified isophane suspension (100 U-4 ml) vialHighly purified isophane suspension (40 U-10 ml) vialHighly purified regular solution (100 U-10 ml) vialHighly purified regular solution (100 U-4 ml) vialHighly purified regular solution (40 U-10 ml) vialHighly purified regular 30% isophane 70% (100 U-10ml) vialHighly purified regular 30% isophane 70% (100 U-4ml) vialHighly purified regular 30% isophane 70% (40 U-10ml) vialP. aeruginosa 5.46 5.46 5.46C. albicans 5.34 5.34 5.34A. brasiliensis 4.73 4.73 4.73S. aureus 5.83 5.83 5.83E. coli 5.72 5.72 5.72P. aeruginosa 5.29 5.29 5.29C. albicans 5.31 5.31 5.31A. brasiliensis 4.76 4.76 4.76S. aureus 5.34 5.34 5.34E. coli 5.19 5.19 5.19P. aeruginosa** 5.07 5.07 5.07C. albicans 4.62 4.62 4.62A. brasiliensis 4.31 4.31 4.31S. aureus 5.63 5.63 5.63E. coli 5.66 5.66 5.66P. aeruginosa 5.34 5.34 5.34C. albicans 5.29 5.29 5.29A. brasiliensis 4.71 4.71 4.71S. aureus 5.70 5.70 5.70E. coli 5.53 5.53 5.53P. aeruginosa 5.28 5.28 5.28C. albicans 5.40 5.40 5.40A. brasiliensis 4.96 4.96 4.96S. aureus 5.34 5.34 5.34E. coli 5.15 5.15 5.15P. aeruginosa 5.07 5.07 5.07C. albicans 4.62 4.62 4.62A. brasiliensis 4.32 4.32 4.32S. aureus 5.37 5.37 5.37E. coli 5.39 5.39 5.39P. aeruginosa 5.32 5.32 5.32C. albicans 5.07 5.07 5.07A. brasiliensis 4.47 4.47 4.47S. aureus 5.48 5.48 5.48E. coli 5.51 5.51 5.51P. aeruginosa 5.54 5.54 5.54C. albicans 5.41 5.41 5.41A. brasiliensis 4.79 4.79 4.79S. aureus 5.48 5.48 5.48E. coli 5.58 5.58 5.58P. aeruginosa 5.27 5.27 5.27C. albicans 5.03 5.03 5.03A. brasiliensis 4.17 4.17 4.17m-Cresol50 U divided in four doses/dayPhenol50 U divided two doses/day2/3 1/3LR, logarithimic reduction.* All microorganisms have not been recovered at any stage of the test from the recovery medium.** Selected cut-off value for the maximum risk of infection.[ 2016, LLC Science and Innovations, Saratov, Russiawww.romj.org
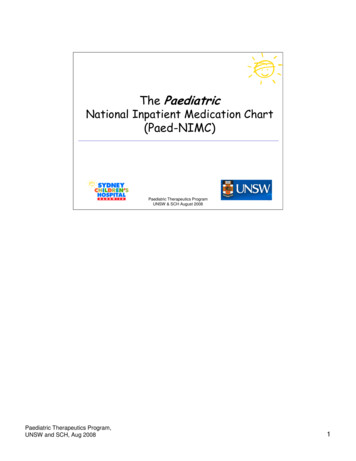
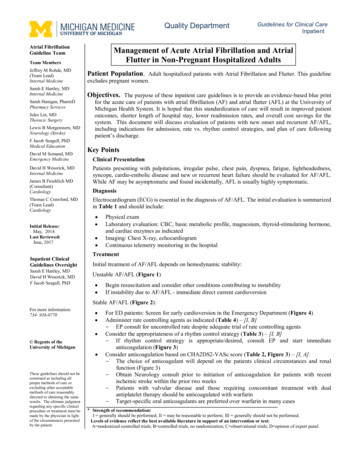
ISSN 2304-3415, Russian Open Medical Journal4 of 62016. Volume 5. Issue 3. Article CID e0305DOI: 10.15275/rusomj.2016.0305MicrobiologyTable 4. Parameters used in the assessement of the infection risk from contaminated products with indicator microbesParameters ofhypdermic needle*Product parametersNL12.00 mmReduction factor (ƒ)**TSL1.50 mmProduct volume (V), mlOD0.36 mmVolume of single dose (ѵ), mlID0.18 mmProduct strength, uESAN0.30 mm2Microorganism .12500.12500.31250.3333,0.16671001004010010040100 Microbial density on the human skin 5 x 10⁵ CFU/mm2 [9].(required data of both Average human dermal surface area 2 x 106 mm2 with microbial population of 1 x 10¹² CFU.S. aureus and P. aeruginosa toPopulation of S. aureus on human skin 1 - 10 CFU/mm2 [10].determine maximum However, other litratures demonstrated that skin population of S. aureus and S. epidermidis is 5% oftheoretical contamination ofskin microbiota [11].the needle) For maximum risk calculation, the assumption would be that most or all the 1/20 of the flora areS. aureus. In the absence of reliable data about the density of P. aeruginosa on the skin, it was selected asS. aureus to be 25000 CFU/mm2 and hence 7500 CFU per the selected needle dimenssions. Thiswould give an equal opprtunity for comparison between two types of infections.* Approximate measurement with digital caliber.** Calculated from selected LR after 7 days of Table 3 from the lowest value in order to challenge the risk evaluation.NL, needle length; TSL, tip slope length; OD, outer diameter; ID, inner diameter; ESAN, exposed surface area of needle.Figure 1. Exponetional relation of dose-response: model of infection fitted to P. aeruginosa (left Fig.) y 0.00011010 * x0.9838960 (R² 0.9998) andS. aureus (right Figure) y 0.00000008 * x0.99998808 (R² 1.0000) based on estimated population intruding the products through contaminated hypodermicsyring needle.Results and DiscussionAET results are demonstrated in Table 3 which exceeded theacceptance criteria of the test by achieving overkill ability ineradicating pharmacopial microbes with notably no recovery ofcolonies in culture plates after seven, 14 and 28 days for each typeof Insulin product. Hence, the lowest cut-off value of bacteria of5.07 (about 1.07 reduction factor within hour) was used ofassessing microbial reduction in the contaminated product.Neutralization procedure is a crucial preliminary test to ensure thevalidity of PET. The applied neutralization technique based onpharmacopeial guide was dilution method according to theprinciple of concentration exponent (η). Phenol (η 6) ten to 100612folds dilution reduce activity by 1 x 10 to 1 x 10 times. Phenoliccompounds (η 4–9.9) ten to 100 folds dilution reduce activity by48919times 1 x 10 – 1 x 10 to 7.9 x 10 – 6.3 x 10 [8]. Hence, thedilution technique in buffer or saline was applied as convinientmethod of stopping antimicrobial activity when testing AET.Primary data that was required for assessing the infection risks areshown in Table 4. Table 4 demonstrated the surface area of thepenetrating part of the needle with the exposed surface areacalculated (using data of microbial density to estimate thetheoretical microbial density on the needle surface) in addition tothe usual dosing system was determined. By determining thestarting contamination level to be 7500 CFU from the table(Figure 1), could be obtained which demonstrated the relationbetween the number of infecting particles and the probability ofinfection from both type of the reference microorganisms. Byassuming the maximum risk by starting contamination with thesecond administration with the same syringe, the product wouldbe exposed to 7500 CFU theoretically. If this practice of misusingthe syringe was not repeated then the washout periods with theassociated risks would be as demonstrated in Table 5.[ 2016, LLC Science and Innovations, Saratov, Russiawww.romj.org
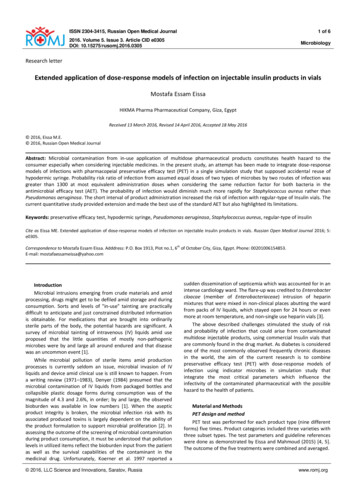
ISSN 2304-3415, Russian Open Medical Journal5 of 62016. Volume 5. Issue 3. Article CID e0305DOI: 10.15275/rusomj.2016.0305MicrobiologyTable 5. Probability of infection from single-spot contamination of nine forms Insulin vial products using S. aureus and P. aeruginosa as modelmicroorganismsInsulin typeSuccessive doses of administration till risk of infection falls below 1:1000000*Highly purified isophanesuspension (100 U-10 ml) vial0.0060, 0.0006, 0.0001 (3 administered doses)S. aureus (subcutaneous)P. aeruginosa (septecemia)7.9603, 0.8147, 0.1612, 0.0318, 0.0063, 0.0012, 0.0002(7 administered doses)Highly purified isophanesuspension (100 U-4 ml) vial0.0164, 0.0016, 0.0003, 0.0001 (4 administered doses)20.1496, 2.1946, 0.4367, 0.0863, 0.0170, 0.0034, 0.0007(7 administered doses)Highly purified isophanesuspension (40 U-10 ml) vialHighly purified regular solution(100 U-10 ml) vial0.0066, 0.0016, 0.0003, 0.0001 (4 administered doses)8.6151, 2.1967, 0.4371, 0.0864, 0.0170, 0.0034, 0.0007,0.0001 (8 administered doses)0.0060, 0.0005, 0.0003, 0.0002, 0.0001, 0.0001, 0.0001 (7administered doses)Highly purified regular solution(100 U-4 ml) vial0.0148, 0.0012, 0.0008, 0.0005, 0.0004, 0.0002, 0.0002,0.0001, 0.0001, (9 administered doses)7.8636, 0.6802, 0.4540, 0.3029, 0.2020, 0.1347, 0.0898,0.0599, 0.0399, 0.0266, 0.0178, 0.0118, 0.0079, 0.0053,0.0035, 0.0023, 0.0016, 0.0010, 0.0007, 0.0005, 0.0003,0.0002, 0.0001, 0.0001, 0.0001 (25 administered doses)18.3950, 1.6797, 1.1230, 0.7501, 0.5007, 0.3341, 0.2228,0.1486, 0.0991, 0.0661, 0.0441, 0.0294, 0.0196, 0.0131,0.0087, 0.0058, 0.0039, 0.0026, 0.0017, 0.0011, 0.0008,0.0005, 0.0003, 0.0002, 0.0002, 0.0001, 0.0001 (27administered doses)Highly purified regular solution(40 U-10 ml) vial0.0059, 0.0012, 0.0008, 0.0005, 0.0004, 0.0002, 0.0002,0.0001, 0.0001 (9 administered doses)7.8152, 1.6810, 1.1238, 0.7506, 0.5011, 0.3343, 0.2230,0.1487, 0.0992, 0.0661, 0.0441, 0.0294, 0.0196, 0.0131,0.0087, 0.0058, 0.0039, 0.0026, 0.0017, 0.0011, 0.0008,0.0005, 0.0003, 0.0002, 0.0002, 0.0001, 0.0001 (27administered doses)Highly purified regular 30% isophane 70% (100 U-10 ml) vial0.0059, 0.0004, 0.0004, 0.0001, 0.0001 (5 administereddoses)7.8249, 0.6019, 0.5345, 0.1192, 0.1058, 0.0236, 0.0209,0.0047, 0.0041, 0.0009, 0.0008, 0.0002, 0.0002 (13administered doses)Highly purified regular 30% isophane 70% (100 U-4 ml) vial0.0156, 0.0012, 0.0010, 0.0002, 0.0002 (5 administereddoses)19.3321, 1.5791, 1.4032, 0.3139, 0.2787, 0.0621, 0.0551(7 administered doses)**Highly purified regular 30% isophane 70% (40 U-10 ml) vial0.0063, 0.0012, 0.0010, 0.0002, 0.0002 (5 administereddoses)8.2401, 1.5800, 1.4050, 0.3141, 0.2791, 0.0621, 0.0552,0.0123, 0.0109, 0.0024, 0.0022, 0.0005, 0.0004, 0.0001,0.0001 (15 administered doses)* The values of probability of infections are actually lower than tabulated results based on the cut-off figure of PET number of 1.07 reduction folds per hourbecause there was no microorganisms recovered in the AET.** Infection risk persists at probability 551:1000000 level with the final dose consumption from the pharmaceutical unit.N.B. The decreasing risk of microbial infection (from initially contaminated product which originated from the reuse of contaminated needle with the secondapplication and use) was determined until either the product vial is used up (i.e. empty) or the risk value has declined till reaching value less 1 per million,which of the nearest.Figure 2: Kruskal-Wallis test: One-Way ANOVA followed by Dunn's multiple comparisons test at P 0.05 of probabilities of infections expressed as percents.Key of x axis: Number (100 or 40 U)/Letter (N, R or M)/Number (10 or 4 ml)/ Letter (S. aureus (S) or P. aeruginosa (P)) Potency (100 or 40 U)/Insulin type/Volume (10 or 4 ml)/Microorganism model (P Pseudomonas aeruginosa or S Staphylococcus aureus).[ 2016, LLC Science and Innovations, Saratov, Russiawww.romj.org
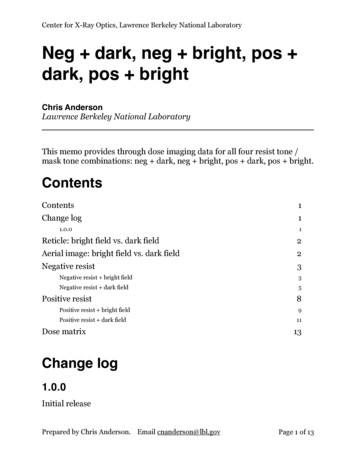
ISSN 2304-3415, Russian Open Medical Journal6 of 62016. Volume 5. Issue 3. Article CID e0305DOI: 10.15275/rusomj.2016.0305It should be noted that the risk of infection is still relativelyhigh at one or two doses following initial contamination, whichthen ceases very rapdily and then steadily decline shallowly.Statistical analysis between groups was demonstrated in (Figure 2)using Kruskal-Wallis test. Also, from Table 5 the geometric averageof the total risk for each product could be calculated and theywere 0.0349%, 0.0936%, 0.0370%, 0.0086%, 0.0140%, 0.0263%,0.0165%, 0.0189% and 0.0179% for P. aeruginosa while they were0.0007%, 0.0009%, 0.0007%, 0.0003%, 0.0005%, 0.0004%,0.0004%, 0.0010% and 0.0008% for S. aureus, with the same ordersequence of products in Table 4. The means were largelydependent on the number of doses and the extent of tailing in theprofile of microbial infection probability.Considerations in selection of the indicator microorganismscan be clearly demonstrated by the fact that Staphylococci arevery common skin flora with notably S. aureus being known aspotenial opportunistic pathogen [9] and has well studied doseresponse model of infection [12]. On the other hand, P. aeruginosais considered one of the most common microbes that infects bloodstream and participate by more than 10% of the Gram-negativehospital and community-aquired septicemia 1997 and the rate ofinfections is 0.064% [13, 14]. It has also a model of infection thatsuites septicemia situations [12].Conclusions and Future DirectionsThe current approach provided quantitative method forassessing the risk possibility of infection from contaminatedmultidose Insulin product. The finding of this simulation studywould provide insight for modeling other methods of infection notonly for injectable products but also for different forms ofmedicinal products including oral liquid and topical drugs. Whilethe present case study has maximized the value of using AET, yet ithighlighted clearly the limitations of the standard method. PETapplied the overkilling principle at relatively long intervals which isnot suitable for the actual in-use situations in which contaminationwith low number bioburden is most likely especially in the currentcase in which the product is physically isolated from theenvironment and the access to the contents is gained through verylimited area (syringe needle). Moreover, administration dosingintervals and volumes plays an important rules for the magnitudeand extent of contamination transfer and hence the possibility ofinfection. The current quantitative risk method applied provided anew insight and approach that can be used as milestone forexperts in the pharmaceutical industry to customize not only theproduct formula, but also all influential parameters that impactthe health and safety of patients.MicrobiologyReferences1.Denyer SP. Microbial contamination of intravenous fluids during use.Br J Pharm Practice 1984; 6: 122-126.2.Arduino MJ, Bland LA, McAllister SK, Aguero SM, Villarino ME, McNeilMM, et al. Microbial growth and endotoxin production in theintravenous anesthetic propofol. Infect Control Hosp Epidemiol 1991;12(9): 535-539. (PMID: 1940276)3.Koerner RJ, Morgan S, Ford M, Orr KE, McComb JM, Gould FK.Outbreak of Gram-negative septicaemia caused by contaminatedcontinuous infusions prepared in a non-clinical area. J Hosp Infect1997; 36(4): 285-289. (PMID: 9261758)4.USP 36-NF31, Chapter 51. Antimicrobial effectiveness testing. UnitedStates Pharmacopoeia 36/National Formulary 31, Baltimore, MD, USA,2014.5.Eissa ME, Mahmoud AM. Assessment of modified preservationformulae after optimizing preliminary neutralization evaluation study.International Journal of Multidisciplinary Research Studies andDevelopments 2015; 1(2): 5-11.6.Rose JB, Haas CN. A risk assessment framework for the evaluation ofskin infections and the potential impact of antibacterial soap washing.Am J Infect Control 1999; 27(6): S26-S33. (doi: 10.1016/S01966553(99)70039-8) (PMID: 10586143)7.Hazlett LD, Rosen DD, Berk RS. Age-related susceptibility toPseudomonas aeruginosa ocular infections in mice. Infection andimmunity 1978; 20(1): 25-29. (PMID: 669795)8.USP 36-NF31, Chapter 1227. Validation of microbial recovery frompharmacopeial articles. United States Pharmacopoeia 36/NationalFormulary 31, Baltimore, MD, USA, bookofbacteriology.net. 2006 [cited 15 March 2015]. Availablefrom: http://www.textbookofbacteriology.net/10. Kowalski W. Hospital airborne infection control. Boca Raton, Fla.: CRCPress, 2012.11. Grice EA, Kong HH, Renaud G, Young AC, Bouffard GG, Blakesley RW,et al. A diversity profile of the human skin microbiota. GenomeResearch 2008; 18(7): 1043-1050. (doi: 10.1101/gr.075549.107) (PMID:18502944)12. ki.canr.msu.edu. 2016 [cited 13 April 2015]. Available from:http://qmrawiki.canr.msu.edu/index.php?title Dose response assessment13. Diekema DJ, Pfaller MA, Jones RN, Doern GV, Winokur PL, Gales AC, etal. Survey of bloodstream infections due to gram-negative bacilli:frequency of occurrence and antimicrobial susceptibility of isolatescollected in the United States, Canada, and Latin America for theSENTRY Antimicrobial Surveillance Program, 1997. Clin Inf Dis 1999;29(3): 595-607. (doi: 10.1086/598640) (PMID: 10530454)14. Al-Hasan MN, Wilson JW, Lahr BD, Eckel-Passow JE, Baddour LM.Incidence of Pseudomonas aeruginosa bacteremia: a population-basedstudy. Am J Med 2008; 121(8): 702-708. (PMID: 18691484) his work was supported partially financially by HIKMA Pharmapharmaceutical company – 2nd Industrial zone – 6th of October city. Thepractical part of all experiments was performed in the microbiologylaboratory in the quality control department. Thanks to Mr. Ahmed SaberNouby for supplying technical assistance with work in PET. Data gatheringand issuing was performed by HIKMA microbiology laboratory team.Reference and writing style review was performed by Dr. Engy RefaatRashed.Authors:Mostafa Essam Eissa – MSc, Quality Control Section Head, MicrobiologyLaboratory Division, HIKMA Pharma Pharmaceutical Company, Giza, Egypt.Conflict of interestThe author declares that he has no conflict of interest.[ 2016, LLC Science and Innovations, Saratov, Russiawww.romj.org
Keywords: preservative efficacy test, hypodermic syringe, Pseudomonas aeruginosa, Staphylococcus aureus, regular-type of insulin Cite as Eissa ME. Extended application of dose-response models of infection on injectable insulin products in vials. Russian Open Medical Journal 2016; 5: e0305. Correspondence to Mostafa Essam Eissa.