Transcription
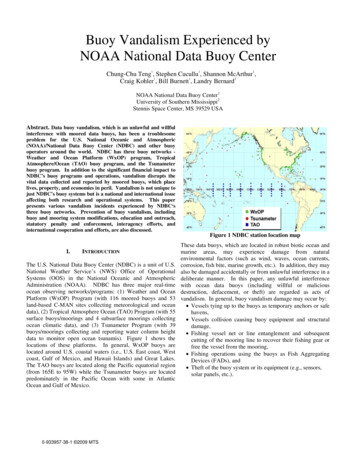
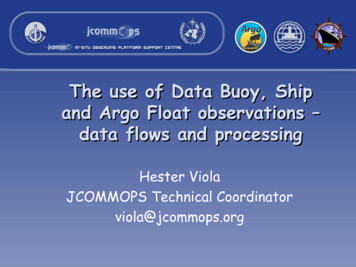
IABP Buoy Positions
IABP Deployment Plans for 2004SPRING NPEO (Multiple buoysprovided by NOAA/PMEL,JAMSTEC, & CRREL) EC/NIC- CES (80N 120W, &80N 130W)SUMMER IARC/NABOS Cruise – 2NOAA-PSC IMB (North ofLaptev Sea). CRREL/WHOI Cruise – 2NOAA-CRREL IMB & 4WHOI Ocean Profiling buoys. WHITE TRIDENT Flight –7ICEXAIR buoys (Only 1 buoyhas been contributed so far!)
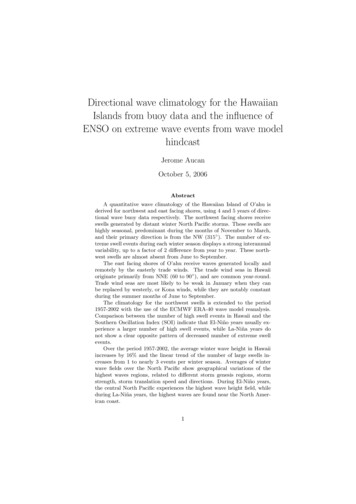
IABP Data &Weather ForecastingCANADAArcticOceanRUSSIAAlaskaThe observations (red dots) from the IABP are essential for analyzing and forecasting weatherfeatures in the Arctic. In this example, we show storm approaching Alaska from the ArcticOcean. The IABP observations are essential in detecting and determining the strength andtrajectory of storms from the Arctic Ocean. (Figure provided by Eric Stevens, NWS/NOAA,Fairbanks, AK)
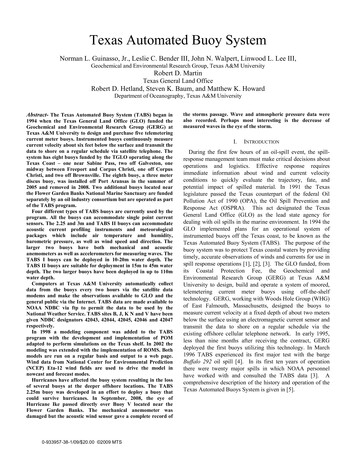
IABP Data & Arctic Climate Change:Sea level pressure has decreased[1987 to 1994 minus 1979 to 1986]Dramatic changes in Arctic climate have been noted during the past twodecades. Observations from the IABP have played a significant role in thedetection of this change over the Arctic Ocean. For example, one of the firstindications of Arctic climate change was noted by Walsh et al. (1996) usingIABP data.These figures show the mean field of SLP and ice motion for 1979–1986 (left), 1987-1994 (middle), and thedifference between these two 8-year periods (right). These figures show a cyclonic anomaly in circulation,which has been linked to the Arctic Oscillation (Rigor, et al. 2002).
IABP Data & Arctic Climate Change:Warming of the ArcticThese figures show that the warming foundover land extends over the Arctic Ocean,and is strongest during spring. Black dotsshow areas where the trends are significantat the 95% confidence limit. (Adaptedfrom Rigor, et al. 2000.)
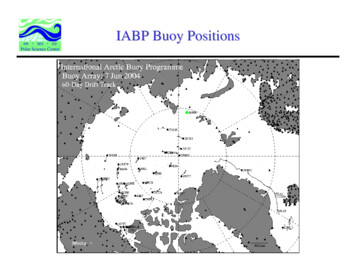
IABP Data &Model Validation: PIPS 2.0Validation of Polar Ice PredictionSystem (PIPS) 2.0 Ice Motion (topright) against IABP SLP and buoymotion (top left). The lower figuresshowtheanalyzediceconcentration (bottom left) andthickness (bottom right). Courtesyof Ruth Preller, NRL.
IABP Data &Age of Sea-Ice Animation Age of Ice Model:RussiaOpen WaterEuropeFY Ice2Y Ice1.Advects ice using griddedice motion from buoysand drifting stations;2.Forms new ice over openwater each fall;3.Tracks age of ice thatsurvives summer melt. Time is shown on topleft.3Y IceAlaska10 Year IceCanadaAge:OW 0 12 3 4 5 6Greenland810 Some things to note:1.) Large area of oldice in the 1980’s.2.) Area of old icedecreases with stepto high ArcticOscillation phase in1989.3.) Area of old icecontinues todecrease in 1990’s.4.) Younger icepersists throughtoday.
IABP Data &Predicting Summer Sea Ice ExtentAge of IceSeptember 1983September 2001OpenWaterYoungIceYoungIceOpenWaterOldIceOldIce Area of old ice has decreased dramatically during the last 15 years. These changes are related to the Arctic Oscillation.Age:OW 0 12 3 4 5 6810
Predicting Summer Sea Ice ExtentVariance Explained by Age of Icer 0.8r 0.7016.633.350.066.7% Variance Explained83.3100
Recent Progress Towards Establishing anArctic Ocean Observing SystemThe Vision
IABP ResultsThe IABP provides meteorological and oceanographic data for real-timeoperational requirements and research purposes including support to theWorld Climate Research Programme (WCRP) and the World WeatherWatch (WWW) Programme.Data from the IABP have many uses. For example: Forecasting weather and ice conditions, Research in Arctic climate and climate change, Validation of satellites, Forcing, validation and assimilation into numerical climate models, and Tracking the source and fate of samples taken from the ice.Over 450 publications have benefited from observations from the IABP!!!For a list of these publications, click on http://IABP.apl.washington.edu/Citations.
IABP OrganizationThe IABP encourages participation by all groups, nationally andinternationally.The Backbone variables are needed by operational centers and are ingestedinto forecast-analysis models. They are also needed as high qualityanalyzed fields by the research community.The temporal sampling, accuracy and spacing of IABP sensors are determinedby analysis of the scales of phenomena to be resolved, e.g. synoptic scaleatmospheric pressure systems and associated ice motion; interannual andinterdecadal anomalies of SLP, T, Ice Velocity.Higher sampling rates, denser arrays, are welcomed.Centralized responsibilities: Deployment plans; Logistics coordination;Communications and data transmission and ingestion; Production anddissemination of data sets; Outreach and PR.
IABP Data & Model Validation: PIPS 2.0 Validation of Polar Ice Prediction System (PIPS) 2.0 Ice Motion (top right) against IABP SLP and buoy motion (top left). The lower figures show the analyzed ice concentration (bottom left) and thickness (bottom right). Courtesy of Ruth Preller, NRL.