Transcription
Staff White PaperEconometric Analysis on the InitialImplementation of CAM RequirementsOctober 20201Michael J. GurbuttDeputy Director, Office of Economic and Risk Analysis, PCAOBWei-Kang ShihAssociate Director, Office of Economic and Risk Analysis, PCAOB1The views expressed in the paper are the views of the authors and do not necessarily reflect the views of the Board, individualBoard members, or other PCAOB staff. In preparing this paper, we benefited from insightful comments received duringdiscussions with PCAOB staff and Board members. We would also like to thank Nayantara Hensel and Brandon Gipper for helpfuldiscussions and comments. In addition, we are grateful to Pian Chen, Shalini McAdams, Sungho Noh, Pete Pacilio, Zoe Pham,Vikram Ramadas, Ricci Reber, Josh Smith, and Thomas Wanat for their research support.
TABLE OF CONTENTSI.Executive Summary . 3Key Findings from Econometric Analysis . 3II.Scope and Analytical Framework . 4III. Related Academic Research . 5IV. Data . 5V.Descriptive Statistics. 6VI. Results and Discussion. 7Investor Responses . 7Audit Fees and Audit Hours . 8Audit Fees .8Audit Hours .9Time to File the Audit Report . 10References . 11Appendix A. Data Definitions . 12Appendix B. Tables and Figures . 14Appendix C. Academic Research on the Implementation of CAMs . 24Appendix D. Potential Confounding Factors and Background on Other Robustness Tests . 25Potential Confounding Factors. 25COVID-19 Pandemic .25CAM Dry Runs.25Recent changes in FASB accounting standards .26Financial and/or Macroeconomic Events .26Other Robustness Tests . 26Weighted Regressions .26Restrict the Sample to One Year around Implementation .26Econometric Analysis on the Initial Implementation of CAM Requirements 2
I. EXECUTIVE SUMMARYThe PCAOB is committed to understanding the impact of critical audit matter (CAM) requirements onaudit firms, preparers, audit committees, investors, and other financial statement users.2 As part of thatcommitment, Office of Economic and Risk Analysis (ERA) staff has performed an analysis to assess theinitial implementation of the CAM requirements. To provide transparency around our findings, ERA staffhas prepared two white papers to provide insight into the technical details of our analysis. This whitepaper presents results from econometric analysis on the initial effects of CAM implementation on auditsand capital markets. The other white paper, “Stakeholder Outreach on the Initial Implementation of CAMRequirements”, provides information regarding the results of various outreach efforts related to initialCAM implementation. Collectively, these two papers provide early evidence on the initial implementationof the CAM requirements.3We employ two commonly used research methods to estimate the effects of the initial CAMimplementation:1) descriptive analysis of trends before and after the implementation of CAMs (i.e., a “pre-postanalysis”) and2) a difference-in-differences analysis to compare outcome variables (audit fees, audit hours,number of days to file the audit report, and investor responses in the stock market) for issuerswhose auditors communicated CAMs in the audit report (or determined that there were no CAMsto report) with those for issuers whose auditors are not (yet) required to include CAMs in theiraudit reports.4In conducting the econometric analysis, we gathered and analyzed data from a number of sources,including (1) information collected through the PCAOB’s inspection program and (2) third-party data fromAudit Analytics, CRSP/Compustat, and S&P Capital IQ.Key Findings from Econometric Analysis-Investor Responses: Using information from issuers’ stock market returns, we assess capitalmarket effects related to initial CAM implementation. Specifically we examine the absolutecumulative abnormal returns (3-Day ACAR)5—a measure that captures the unanticipated changesin issuers’ stock returns in the three-day window around their annual financial filings and reflects2For more background on CAM requirements and related materials, see the PCAOB’s online resource titled New Auditor’s Report(“CAM Implementation Page”), available at e staff is unable to evaluate all possible costs and benefits of the CAM requirements (e.g., because some potential effects maytake more time to manifest or stabilize). In addition, the results presented in this paper may not be predictive of the effect of theCAM requirements for audits of other companies to which the requirements will apply. In some cases, results are based on limiteddata and may not be generalizable to the entire stakeholder population. Further discussion of economic considerations related tothe CAM requirements is available in the PCAOB’s Adopting Release.4The CAM requirements took effect for audits for fiscal years ending on or after June 30, 2019, for large accelerated filers and willtake effect for audits for fiscal years ending on or after December 15, 2020 for all other issuers to which the requirements apply.5See Appendix A for the definition. Academic researchers use an event study approach to measure the impact of significantcorporate events (such as the filings of 10-K or other annual statements, and changes in accounting and audit policies) onabnormal returns. Thus, an increase in 3-Day ACAR suggests that investors find the disclosed information value-relevant and use itto make their investment decisions.Econometric Analysis on the Initial Implementation of CAM Requirements 3
the information provision of CAMs communicated in audit reports. Consistent with emergingacademic research, we do not find systematic evidence that investors respond to the informationcontent in CAMs in the first year of implementation. Nevertheless, the staff’s stakeholderoutreach finds that some investors are reading CAMs and find the information beneficial. Werecognize that the full benefits of CAM communications to investors may take more time tomaterialize (e.g., as investor awareness of CAMs becomes more widespread and as comparativedata on CAMs becomes available within issuers and across time).-Audit Fees and Audit Hours: We use information on audit fees and audit hours to estimate costs ofinitial CAM implementation for individual audits. We do not find systematic evidence from thisanalysis of increased engagement-level costs (in terms of audit fees and audit hours) associatedwith initial CAM implementation in the first year of implementation. Emerging academic researchon CAMs does not find a relationship between initial CAM implementation and audit fees;similarly, the staff’s stakeholder outreach activities find that costs to issuers from initial CAMimplementation have been largely inconsequential. Engagement partners report that, on average,about 1% of total audit hours were spent identifying, developing, and communicating CAMs.Other costs incurred by audit firms and issuers to implement the new requirements are discussedin the related white paper on stakeholder outreach.-Time required to file audit reports: During the rulemaking process, some commenters expressedconcern that, as a result of the additional effort required to determine, communicate, anddocument CAMs, auditors would take longer to issue their reports.6 We examine changes in thetime taken to issue audit reports and find no evidence of delays associated with initial CAMimplementation.II. SCOPE AND ANALYTICAL FRAMEWORKIn this paper, we perform an econometric analysis to examine the effects of CAM implementation on thefollowing outcome measures. We assess the abnormal stock returns around the filing dates of annualreports—a measure of information provision of CAMs communicated in audit reports. We also examinewhether auditors and companies incur costs, in terms of increased audit hours and audit fees charged toissuers, related to CAMs. Finally, we assess whether implementing the new requirements changes thenumber of days taken to issue audit reports.To perform the analysis we use two methods commonly used in research. First, we provide a descriptiveanalysis of trends before and after the implementation of CAMs. For this analysis we use data from theissuer audits whose audit reports contain CAMs (including those where the auditor determined therewere no CAMs to report), and rely on the estimated results from the following model:𝐷𝑒𝑝𝑒𝑛𝑑𝑒𝑛𝑡 𝑉𝑎𝑟𝑖𝑎𝑏𝑙𝑒 𝛼 𝛽1 𝑃𝑜𝑠𝑡 Σ𝛽𝑖 𝐼𝑛𝑑𝑒𝑝𝑒𝑛𝑑𝑒𝑛𝑡 𝑉𝑎𝑟𝑖𝑎𝑏𝑙𝑒𝑠𝑖 Σ𝛽𝑗 𝐹𝑖𝑥𝑒𝑑 𝐸𝑓𝑓𝑒𝑐𝑡𝑠𝑗 𝜖 (1)Post is an indicator variable equal to one if the fiscal year-end of the issuer’s financial statements falls onor after June 30, 2019; and 𝛽1 is the coefficient of interest, denoting the change in the dependent variableafter CAM implementation for the issuers with CAMs in the audit report (including audit reports wherethe auditors determined that there were no CAMs to communicate). The dependent variables includeabnormal stock returns around the filing dates of annual reports (3-Day ACAR), audit fees (Log Audit Fees),audit hours (Log Audit Hours), and number of days to issue the audit report (Log Days to File). We also6See The Auditor’s Report on an Audit of Financial Statements when the Auditor Expresses an Unqualified Opinion and RelatedAmendments to PCAOB Standards, PCAOB Release No. 2017-001 (June 1, 2017) at 89.Econometric Analysis on the Initial Implementation of CAM Requirements 4
include a list of independent variables and fixed effects that are commonly used in academic literature tocontrol for other issuer and audit characteristics in the regression (e.g., Gutierrez et al, 2018 and Reid etal, 2019). Please see Appendix A for definitions of these variables.Second, we use a difference-in-differences analysis to examine the potential effects of CAMimplementation. In this analysis we take advantage of the staggered implementation to attempt to isolateeffects associated with implementing CAMs from other confounding factors (e.g., changes in theaccounting standards and macroeconomic environment). To do so we compare outcomes for issuers forwhich the CAM requirements apply and the auditor either communicated CAMs in the audit report, orcommunicated that there were no CAMs (collectively referred to as “CAMs Issuers” throughout thispaper), with other issuers that are required to comply with the new requirements for fiscal year endsending on or after December 15, 2020,7 and emerging growth companies exempted from the CAMrequirements (collectively referred to as “Comparison Issuers” throughout this paper).8 We rely on theestimated results from the following model:𝐷𝑒𝑝𝑒𝑛𝑑𝑒𝑛𝑡 𝑉𝑎𝑟𝑖𝑎𝑏𝑙𝑒 𝛼 𝛽1 . 𝑃𝑜𝑠𝑡 𝛽2 . 𝐶𝐴𝑀𝑠 𝛽3 . 𝑃𝑜𝑠𝑡 𝐶𝐴𝑀𝑠 Σ𝛽𝑖 𝐼𝑛𝑑𝑒𝑝𝑒𝑛𝑑𝑒𝑛𝑡 𝑉𝑎𝑟𝑖𝑎𝑏𝑙𝑒𝑠𝑖 Σ𝛽𝑗 𝐹𝑖𝑥𝑒𝑑 𝐸𝑓𝑓𝑒𝑐𝑡𝑠𝑗 𝜖 (2)Similar to equation (1), Post is an indicator variable that equals one if the fiscal year end of the issuer’sfinancial statements audit falls on or after June 30, 2019. CAMs is an indicator variable that equals one forCAM Issuers and zero for Comparison Issuers. 𝛽3 is the coefficient of interest, denoting the differencebetween: the change over time in the dependent variable for the issuers whose audit reports containCAMs or the auditors determined that there were no CAMs to communicate, and the change for thoseissuers whose audit reports do not (yet) contain CAMs.III. RELATED ACADEMIC RESEARCHSeveral academics have begun to examine the initial implementation of CAM requirements in the U.S.using archival data. Appendix C summarizes the findings from these emerging studies. Our econometricanalysis complements this research by analyzing data collected through the PCAOB’s inspection programor obtained from third party providers such as Audit Analytics, CRSP/Compustat, and S&P Capital IQ.IV. DATAWe collect three years of audit, issuer financial, and stock market data for CAMs Issuers and ComparisonIssuers. The three-year time period corresponds to the fiscal year 2019 audits (post CAMs requirement orpost) that were filed prior to May 15, 2020 (with fiscal year ends ranging between June 30, 2019 andFebruary 3, 2020), and audits for fiscal years 2017 and 2018 (pre CAMs requirement or pre).9 Table 17 Seefootnote 4 for a description of the issuer audits for whom the CAM requirements do not currently apply.8Communication of CAMs are not required for emerging growth companies (EGCs), audits of brokers and dealers, investmentcompanies (other than business development companies), and employee stock purchase, savings, and similar plans. See AS3101.05(b). Though the standard excludes emerging growth companies (EGCs) from applying the CAM requirements, we includeEGCs in the econometric analysis as they are similar in operating structure to issuers that have to comply with the CAMrequirements.9We use the first effective date for CAM requirements to construct the pre and post periods. For example, the post periodrepresents audits with fiscal year-ends June 30, 2019 through February 3, 2020. We exclude issuers with fiscal year-ends afterFebruary 3, 2020, or issuers with fiscal year-ends before February 3, 2020 that filed annual reports after May 15, 2020, tomaximize the number of observations and to publish a timely report in 2020, before the CAM requirements take effect for otherissuers to whom the requirements apply.Econometric Analysis on the Initial Implementation of CAM Requirements 5
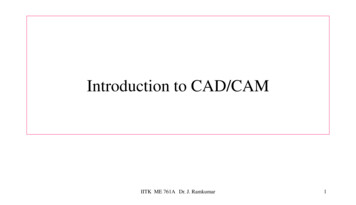
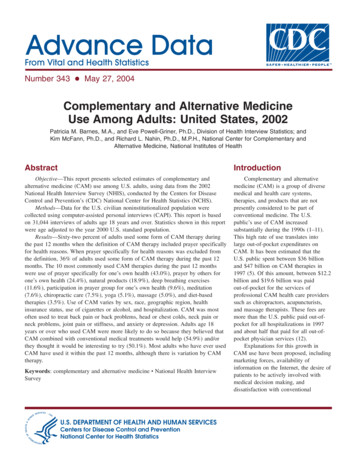
contains details on the sample selection process and reports final sample counts for the analyses on theoutcomes of interest. The final samples include only those issuer audits with data on outcome andexplanatory variables for consecutive years across both the pre and post periods.V. DESCRIPTIVE STATISTICSIn this section, we describe the characteristics of CAMs communicated in the 2,220 audit reports in oursample. As shown in Figure 1, about half of the audit reports (1,118 or 50.4%) contain a single CAM whileabout one-third include two CAMs (761 or 34.3%). Of the remaining audit reports, 257 (11.6%) includethree CAMs and 72 (3.2%) include four or more CAMs. Moreover, in 12 audit reports the auditordetermined that there were no CAMs. The average number of CAMs communicated is 1.7.Figure 1 Audit Reports by Number of CAMs1,2001,118No. of Audit Reports1,000761800600400257200571214157001234No. of CAMsOverall, the five most frequently communicated CAM topics are “Revenue Recognition,” followed by“Goodwill,” “Other Intangible Assets,” “Business Combinations,” and “Accruals and Reserves” (Figure 2).We also observe that the most common topics differ by industry sectors in expected ways. For example,Figure 3 in Appendix B shows that the most frequently communicated CAMs in the financial industrysector is “Allowance for Loan Losses,” whereas it is “Property, Plant, and Equipment” for issuers in theenergy sector.Econometric Analysis on the Initial Implementation of CAM Requirements 6
Figure 2 Most Frequently Communicated CAMsCAM TopicsRevenue Recognition555Goodwill415Other Intangible Assets353Business Combinations329Accruals and Reserves2840100200300400500600No. of Audit ReportsNote: CAM topics are based on a PCAOB internal taxonomy.VI. RESULTS AND DISCUSSIONIn this section, we present results and discuss our findings. In our evaluation of the various outcomemeasures, the pre-post analysis uses the issuer-year observations only for CAMs Issuers, whereas thedifference-in-differences analysis uses data from both sets of issuers (CAMs Issuers and ComparisonIssuers).10Investor ResponsesWe use information from the issuers’ stock market returns to assess the capital market effects related toCAMs. We do not find systematic evidence that investors respond to the information content in CAMs inthe first year of implementation. Specifically, we examine the absolute cumulative abnormal returns (3Day ACAR)—a measure that captures the unanticipated changes in issuers’ stock returns in the three-daywindow around their annual filings—for 2,017 CAMs Issuers and 1,448 Comparison Issuers, to obtain10,341 issuer-year observations over the two pre- and one post- year periods. (See Table 1).We estimate the statistical models for the pre-post and difference-in-differences analyses with theabnormal return measure 3-Day ACAR as the dependent variable.11 After controlling for factors that affect10Figure 4 in Appendix B presents the trends in audit and capital market outcome measures in the sample period. Our visualinspection of the trends in the pre periods for both CAM Issuers and Comparison Issuers suggests that the parallel trendassumption for the difference-in-difference analysis holds for these outcome measures.11See equations (1) and (2) for the statistical models. Also, see Appendix A and Table 2 for the definitions and the descriptivestatistics of the explanatory variables included in the statistical models, respectively.Econometric Analysis on the Initial Implementation of CAM Requirements 7
stock returns,12 the regression results in column (1) of Panel A in Table 3 indicate, on average, astatistically significant 0.8% increase in the abnormal returns for the CAMs Issuers, over the pre and thepost periods. To examine the potential effects of CAM implementation, column (2) in the same panelpresents results from comparing the change in the returns for CAMs Issuers with those of the ComparisonIssuers (i.e., a difference-in-differences analysis). Results from this analysis indicates, on average, a 2.7%decrease in the abnormal return measure for CAMs Issuers over the pre and post period, relative to thechange for the Comparison Issuers. Column (3) presents the results from comparing the change in theabnormal returns measure for CAMs Issuers with a weighted combination of Comparison Issuers—whereby Comparison Issuers that are more similar to the CAMs Issuers receive greater weights in theanalysis.13 The results for the weighted regression are similar to those for the unweighted regression.Our results can be explained by the market disruptions due to the COVID-19 pandemic as well asobservations from the staff’s stakeholder outreach. First, we observe high levels of market volatilityassociated with the COVID-19 pandemic in the U.S., specifically after mid-February 2020—when a largenumber of Comparison Issuers filed their Form 10-K or other annual statements. To reduce the impact ofthe pandemic on our analysis, in column (4) we repeat the analysis from column (2) but exclude issuerswith a filing date after February 15, 2020.14 The effect sizes drop by several orders of magnitude,indicating that the pandemic is a significant driver of the results in column (2). Moreover, the change inthe abnormal returns for CAMs Issuers in relation to the Comparison Issuers in the post period(Post CAMs) becomes statistically insignificant.15 Second, comments received from two investorsrepresentatives to the staff’s public request for comment (RFC) and the results of the staff’s investorsurvey suggest that, while investors believed CAMs can improve their ability to analyze financialstatements, the full benefits of CAMs may take some time to materialize (e.g., as investor awareness ofCAMs becomes more widespread and as comparative data on CAMs becomes available within issuers andacross time).16Audit Fees and Audit HoursWe use information on audit fees and audit hours to estimate costs of initial CAM implementation forindividual audits. Other costs incurred by audit firms and issuers to implement the new requirements arediscussed in the related white paper on stakeholder outreach.Audit FeesWe use data from 1,987 CAMs Issuers and 1,647 Comparison Issuers, to obtain 10,856 issuer-yearobservations over the two pre- and one post- year periods (see Table 1). A comparison of the average LogAudit Fees (shown in Panel A of Table 4) indicates an increase in audit fees for CAMs Issuers over the pre12We include Log Market Cap, Return on Assets, Book to Market Ratio, Loss Indicator, Cash Flow Volatility, Leverage, Sales GrowthVolatility, and Stock Beta, and audit firm and issuer industry fixed effects as control variables. Definitions for all variables areprovided in Appendix A.13See Appendix D for further details on weighted regressions.14See Appendix D for further details on identifying issuers affected by the COVID-19 pandemic.15In column (4), we exclude the issuers with a filing date after February 15, 2020 across both the pre and the post periods. As thisresults in a significant drop in the number of observations (10,341 to 2,173), we repeat the analysis and exclude issuers with thepost-mid-February filing date only in the post period. In unreported results, the sign on Post CAMs becomes negative but is stillstatistically insignificant.16See discussion in the white paper, “Stakeholder Outreach on the Initial Implementation of CAM Requirements.”Econometric Analysis on the Initial Implementation of CAM Requirements 8
and post periods. After controlling for factors that typically affect audit fees,17 the regression results incolumn (1) of Panel A in Table 5 indicate, on average, a statistically significant 1.1% decrease18 in auditfees for CAMs Issuers over the pre and the post periods. Column (2) in the same panel presents the resultsfrom comparing the change in audit fees for CAMs Issuers with that of the Comparison Issuers (i.e., adifference-in-differences analysis). Results from this analysis indicate, on average, a statistically significant2.2% decrease in audit fees for CAMs Issuers over the pre and post period, relative to the change for theComparison Issuers.19 Column (3) presents the results from the weighted regression, suggesting thechange in the audit fees for CAMs Issuers over the pre and post period, relative to the change for theComparison Issuers, becomes statistically insignificant.20Overall, the results of our econometric analyses do not suggest that initial CAM implementation isassociated with an increase in audit fees in the first year of implementation. Our results generally alignwith emerging academic research, stakeholder responses to the staff’s public RFC, and the staff’sinterviews of preparers and audit committee chairs. In particular, stakeholders generally reported low orinconsequential changes to audit fees related to CAMs.Audit HoursWe obtain total audit hours for both the pre and post periods from the six U.S. Global Network Firms21(U.S. GNFs) and repeat the audit market analysis described above with Log Audit Hours as the outcome ofinterest.22 A comparison of the average Log Audit Hours (shown in Panel A of Table 4) indicates anincrease in audit hours for CAMs Issuers over the pre and post periods. After controlling for other factorsthat typically affect audit hours,23 we still find a statistically significant increase in the post period. Theregression results in column (1) of Panel B in Table 5 indicate, on average, a 3.7% increase in audit hoursfor CAMs Issuers over the pre and the post periods.24 Column (2) in the same panel presents the resultsfrom comparing the change in audit hours for the CAMs Issuers with those of the Comparison Issuers (i.e.,a difference-in-differences analysis). This analysis shows that audit hours increase for both sets of issuers,17We include Log Total Assets, Book-to-Market Ratio, Cash Flow to Total Assets, Leverage Ratio, Sales Growth, Quick Ratio,Intangible Assets to Total Assets, Receivables to Total Assets, Inventory to Total Assets, Merger Indicator, Restructuring Indicator,BigR Announcement Indicator, December Year-End Indicator, Loss Indicator, Multinational Corporation Indicator, ICFR GroupIndicator, Going Concern Indicator, New Client Indicator, and audit firm and issuer industry fixed effects as control variables.Definitions for all variables are provided in Appendix A.18The percentage change from the pre to the post period is calculated as 100 x [exp(Post)-1]. Given the estimated coefficient forthe Post variable in column (1) is -0.0112, the change is -1.1% (100 x [exp(-0.0112) – 1]).19The percentage change from the pre to the post period for CAMs Issuers, relative to the change for the Comparison Issuers, iscalculated as 100 x [exp(PostxCAMs)-1]. Given the estimated coefficient in column (2), the change is -2.2% (100 x [exp(-0.0226) –1].20See Appendix D for further details on the weighted regressions. Column (4) is similar to column (2) except that we exclude datafor issuers that could be affected by the recent COVID-19 pandemic. See Appendix D for further details on how we identify issuersaffected by the COVID-19 pandemic.21The information on the six global networks that contain the largest number of registered, non-U.S. firms is available on thePCAOB website at lNetworkFirms.aspx.22We exclude smaller audit firms from the analysis based on the extent of the available data in the post period.23See footnote 17.24Given the estimated coefficient for the Post variable in column (1) is 0.0370, the change is 3.7% (100 x [exp(0.0370) – 1]).Econometric Analysis on the Initial Implementation of CAM Requirements 9
with a larger increase for the comparison group.25 The difference between the increases in audit hours forthe two groups manifests as a negative sign, and we estimate a statistically significant decrease of 5.5% inaudit hours for CAMs Issuers, relative to the change for the Comparison Issuers.26 Similarly, results fromthe weighted regression in column (3) also suggest a negative and statistically significant difference-indifferences estimate.Overall, our econometric analysis suggests that, on average, CAM implementation is associated with adecrease in audit hours. Given that the amount of time engagement partners reported spending on CAMsis relatively small compared to total audit hours,27 it is not surprising that our econometric analysis doesnot find evidence of an increase in engagement-level audit hours associated with initial CAMimplementation. The relative decrease may be explained by other unobservable factors. For example, it ispossible that LAF audits benefit from unidentified economies of scale (e.g., fixed costs associated withimplementation of new accounting standards). The result could also be due to potential variation acrossaudit firms and engagement teams in their use of charge codes to record CAM-related audit hours.Time to File the Audit ReportAs described in the adopting release of the new auditing standard, some commenters expressed concernthat, as a result of the additional effort required to determine, communicate and document CAMs,auditors would take longer to issue their reports.28 We examine changes in the time taken to issue auditreports and find no evidence of delays associated with initial CAM implementation.We report the results from our pre-post and difference-in-differences analyses in Panel C of Table 5. Onaverage, issuers in the CAMs Issuers group took slightly less time to file the report in the post period.Results in either columns (2) and (3) suggest an average decrease of only a fraction of a day.29 Theestimated increase for issuers in the Comparison Issuers group (coefficient for Post in column (2))
has prepared two white papers to provide insight into the technical details of our analysis. This white paper presents results from econometric analysis on the initial effects of CAM implementation on audits and capital markets. The other white paper, "Stakeholder Outreach on the Initial Implementation of CAM