Transcription
Hydraulic AnalysisUsing HEC-RAS10 Stepsfor aBasic HEC-RAS Analysis
HEC-RAS: 10 Steps1. Start a New HEC-RAS Project2. Set Up the River Reach3. Plan Cross-Sections4. Enter Cross-Section Data5. Add the Road Deck6-culvert. Add the Culvert Data6-bridge. Add the Bridge Data7. Add Ineffective Flow Areas8. Input Steady Flow Data9. Run Model, View Output10. Add Proposed Structure
HEC-RAS: 10 StepsThese 10 steps can be used with simple culvert and bridge analyses.This approach will help you get familiar with HEC-RAS and ready formore complex projects. To download HEC-RAS, go to the US ArmyCorps of Engineers web site. (Search HEC-RAS).Before using HEC-RAS for your project, you will need to collect thefollowing cross-sectional information: channel shape (from maps or field measurement)stream slope (from maps or field measurement)structure specificationsflow data (get from DEQ – Hydrologic Studies)
Sample Problem Replace an existing culvert with a larger culvert Issue: CRC wants to replace the existing culvert with a longer culvert. The proposeddesign increases the size of the culvert as well. Will the larger culvert offset the factthat the culvert will be longer? Existing Culvert:––––––– Length-- 32’.CMP, 42” diameterLow point of road: el 588.20Width of road: 18 feetStream bottom sandy but stonyStream banks weedy with small brushStream invert elevation 579.00Proposed Culvert:–––Length– 54’.Concrete Elliptical, 60”x38”Road elevations and width will remain the same
1. Start a New HEC-RAS Project. Open HEC-RAS, in the main window, click on the File, then New Project. In theNew Project window, type in Title and File name (ex., Simple Project andsimpleproject.prj). Click OK. You end up back at the main window entitled HECRAS River Analysis System.There are two main types of data to enter: Geometric Data, describing the riverchannel setting and the structure, and Steady Flow data describing the water andflow characteristics.
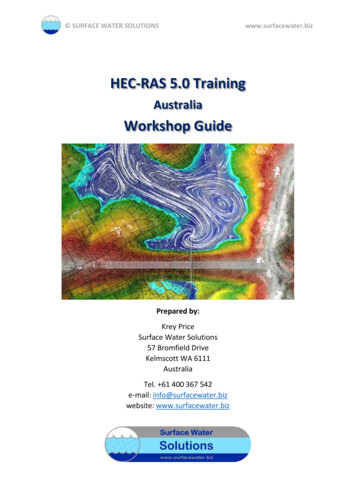
2. Set Up the River Reach In the main window, click on Edit, then GeometricData.
2. Set Up the River Reach In the Geometric Data window, click on the River Reach button. The cursorbecomes a pencil. Draw a line representing the stream in the direction ofupstream to downstream. It helps to draw the stream in the same position ason a map with north at the top. Don’t worry about meanders—just one line.Click, drag, double click. Enter river name and reach name at the prompt.
3. Plan Cross-Sections First on a scratch paper, figure out where toposition the cross-sections. Determine thelength of the structure, parallel to the river,then add a cross-section 2–5’ upstream andanother 2-5’ downstream of structure. Numbering runs low to high from downstreamto upstream.Suggestion: Put the structure centerline at 0. Add additional cross-sections to define thechannel further upstream and downstream.Use more cross-sections for irregularchannels.Suggestion: Use negative numbers fordownstream cross-sections and positivenumbers upstream.
3. Plan Cross-Sections Next, sketch the channel cross-sectionshowing stations and elevations. Numbering: Stations across the crosssection have lower numbers on the left,set up looking downstream. Each stationposition has a corresponding elevation.Suggestion: Use 0 for the center of thechannel, negative numbers for the leftside and positive numbers for the rightside looking downstream. Road deck at 588.20If all of the cross-sections have the sameor similar dimensions, it is quick to startwith one cross-section and copy it andadjust it for the others.# Figure out the stream slope, fromfield measurements or from a USGS quadmap. (rise/run)
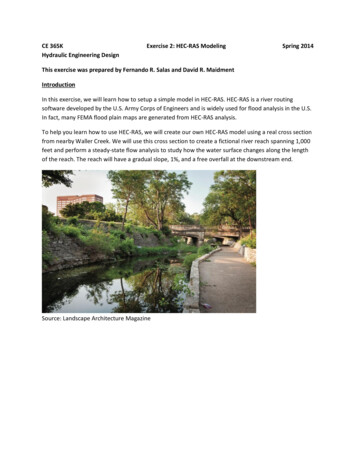
4. Enter Cross-Section Data Click on the cross-section button.Click the Options button. Choose“Add a new cross-section.” Enter thenumber of the cross-section you wantto add. You may want to start with theone that has the elevations given. Here, the “station” is the position alongthe stream.
4. Enter Cross-Section Data Add thestation/elevation (x/y)profile of the crosssection in the Crosssection XY Coordinatestable. Here, “station” meansthe position across thechannel.
4. Enter Cross-Section Data Downstream reach lengths—distance from this crosssection to the next crosssection downstream. If thechannel is straight, the threenumbers will be the same.Outside and inside curvelengths create the meanders. Put in Manning’s n value.Use standard n values foundon many charts. Enter the channel bankslocations (stations). Contraction and Expansioncoefficients: use 0.1 and 0.3,respectively, except justupstream and downstream ofthe structure where 0.3 and0.5 are used. When done, click on the“apply data” button.
4. Enter Cross-Section Data Add additional cross-sections. InOptions, either COPY the currentcross-section to another location(easy) or ADD a new cross-section toanother location.Copy: Copy the current crosssection to a new location then adjustthe elevations to the slope. Calculatethe change in cross-sectionelevations, ex 30 to new location Xslope of .004 is -.12’. Go to options,adjust elevations, enter elevationchange. The entire cross-section willbe adjusted down (-) or up ( ).Repeat until all cross-sections areadded.Add: Start from scratch each time.Modified copied cross-section:Copy and then adjust if much of thecross-section is similar. Another timesaver.
4. Enter Cross-Section Data Enter all cross-sections, close viewby clicking on the x in the top rightcorner. This is a good time to save theGeometry Data. It is suggested thatyou name it “existing” or “proposed.”
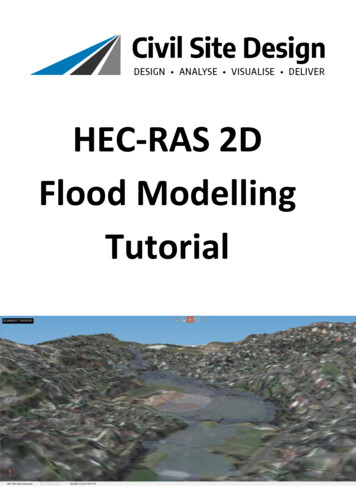
5. Add Road Deck Data In the main Geometric Datawindow, click on the Bridg/Culvbutton. Under Options, choose“Add a bridge or culvert”. Enterstation number (suggest 0). Inthe Bridge/culvert Data window,click on Deck/Roadway.
5. Add Road Deck Data In the top middle box, enter width ofthe road deck. In the left box, enter the distance fromthe downstream edge of the deck tothe next downstream cross-section. The weir coefficient can remain at 2.6. In the station and high chord columnsof the table, add cross-sectionstations and deck elevations (highchord). Stations must correspondwith channel stations, i.e, 0 at center.Deck cross-section should be as wideas channel cross-sections. Put in asmany points as it takes to describethe deck. Copy up to down, selectOK. Look at picture.
6-culvert. Add a Culvert In the Bridge/Culvert Data menu, clickon the Culvert button. Then Click Add Button. The top right drop-down box will letyou put in more than one culvert. Forthe first culvert, leave as is. Shape:choose the type of culvert from thedrop down box. Fill in the span anddiameter in feet as appropriate forculvert. Distance to upstream XS: fill in thedistance from the end of the culvert tothe next cross-section upstream.
6-Culvert. Add a Culvert Fill in the remaining boxes in the list. Usedrop down boxes if values for coefficientsand n are needed. Centerline: Should be 0 if culvert iscentered, otherwise adjust for distanceoff-center. (Setting up cross-section with0 at center makes this part easier.)
6-Bridge. Add a bridge Use the deck/roadway button to add the bridge information. The highchord defines the deck and the low chord defines the waterway opening(or underneath part of bridge). Add the underneath points of the bridge inthe low chord column. Additional rows may need to be inserted to definethe bottom of the bridge.
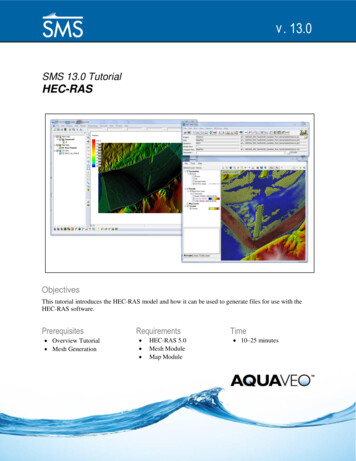
7. Ineffective Flow Areas If the floodplain width coming into thestructure is much wider than the opening,ineffective flow areas should be entered.These are the areas outside the main flow,where water is slow or stagnant. Upstream, position the ineffective flowstations in the cross-sections in a 1:1manner, i.e., for each foot distance from thecross-section to the structure, go one footover from the edge of the structure. Downstream, same as above but use 2:1positioning, i.e., 2 feet out and 1 foot over. Do the same for all cross-sections withineffective flow until the with of the floodplainis reached. Add cross-sections if needed to define theineffective flow areas.
7. Ineffective Flow Areas In the cross-section data window, goto the cross-section that requiresineffective flow. Choose Options,then ineffective flow areas. Addstations from the sketch. Elevation: Usually, this is set as thelow point of the road deck.
Summary ofGeometric Data Input River channel has been defined Structure placed in the river channel Losses and structural constraints are added,including ineffective flow areas and contraction andexpansion, and other losses have been entered.Next, enter the flow information .
8. Steady Flow Data In main menu, go to Edit, then choose Steady Flow Data. Enter the number ofprofiles, for example, to run both a 10-year and a 100-year flow, choose 2. Forjust a 100-year flow, enter 1. IN PF boxes, enter stream flows in cfs.
8. Steady Flow Data Reach boundary conditions: the two most common options to use arenormal depth and known water surface. Normal depth: Click Normal Depth button, enter stream slope. Known water surface, such as downstream lake, dam impoundment,or other water body: Click on Known WS button and enterdownstream water elevation.
9. Run Model, View Output In main menu, click on Run, then choose Steady Flow Analysis. In theSteady Flow Analysis menu, choose File, New Plan. Enter the title,such as “existing”, then enter the short title which can be the same.Click on Compute. Flow 01 will be chosen automatically. Under file,save plan. Address any errors that show up until plan runs.
9. Run Model, View Output Look at the output table by going to the main menu, choose View, thenProfile Summary Table. To change what is displayed on the table, choose Options, then eitherPlans or Profiles and select the items you would like to show up on thetable.
10. Add Proposed Structure Use the cross-sections from the“existing” geometry file to make anew file. Choose Save GeometryData As. Name the new file“proposed.” (Be sure to save theexisting file before you do this.) Working in the newly created file,take out unnecessary structures, addnew cross-sections where needed,i.e. if new structure is longer. SaveGeometry data. Run the model for the proposedstructure as was done for the existingstructure, this time saving as“proposed.” Look at the table, select all thenecessary plans and profiles, andcompare the water surface elevationsand energy grade lines of the existingand proposed projects.
Questions?
Using HEC-RAS 10 Steps for a Basic HEC-RAS Analysis. HEC-RAS: 10 Steps 1. Start a New HEC-RAS Project 2. Set Up the River Reach 3. Plan Cross-Sections 4. Enter Cross-Section Data 5. Add the Road Deck 6-culvert. Add the Culvert Data 6-bridge. Add the Bridge Data 7. Add Ineffective Flow Areas 8. Input Steady Flow Data 9. Run Model, View Output 10. Add Proposed Structure. HEC-RAS: 10 Steps These .