Transcription
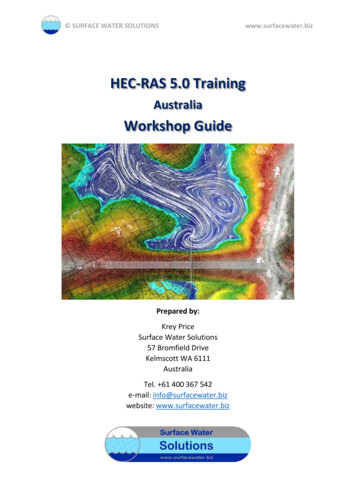
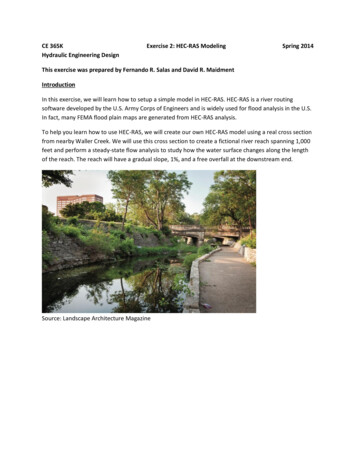
CE 365KHydraulic Engineering DesignExercise 2: HEC-RAS ModelingSpring 2014This exercise was prepared by Fernando R. Salas and David R. MaidmentIntroductionIn this exercise, we will learn how to setup a simple model in HEC-RAS. HEC-RAS is a river routingsoftware developed by the U.S. Army Corps of Engineers and is widely used for flood analysis in the U.S.In fact, many FEMA flood plain maps are generated from HEC-RAS analysis.To help you learn how to use HEC-RAS, we will create our own HEC-RAS model using a real cross sectionfrom nearby Waller Creek. We will use this cross section to create a fictional river reach spanning 1,000feet and perform a steady-state flow analysis to study how the water surface changes along the lengthof the reach. The reach will have a gradual slope, 1%, and a free overfall at the downstream end.Source: Landscape Architecture Magazine
Download InstructionsYou can use HEC-RAS on the LRC computers, or you can download the software by navigating to thewebsite below and clicking on “Downloads” on the left hand side of the ras/Note: You will need to use a PC with Windows XP, Vista or 7 (both 32-bit and 64-bit).Download the HEC-RAS 4.1 Setup Package and install it on your personal computer. Follow the setupinstructions and click through the default configurations.If you would like to see the complete HEC-RAS user manual and reference guide, go to the tware/hec-ras/documentation.aspxRunning HEC-RASDouble click on the HEC-RAS icon to open the program. You will see a window like the one below withmany buttons laid out across the top. These buttons help you navigate to the corresponding windowsthat display and describe your model.The first step in building a HEC-RAS model is to create a new project that stores and organizes all of therelated HEC-RAS files for your particular model and model run. To create a new project, go to File -
New Project. Navigate to the folder that you want to store your new project in, give the project a namesuch as WallerCreekXS and then save it by clicking on OK.Note: you will want to store all of your HEC-RAS files in the same folder.Once you create a new project, you will see the Project name and path on the main HEC-RAS window.The project by default will be set to US Customary Units but you can change this by going to Options - Unit System. The other files listed on the main HEC-RAS window will be populated as you go through thisexercise. A typical HEC-RAS model needs a project, plan, geometry, and steady or unsteady flow file torun.Next, go click on the Edit/Enter geometric data button,, to open the geometric data editorwindow. We will now create a fictional river reach which will provide the basis of our analysis.To create a river reach:(1)(2)(3)(4)(5)Click on the River Reach button,.Click once at the top left of the white space; you will see a line drawn as you move your cursor.Double click once at the bottom right of the white space.In the window that pops up, name the River, Waller Creek, and the Reach, Main.Click OK.Your window should look like figure below.
Now we will create a cross section using data from an existing Waller Creek cross section. The crosssection data can be found in the attached Excel worksheet; it is named WallerCreekXS.xls. Open theExcel sheet to see the cross section data. The Station field contains the x-coordinate data and theElevation field contains the y-coordinate data; the elevation data represents the elevation above meansea level in feet. If you would like a quick preview of the cross section, feel free to graph it using theExcel graphing tools.Note: The Station data describes the relative position of the cross section, in feet, to the other crosssections contained in the HEC-RAS model. In this example, you don’t need to worry about the stationvalues for this particular cross-section.
In the Geometric Data editor window, click on the Cross Section button,. This button will bringup the Cross Section Data editor window. This window allows you to input the x and y coordinates of across section along with its physical properties such as its’ downstream length to the next downstreamcross section, Manning’s N value, and bank station position. The bank station position tells HEC-RASwhere the flood plain of the cross section begins on both sides of the cross section.To create a new cross section:(1) Go to Options - Add a new Cross Section (2) Enter the station of the new cross section. In this case we will input 0 to indicate the mostdownstream cross section; the 0 indicates the number of feet upstream of the mostdownstream cross section.(3) Next, go to the Excel sheet and highlight the cross section data without highlighting the first row(e.g. A2:A212 and B2:B12).(4) Copy the selected Excel data and return to the Cross Section Data editor window. In thiswindow, highlight row 1 through row 211 for both the Station and Elevation columns. Oncehighlighted, go to Edit - Paste.(5) Enter 0.05 for the Manning’s N values (i.e. LOB, Channel, ROB); HEC-RAS lets you specify theManning’s N value for the main channel, left of bank and right of bank portion of the crosssection. The 0.05 Manning’s N value is typical for a section of river with cobbles and largeboulders.(6) Input 4954.89 for the Left Bank station and 5056.93 for the Right Bank station.(7) Input 0.1 for the Contraction and 0.3 for the Expansion. These coefficients are used to capturethe effects of bridges on flow modeling. In this example, we can ignore these coefficients.(8) Give the cross section a Description (e.g. Downstream).(9) Click on Apply Data to finalize the cross section.Note: For this example we are using existing data to define our cross section however if you wanted tosetup your own HEC-RAS model, you could use your own data.
Now that we have created the downstream cross section for our reach, we will now create the mostupstream cross section by copying the cross section we just created.To copy a cross section:(1) Go to Options - Copy Current Cross Section (2) Give the cross section a River Station of 1000 indicating that the new cross section will be 1,000feet upstream of the first cross section we created.(3) Click OK.Now when you look at the cross-section Editor, you’ll see that the River Sta is set at 1000
(4) Change the Description to Upstream.(5) Enter 1000 for the LOB, Channel and ROB Downstream Reach Lengths. If this cross section waslocated along a curve, you could change the corresponding reach lengths on each side of thechannel.(6) In the Cross Section Data editor window, go to Options - Adjust Elevations (7) Enter 10 in the window that pops up to adjust all the elevation points for the new cross sectionby 10 feet; this represents a 1% slope between the two cross sections.(8) Click OK.(9) Click on Apply Data to finalize the upstream cross section.
You can now Exit the Cross Section Data editor window. By doing so, you will be taken back to theGeometric Data editor window where you will see the plan view of the river reach we created with theupstream and downstream cross sections.Now would be a good time to save the geometry we just created. Go to File - Save Geometry Data.Give the file a title such as WallerCreekXS and make sure the file is being saved in the same folder as
your project file. Click OK. If you go to the main HEC-RAS window, you will now see the name of thegeometry file along with the path to the file.In order to study the flow along this river reach, we will create several cross sections in between theupstream and downstream cross sections by interpolating between these points.To create cross sections by interpolating:(1) Open the Geometric Data editor window.(2) Go to Tools - XS Interpolation - Between 2 XS’s (3) Enter 10 beside the Maximum Distance (ft) box.(4) Click on Interpolate New XS’s.
(5) Click Close.(6) Go to File - Save Geometry Data.
When you are finished saving your geometry, you can close the Geometric Data editor window to returnto the main HEC-RAS window. We will now define the flow conditions for the HEC-RAS model. AlthoughHEC-RAS allows us to perform both steady and unsteady analyses, for this example we will perform asteady state analysis. At minimum, to run HEC-RAS, you need to define a boundary condition at theupstream cross section and downstream cross section.To Define Steady Flow Conditions:(1) On the main HEC-RAS window, click on the Edit/Enter steady flow data button,.(2) Enter 2000 in the PF1 column to indicate a flow of 2,000 cfs at the upstream cross section.(3) Click on the Reach Boundary Conditions button.(4) Highlight the empty box in the Downstream column and click on the Critical Depth button. Thiswill essentially create a free overfall at the downstream cross section.
(5)(6)(7)(8)Click OK.In the Steady Flow Data editor window, click on Apply Data.Save the flow data by going to File - Save Flow Data.Give the flow data a title such as WallerCreekXS and click OK. Make sure the flow data file issaved in the same folder as your other HEC-RAS files.After saving the flow data, you will see the name of the flow data file and its path in the main HEC-RASwindow.The last thing you will need to define is the plan file. The plan file in HEC-RAS is used to define a modelrun and tells HEC-RAS which geometry file and flow data file to use for that particular model run.To perform a model run in HEC-RAS:(1) In the main HEC-RAS window go to Run - Steady Flow Analysis.(2) Make sure the correct geometry and steady flow file are populated in the window and then goto File - Save Plan.(3) Give the plan a title such as WallerCreekXSRun and click OK. Again, make sure the plan file issaved in the same folder as your other HEC-RAS files. You will need to enter a Short ID for themodel run such as WCXSRun.(4) After saving the plan data, make sure subcritical is selected for the Flow Regime and then clickCompute.(5) If you the model ran successfully you will see a window similar to the one below. Click Close.
(6) Go to File - Exit to close the Steady Flow Analysis editor window. Congrats!!In the main HEC-RAS window you will see all of the files that correspond to your successful model run.We will now visualize the results of your steady state analysis.To view the profile of the reach:(1) Click on the View profiles button,.(2) Study the Profile Plot. What do you notice? The x-axis shows the distance upstream from themost downstream cross section while the y-axis shows the elevation. The legend shows theEnergy Grade line, EG, the Water Surface line, WS, and Critical Depth line, Crit.(3) Close the Profile Plot window.
To view the cross sections along the reach:(1) Click on the View cross sections button,.(2) In the Cross Section window you can cycle through all the cross sections in the model by clickingon the arrows next to River Sta. at the top of the window.(3) If you start at station 0 and move upstream, do you notice the water surface changing? Like theProfile Plot, you will see the EG, WS and Crit lines plotted.
(4) Close the Cross Section window.Finally, we can look at some standard plots created by HEC-RAS to gain a further understanding of theanalysis.
To view General Profile Plots:(1) In the main HEC-RAS window, click on the View General Profile Plot button,.(2) The General Profile Plot window will open and you will see a graph of the channel velocity as afunction of upstream distance. Does this help you understand the results of the simulation?(3) You can look at some other standard plots by going to Standard Plots -
Open the Cross-Section TableAt the Upstream end, Cross-Section 1000 shown above are the results for various hydraulicparameters of the flow. At the upper end of the channel, the flow is uniform (E.G. Slope 0.01which is equal to the bed slope of 0.01) and Manning’s equation applies. The water depth (MaxChl Depth) 5.19 ft W.S. Elev (443.98) – Min Ch El (438.79). The velocity of the flow is 7.78ft/s. The top width, T 59.78ft, the area of the flow is A 260.32 sq ft, and the wettedperimeter P 62.63 ft. Note that the “Hydraulic Depth” is equal to the A/T and is not the sameas the hydraulic radius.At the downstream end, Cross-Section 0, shown below, the flow is critical (W.S. Elev CritW.S.), the water depth is 4.00 ft and the velocity is 10.45 ft/s. The depth is lower than normaldepth and velocity is greater because the flow is going over a free overall at the end of thechannel.
Save your HEC-RAS file before closing the program.To be turned in:(1) A screen capture of the longitudinal profile of the water depth in the channel.(2) Screen captures of the Cross-sections at the upstream and downstream ends of thechannel. Document the velocity, depth and top width of the flow at these two crosssections.(3) Use the data provided by the HEC-RAS program to verify uniform flow conditions at theupstream end of the channel and critical flow conditions at the downstream end of thechannel.
HEC-RAS allows us to perform both steady and unsteady analyses, for this example we will perform a steady state analysis. At minimum, to run HEC-RAS, you need to define a boundary condition at the upstream cross section and downstream cross section. To Define Steady Flow Conditions: (1) On the main HEC-RAS window, click on the Edit/Enter steady flow data button, . (2) Enter 2000 in the PF1 .


