Transcription
M I S S O U R IR E S E A R C H&E D U C A T I O NN E T W O R KUsing Microsoft Excel toEnhance Teaching andLearningP a r t i c i pa ntExcel XPeMINTSenhancing Missouri’s Instructional1 Networked Teaching Strategies
M I S S O U R IR E S E A R C H&E D U C A T I O NN E T W O R KEnhancing Missouri’s Instructional Networked Teaching StrategiesUsing Microsoft Excel to EnhanceTeaching and LearningMOREnetMissouri Research & Education Network3212 LeMone Industrial BoulevardColumbia, Missouri 65201Voice: (573) 884-7200Fax: (573) 884-6673http://emints.more.netCover Photos:Brian KratzerContributors:Janice FriesenJennifer KuehnleJulie SzajWritten: October 2001Revised: September 2003 2001 Missouri Department of Elementary and Secondary Education (DESE),Missouri Research and Education Network (MOREnet) and The Curators of the University of Missouri.Materials may be duplicated or reproduced in hard-copy format for use by educators and educationalinstitutions. The copies may be used for noncommercial purposes only.Titles or names of specific software discussed or described in this document are registered trademarks,trademarked or copyrighted as property of the companies that produce the software.Please note that the World Wide Web is volatile and constantly changing. The URLs provided in thefollowing references were accurate as of the date of this report, but we can make no guarantees for theirpermanence.2
M I S S O U R IR E S E A R C H&E D U C A T I O NN E T W O R KTable of ContentsPurpose of the Module .4Module Objectives.4What is a Spreadsheet? .5Workbooks and Worksheets .6Cells .6Formatting Cells .7Graphing .7Using Formulas.10Printing .12Spreadsheets in the Classroom .12Classroom Activities .13Practice .16Advanced Tips and TricksUsing Raw Data .16Putting a Title on the Spreadsheet.17Changing the Width of More Than One Column at a Time.17Changing the Format of Numbers .18Extending the M&M Lesson .18Inserting a Spreadsheet or Chart into Another Application .19Putting Spreadsheets on the Web.20Using the in a Formula .21Formula Shortcuts .21Resources.223
M I S S O U R IR E S E A R C H&E D U C A T I O NN E T W O R KPurpose of the ModuleThe purpose of this module is to give teachers experience using Microsoft Excel. Afterlearning the basic skills involved, teachers can find ways to make this program avaluable resource for students as they collect, record, represent and analyze datafrom any source. This module includes example spreadsheets from classroomteachers.Module Objectives Learners will create a simple spreadsheet to analyze data. Learners will make charts and diagrams to represent mathematical data. Learners will use simple formulas in a spreadsheet. Learners will become aware of many uses for spreadsheets in an inquiry-basedclassroom. Learners will plan a way to use this program with their students in the nextmonth.4
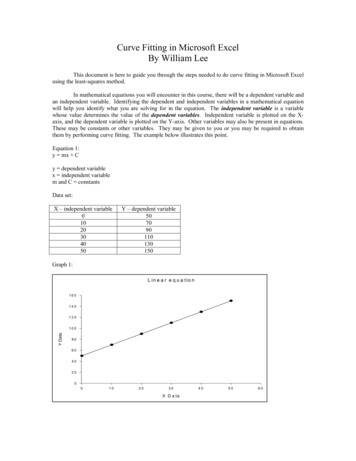
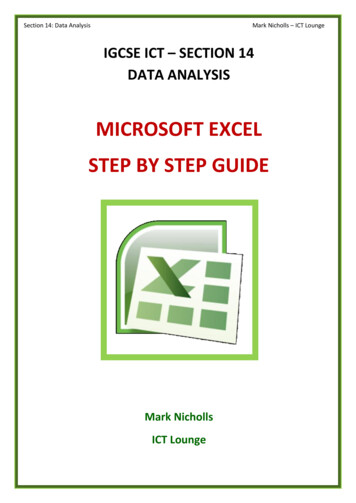
M I S S O U R IR E S E A R C H&E D U C A T I O NN E T W O R KWhat is a Spreadsheet?A computer user can collect, organize and analyze data in a spreadsheet program.Teachers can use it to record attendance and homework assignments and to calculategrades. Students can use the program to improve their research and analytical skillswhile they work on studies and reports.Excel opens with a grid of boxes where data can be entered.Task PaneThe task pane can be openedor closed. It gives shortcutsfor many tasks.Each space in the grid is a cell and each cell is designated by a letter and a number.The letter indicates the column location and the number indicates the row position.Excel has highlighted one cell in black and highlighted the letter above that cell andthe number to its left. These coordinates indicate that the name of that cell is (A, 1).5
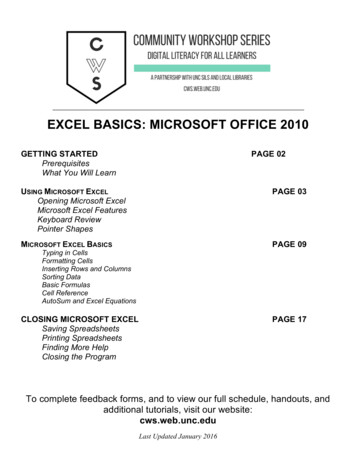
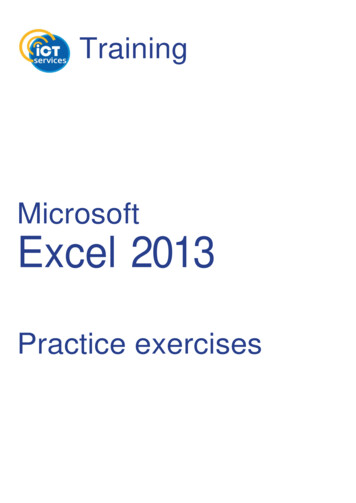
M I S S O U R IR E S E A R C H&E D U C A T I O NN E T W O R KExcel XP opens with a task pane on the right side of thescreen. This window has links to most basic Excel tasks.Select the triangle at the top right side of the task paneto reveal a list of several other tasks.The task pane gives users the option to select a specificspreadsheet already saved in a folder. To start a newdocument, users may choose from a listing of templates.To close the task pane and have a full screen showingjust the current grid page, click the X at the top righthand corner. To retrieve the task pane, go to the Viewbutton on the top toolbar. Select the Toolbars option andclick Task pane.Workbooks andWorksheetsOpen a new document in Excel to see several tabsfor Sheet 1, Sheet 2 and Sheet 3 at the bottom ofthe screen. Excel opens to a workbook that is likea grade book with different pages of grades. Aworkbook in Excel is one file. When a user entersor saves data anywhere in the workbook it allstays in the same file. However, one workbook canhave many sheets. Sheets can have differentinformation or they can be related to each other. For example, an average on Sheet 1can be inserted automatically into Sheet 3 so any change made on Sheet 1 will alsochange Sheet 3.CellsStudents opening a spreadsheet may be confused by cellnames. As previously explained, each cell is designated by anumber and a letter. Students can have fun learning how touse a grid by creating pictures using the coordinates of eachcell. Use a spreadsheet’s cells to draw a letter or recognizablepattern. Click in a cell and set the background color in theFormat menu (Format Cells Pattern). See the letter H inthe example at right.Have students open Excel or give them a blank paper copy of a spreadsheet. Call outa cell (C, 6—for example) and have the students color in the cell (or format thebackground) and play BINGO.Students can create pictures of their own and write out the coordinates of each cell tobe filled. By exchanging papers, students get the chance both to write the coordinatesand create a picture from coordinates.6
M I S S O U R IR E S E A R C H&E D U C A T I O NN E T W O R KFormatting CellsIn Excel, a user can change thefont, background color, size,alignment and text wrap in a cell.Choose Format Cells thenchoose a tab to make changes.Number–Allows contents of thecell to be written in percentages orcurrency. Provides the option ofusing decimal points.Alignment–Sets the angle of thetext in the cell. Sets thespreadsheet to wrap the text,shrink the text to fit or mergeseveral cells. (Highlight cellsbefore opening this window tomerge them).Font-Sets the font size, style and color.Patterns–Changes the background color of highlighted cells. Shading headings orparts of a chart often makes it more readable.GraphingTo really get a handle on using Excel, make an information graph.To familiarize students with the Excel program, pass out packages of candy such asjellybeans or M&Ms and have students count, record and graph their candies by color.1. Instruct students to enter the names of the colors in column A (see example).7
M I S S O U R IR E S E A R C H&E D U C A T I O NN E T W O R K2. Have them count and enter the number of each color in column B.3. Highlight the desired information. In this example, do not highlight the title (A1H1). For instructions on how to insert a title, see Advanced Tips and Tricks.4. Click on the Graph icon in the Formatting toolbar.5. Let the Chart Wizard direct the four steps for making a graph.6. Browse the types of graphs for viewing the spreadsheet. Learning the functions ofall the graphs can be challenging. The most commonly used are the bar andcolumn graphs and the pie chart.7. View the spreadsheet as a bargraph.8. Click Next and the programwill ask if the series is inrows or columns. Try both todecide which is best for theinformation presented. Forthis project it probablymakes more sense to chooserows.8
M I S S O U R IR E S E A R C H&E D U C A T I O NN E T W O R K9. Choose how thegraph will look.10.At the Titles tab,type in a title for thechart and names foreach axis.11.Click on Axes tochoose not to namethe axes.12.Click the Gridlinestab to determine howmany lines appear inthe final graph. Havestudents practicereading graphs withand without gridlines present.13.Click the Legend tab toadd and place a legend.14.Use Data Labels to namethe columns or lines in thegraph.15.Use Data Table to showthe original data enteredon the spreadsheet alongwith the graph.16.Choose whether toput the graph in thespreadsheet as anobject or to make ita separate sheet inthe workbook. Toprint the graph byitself, save it as aseparate sheet.17.Click Finish and thegraph will appear.18.Edit the graph bycell, worksheet orworkbook.9
M I S S O U R IR E S E A R C H&E D U C A T I O NN E T W O R K19.For example, change the colors of the bars to match the colors of the M&Ms:a. Click on the bar to be changed. A dot will appear on that bar.b. Choose either Format Data Series or the icon for it on the Chart Toolbar.The following box will appear.c. Click on the red box to turn the bar red. Click OK.d. Select the next bar and follow the same procedure until all the bars matchtheir color names.Note: When the numbers in the spreadsheet change, the linked graph changesautomatically.10
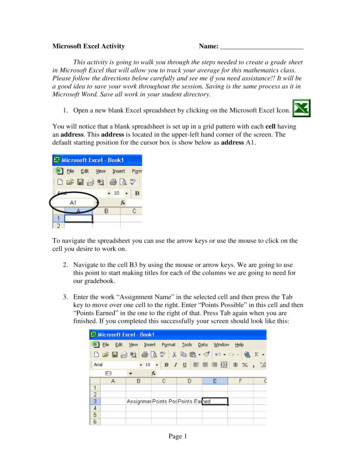
M I S S O U R IR E S E A R C H&E D U C A T I O NN E T W O R KUsing FormulasTeachers can use the features of Excel for more than data display. Enter a formularather than a number to have the spreadsheet do the work. Once a user has inserteda formula, changing the numbers will automatically change the totals where theformula was entered.To set up a formula to averagethe number of M&Ms in eachpackage:1. Click on the last cellunder the M&M count.2. Choose Insert Function from the toptoolbar. The box on theright will appear. Type adescription, Select acategory of functions toview or scroll throughthe list of functions.Select AVERAGE andclick OK.3. In the next window,enter the cellnumbers of the datato be averaged. Toput the numbers inautomatically,highlight the rowbefore inserting theformula. Notice thatthe numbers arealso listed after thebox as reassurance.4. Watch the average of the numbers appear in the box. When compiling largeamounts of data, note that new numbers can be added to the columns and theformula will adjust the average with each addition.11
M I S S O U R IR E S E A R C H&E D U C A T I O NN E T W O R KPrintingSpreadsheets do not print the way they look on the screen. Before printing, decide thefollowing: Which lines should show?To highlight the part of the spreadsheet to be printed, choose Format Cells Border. Different parts of the spreadsheet can have different types of borders.Shade rows or columns for emphasis. Go to Format AutoFormat to choose anew look. How many pages will it be when printed?As the number of rows and columns in a spreadsheet is unlimited, specifying thepart of the document to be printed is essential.1. Highlight the spreadsheet section to be printed.2. Choose File Print Area Set Print Area. A dotted line will mark the area toprint.3. If the print area is larger than the paper, look for the page size.4. If a spreadsheet will not fit printed as Portrait (8 ½” x 11”), switch toLandscape (11” x 8 ½”) at File Page Setup.5. If the sheet is still too big, use File Page Setup to change the print size.Change the percentage of normal size like on a copier. Blow up a spreadsheetto fill a whole page or shrink it so more will fit on one page.Spreadsheets in the ClassroomSpreadsheets are important in the classroom for the following reasons:1. Students need to learn to read charts and graphs.2. Students learn in different ways. A graphic representation may be the best wayfor some students to manipulate mathematical concepts or data.3. Used as grade books or for keeping track of field trip money or book orders,spreadsheets can ease a teacher’s workload.4. Unlike a drawn chart, a user can change a computer spreadsheet after theinitial data is entered. Students can change variables and experiment with howgraphs change in response.5. Creating different graphs and charts from the same spreadsheet lets studentscompare different representations and better understand the meaning ofvarious graphs and charts. These tasks would take too much time and effort tobe valuable if the students had to draw them by hand.6. Teachers can use spreadsheets for more than math. The next section of thismodule describes many other uses.7. Teachers can use Excel to discuss statistics and probability.8. Students can use Excel to explore the meaning of decimal numbers and theconnections among decimals, fractions and who
Excel opens with a grid of boxes where data can be entered. Each space in the grid is a cell and each cell is designated by a letter and a number. The letter indicates the column location and the number indicates the row position. Excel has highlighted one cell in black and highlighted the letter above that cell and the number to its left.