Transcription
Ross McKitrick“What is the Hockey Stick Debate About?APEC Study Group, AustraliaApril 4, 2003What is the ‘Hockey Stick’ Debate About?Ross McKitrick*Department of EconomicsUniversity of GuelphApril 4 2005AbstractThe hockey stick debate is about two things. At a technical level it concerns a wellknown study that characterized the state of the Earth’s climate over the past thousandyears and seemed to prove a recent and unprecedented global warming. I will explainhow the study got the results it did, examine some key flaws in the methodology andexplain why the conclusions are unsupported by the data. At the political level theemerging debate is about whether the enormous international trust that has been placed inthe IPCC was betrayed. The hockey stick story reveals that the IPCC allowed a deeplyflawed study to dominate the Third Assessment Report, which suggests the possibility ofbias in the Report-writing process. In view of the massive global influence of IPCCReports, there is an urgent need to bias-proof future assessments in order to put climatepolicy onto a new foundation that will better serve the public interest.1IntroductionThe hockey stick graph appears to show that the Earth’s climate was very stable from AD1000 to 1900,then suddenly began to change, with temperatures in the Northern Hemisphere rising dramatically. It wascentral to the 2001 Third Assessment Report (TAR) from the Intergovernmental Panel on Climate Change(IPCC). It appears as Figure 1b in the Working Group 1 Summary for Policymakers, Figure 5 in theTechnical Summary, twice in Chapter 2 (Figures 2-20 and 2-21) of the main report, and Figures 2-3 and9-1B in the Synthesis Report. Referring to this figure, the IPCC Summary for Policymakers (p. 3) claimed*Invited Special Presentation to the Conference “Managing Climate Change—Practicalities and Realitiesin a Post-Kyoto Future,” Parliament House, Canberra Australia. My thanks to: the hosts, The AustraliaAsia Pacific Economic Cooperation (APEC) Study Centre at Monash University, and Alan Oxley for theinvitation to make this presentation.1
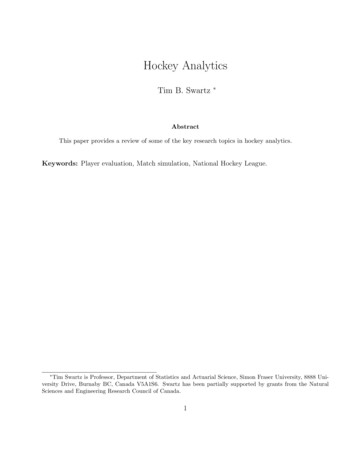
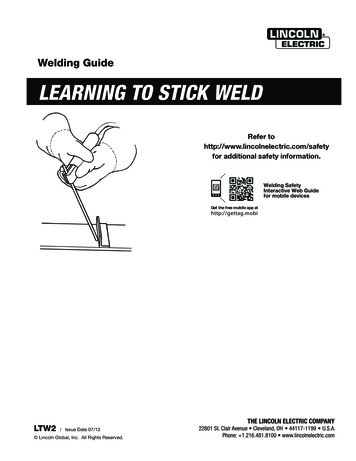
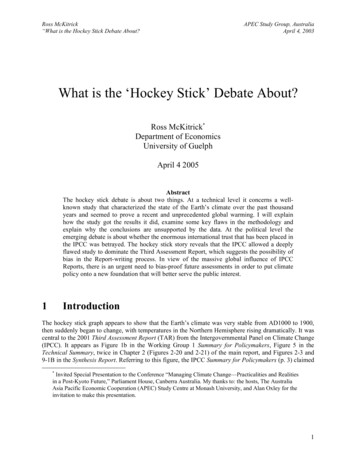
Ross McKitrick“What is the Hockey Stick Debate About?APEC Study Group, AustraliaApril 4, 2003it is likely “that the 1990s has been the warmest decade and 1998 the warmest year of the millennium” forthe Northern Hemisphere.In appreciating the promotional aspect of this graph, observe not only the number of times it appears, butits size and colourful prominence every time it is shown. This can best be seen by comparing itspresentation with that of another equally-important climate data series, the global average of tropospherictemperatures as developed by Christie and Spencer using weather satellites.1 The two data series havebeen of central importance in debates over climate science in recent years and both convey informationwith potentially pivotal implications. Yet the graph of satellite-measured tropospheric data was omittedaltogether from the Summary for Policymakers. It does appear in the Technical Summary, but only in arelatively small panel (TS Figure 4a) in black-and-white, overlaid with surface data and weather balloondata in such a way that it is hard to see where the MSU series actually starts. And it is immediatelyfollowed by a full-colour hockey stick occupying over half the next (facing) page. On the following pageI reproduce the page sequence from the IPCC Technical Summary. The contrast is obvious. Like amagician misdirecting the audience’s attention, the IPCC drew attention towards the hockey stick. Theymay argue in hindsight that they had good reason for this strategic emphasis, but they cannot deny thatthere was deliberate editorial sleight-of-hand, and readers may in hindsight feel a justifiable sense ofhaving been tricked.The implicit message concerning the importance of the hockey stick evidence was not lost on the IPCCclientele, as evidenced by its heavy subsequently promotion. When the TAR was released in January2001, Canada’s Chief Climate Science Advisor, Henry Hengeveld, gave his reaction in an interview foran article in the Toronto Globe and Mail (emphasis added).2“This gives a fairly clear signal that this isn't just a future issue, it's happening now,” Mr.Hengeveld said. Among the strongest evidence is the fact that the past century has likelybeen the warmest in the Northern Hemisphere in the past millennium, he said. Not onlythat, the 1990s ranked as the warmest decade of the millennium, and 1998 was thewarmest year of the millennium in the Northern Hemisphere, which is where most of theirdata have been acquired.The Government of Canada subsequently sent the hockey stick (but not the satellite data) to schoolsacross the country, and its famous conclusion about the 1990s being the warmest decade of themillennium was the opening line of a pamphlet sent to every household in Canada to promote the KyotoProtocol. A Google search, or simply a browse to a randomly-chosen government environment ministryweb site, will reveal it to be ubiquitous and primary whenever evidence is adduced for global warming orfor plumping up support for Kyoto.12See na Mitchell, “Scientists raise alarm of climate catastrophe.” Globe and Mail January 22, 2001.2
Ross McKitrick“What is the Hockey Stick Debate About?APEC Study Group, AustraliaApril 4, 2003Figure 1: Extract of IPCC Technical Summary pages 28-29. Note the relative visual roles of the MSUtropospheric data and the Hockey Stick.In the aftermath of the hockey stick’s demolition, some scientists connected to the IPCC have tried toinsist that it actually didn’t matter that much to their case. Any such attempt to downplay the influence ofthe graph flies in the face of the print record. Without it the TAR would have looked been a very differentdocument, it would not have been able to conclude what it did, nor could the IPCC have convinced worldleaders to take the actions they subsequently took.In light of its singular role, and in light of the enormous trust placed by governments around the world inthe IPCC, we should expect they took some pains to ensure the graph’s validity. IPCC leaders haveboasted at length about their rigorous multi-stage review process,3 they have urged world leaders to placethe greatest trust in their Report, and they have summarily dismissed criticism on the grounds that theirAssessment contains the “consensus” view of all qualified climate scientists around the world.We must evaluate the rigour of the IPCC quality control process, not by the elaborateness of the statedprocedures, but by the contents of its Reports. As I will show, the hockey stick paper was deeply flawed3See, for instance, “Consensus Science or Consensus Politics?” Nature 412 12 July 2001 112—114.3
Ross McKitrick“What is the Hockey Stick Debate About?APEC Study Group, AustraliaApril 4, 2003and it contradicted other credible evidence then appearing in the scientific literature. The flaws could havebeen discovered during the review process under even the most elementary fact-checking. Yet the reviewprocess not only allowed this paper through, but made it front-and-centre in the final Report. The questionthen is not whether the IPCC review process is flawed: we can no longer conclude otherwise. Thequestion is how to bias-proof future Reports in order to put policy onto a new foundation that will betterserve the public interest.The hockey stick debate is thus about two things. At a technical level it is about flaws in methodologyand erroneous results in a scientific paper. But at the political level the debate is about whether the IPCCbetrayed the trust of governments around the world. If the hockey stick incident was truly inadvertent, wecan expect the IPCC would, in good faith, be fully supportive of new mechanisms to bias-proof its futurereporting-writing process.2The Lead-up to the Mann Hockey StickScientists try to discern local climate histories over past centuries using various techniques, includingtemperature proxies and ground borehole temperature data. “Proxies” include a wide range of measuresthat are, potentially, sensitive to local temperature trends, such as tree ring widths. Boreholes drilled intothe ground have a vertical temperature profile that can be inverted to yield an estimate of the historicalsurface temperature sequence at the surface.In the mid-1990s the use of ground boreholes as a clue to paleoclimate history was becoming wellestablished. In 1995 David Deming, a geoscientist at the University of Oklahoma, published a study inScience4 that demonstrated the technique by generating a 150-year climate history for North America.Here, in his own words, is what happened next.With the publication of the article in Science, I gained significant credibility in thecommunity of scientists working on climate change. They thought I was one of them,someone who would pervert science in the service of social and political causes. So oneof them let his guard down. A major person working in the area of climate change andglobal warming sent me an astonishing email that said “We have to get rid of theMedieval Warm Period.”5The Medieval Warm Period (MWP) is an interval from approximately AD1000 to AD1300 during whichmany places around the world exhibited conditions that seem warm compared to today. In the 19954Deming, D. (1995). “Climatic Warming in North America: Analysis of Borehole Temperatures.” Science 268,1576-1577.5David Deming (2005) “Global Warming, the Politicization of Science, and Michael Crichton's State of Fear.”Forthcoming, Journal of Scientific Exploration, v.19, no.2.4
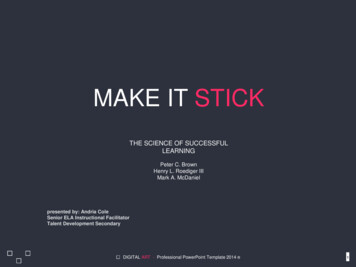
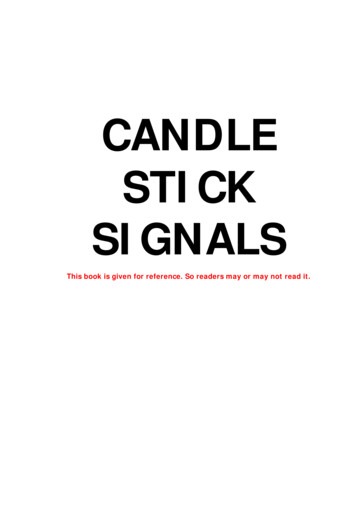
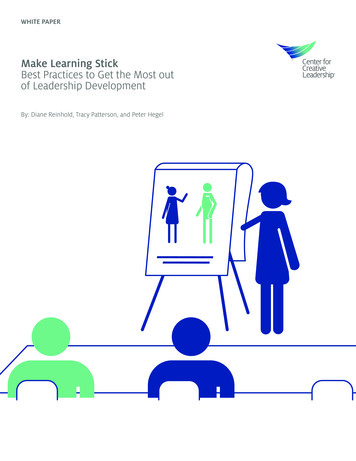
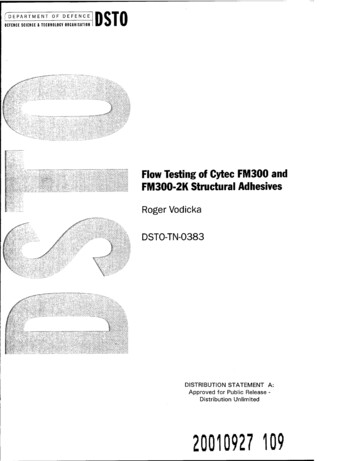
Ross McKitrick“What is the Hockey Stick Debate About?APEC Study Group, AustraliaApril 4, 2003Second Assessment Report of the IPCC, there was no hockey stick. Instead the millennial climate historycontained a MWP and a subsequent Little Ice Age, as shown as in Figure 3. The late 20th century appearsto be nothing special by comparison. It is easy to see why this graph was a problem for those pushing theglobal warming alarm. If the world could warm so much on such a short time scale as a result of naturalcauses, surely the 20th century climate change could simply be a natural effect as well. And the presentclimate change could hardly be considered unusually hazardous if even larger climate changes happenedin the recent past, and we are simply fluctuating in the middle of what nature regularly dishes out?Figure 3: World Climate History According to IPCC in 1995.Those wanting to “get rid of” the MWP run into the problem that it shows up strongly in the data. Shortlyafter Deming’s article appeared, a group led by Shaopeng Huang of the University of Michigancompleted a major analysis of over 6,000 borehole records from every continent around the world. Theirstudy went back 20,000 years. The portion covering the last millennium is shown in Figure 4. Thesimilarity to the IPCC’s 1995 graph is obvious. The world experienced a “warm” interval in the medievalera that dwarfs 20th century changes. The present-day climate appears to be simply a recovery from thecold years of the “Little Ice Age.”5
Ross McKitrick“What is the Hockey Stick Debate About?APEC Study Group, AustraliaApril 4, 001990-0.5-1Figure 4. World Climate History after AD1,000 according to ground borehole evidence.Vertical axis: average anomalies in oC, with range indicating Bayesian probability boundaries.Source: Huang et al. (1998); data supplied by Huang.Huang and coauthors published their findings in Geophysical Research Letters6 in 1997. The next year,Nature published the first Mann hockey stick paper, commonly called “MBH98.”7 Mann et al. followedup in 1999 with a paper in GRL (“MBH99”) extending their results from AD1400 back to AD1000.8 Inearly 2000 the IPCC released the first draft of the TAR. The hockey stick was the only paleoclimatereconstruction shown in the Summary, and was the only one in the whole report to be singled out forrepeated presentation. The borehole data received a brief mention in Chapter 2 but the Huang et al. graphwas not shown. A small graph of borehole data taken from another study and based on a smaller samplewas shown, but it only showed a post-1500 segment, which, conveniently, trended upwards.As soon as the IPCC Report came out, the hockey stick version of climate history became canonical.Suddenly it was the “consensus” view, and for the next few years it seemed that anyone publiclyquestioning the result was in for a ferocious reception.6Huang, Shaopeng, Henry N. Pollack and Po Yu Shen (1997). “Late Quaternary Temperature Changes Seen inWorldwide Continental Heat Flow Measurements.” Geophysical Research Letters 24: 1947—1950.7Mann, M.E., Bradley, R.S. and Hughes, M.K., 1998. Global-Scale Temperature Patterns and Climate ForcingOver the Past Six Centuries, Nature, 392, 779-787.8Mann, M.E., Bradley, R.S. and Hughes, M.K., Northern Hemisphere Temperatures During the Past Millennium:Inferences, Uncertainties, and Limitations, Geophysical Research Letters, 26, 759-762, 1999.6
Ross McKitrick“What is the Hockey Stick Debate About?33.1APEC Study Group, AustraliaApril 4, 2003The Making of the Mann Hockey StickThe multiproxy methodNow to the technical details. Mann et al. called their method a “multiproxy” technique, since it combineda variety of proxies. The most numerous, and influential, proxies in their data set are tree ringchronologies. The method required mapping a large sample of proxies to a large sample of temperatures,and it encountered the mathematical problem that there are more equations than there are unknowns. Sothe dimensions of the data matrices had to be reduced.Principal components analysis is a common tool for handling this. It involves replacing a group of serieswith a weighted average of those series, where the weights chosen so that the new vector (called theprincipal component or PC) explains as much of the variance of the origi
It does appear in the Technical Summary, but only in a relatively small panel (TS Figure 4a) in black-and-white, overlaid with surface data and weather balloon data in such a way that it is hard to see where the MSU series actually starts. And it is immediately followed by a full-colour hockey stick occupying over half the next (facing) page. On the following page