Transcription
Final reportThe Hockey StickA Survival Guide for Climate ConversationDYN-CLIMATE VAR AND CLIMATE CHG, Columbia University New YorkDaniela Domeisen, Joshua Gellers and Heather RavenDec 10th, 2006
11INTRODUCTION2IntroductionWhen the new report of the IPCC (Intergovernmental Panel on Climate Change) was published in 2001,it led to extensive debate among scientists and in politics. The IPCC report had put a lot of emphasison the hockey stick, a diagram shown within the report, specifically in the ’Summary for Policymakers’,where it was the cause for much discussion. From the last IPCC report and the news, the public stillbelieved that scientists were not too sure about climate change, but then the hockey stick was published.The hockey stick is a diagram representing global warming for the last thousand years. It got its namedue to its long, constant shape with a sudden upward slope in the end which looks similar to a hockeystick.2OverviewThe graph shows the diagram published in the IPCC report which caused a lot of discussion about globalwarming.Figure 1: The Hockey Stick Model as it was presented in the ’Summary for Policy Makers’ within theIPCC report 2001The diagram shows a significant increase in temperature for the last few decades, indicating that sinceindustrialization, global temperatures have been rising much faster than ever before. Therefore, it wasconcluded in the report that the warming had an anthropogenic influence which caused temperaturesaround the earth to rise and thereby impact humans as well as entire ecosystems. The hockey stickrepresents the average global temperature to many scientists who work on the IPCC reports.The task of the IPCC, which was founded in 1988, is the presentation of the actual state of sciencein the various fields of climate change, the estimation of the consequences of climate variation for environment and society, and the formulation of realistic mitigation strategies. The report is published everyfew years and the next report is set for publication in 2007.The consensus of the IPCC consists of the following main points:1) Global average temperature on the Earth’s surface has been rising by about 0.6 0.2 C until 2001,compared to the 30-year mean from 1961 to 1990, and by about 0.17 C per decade during the last30 years.2) Most of the warming during the past 50 years can be attributed to humans, especially the emissionof greenhouse gases such as CO2 and methane.
3AFFIRMATIVE VIEW (JOSH GELLERS)33) Depending on the future development of the emissions of greenhouse gases, Earth will be warmingby 1.4 C to 5.8 C by the end of the 21st century.The publication of the hockey stick curve led to major controversies among scientists as well as inpolitical arenas. Scientists who do not believe that climate change will be as dramatic as predicted bythe IPCC report published papers contradicting the report. Various opinions exist about how much theearth will warm and in what time. However, most scientists agree that there is a warming trend and thatit is due to anthropogenic influence, but since it is impossible to do an accurate prediction for the future,due to many unknown factors such as future emissions and political/policy change as well as positiveand negative feedbacks of climate change, there are large differences between the future projections forwarming. This disagreement has misleadingly been interpreted as a debate about whether climate changeis happening at all.3Affirmative view (Josh Gellers)The so-called ’hockey stick’ model developed by Mann et al (hereafter ’MBH98’) has been under firefor its methodology and statistical analysis ever since it was first published in Geophysical ResearchLetters. Due to the high visibility of the study thanks to its prominent inclusion in the United NationsIntergovernmental Panel on Climate Change Third Assessment Report in 2001, MBH98 has been subjectto an almost unprecedented amount of criticism, mostly by a few determined naysayers. However, thecondemnation brought onto the model itself is largely unwarranted and yet the scientific communityremains largely in accord with the findings of MBH98.First, the degree to which the hockey stick model is at the very least valid or at the most alarminghas been egregiously overstated. The title of the initial paper from which this controversy derives isquite telling; Northern Hemisphere Temperatures During the Past Millennium: Inferences, Uncertainties,and Limitations. This unabashedly modest headline speaks to the conviction with which the originalresearchers assert their results- not much. The authors even begin their seminal work with a significantadmonition; We focus not just on the reconstructions, but the uncertainties therein, and importantcaveats our results suggest that the latter 20th century is anomalous in the context of at least the pastmillennium (MBH98; emphasis added). Furthermore, doubts involving the quality of the paleoproxiesused have circulated unjustly. Only a careless observer who has not read the literature would castigate themodel for neglecting to address issues surrounding the validity of the proxies as MBH98 clearly states, amore widespread network of quality millennial proxy climate indicators will be required for more confidentinferences. Considering that the overarching extension of the hockey stick model was not initiated by itsdesigners, one cannot place blame the questionable accuracy of the model solely on MBH98 by virtue ofits unintended overuse.Second, despite its flaws the hockey stick model has earned the lukewarm endorsement of the U.S.National Academy of Sciences (About the NAS 2006). The NAS did not wholly adopt the model,however, contending that the hockey stick graph has been highly politicized, often extending the fledglingresearch well beyond its deserved territory. According to Gerald North, chair of the NAS committee, theorganization roughly agree[s] with the substance of [MBH98s] findings. North went on to state that thecommittee has a high level of confidence that the second half of the twentieth century was warmer thanany other period in the past four centuries (Brumfiel 2006).Quite simply, the brouhaha about the hockey stick model is mostly overblown and exaggerated. It hasnever been the intention of the authors to provide a fail-safe graphic depicting a definitive warming trend inthe Earths climate, despite the claims made by the models opponents. Ignorant of MBH98s unpretentioustitle, hockey stick contrarians have senselessly drawn and quartered Mann et al for their efforts. McIntyreand McKitrick, two of the most notorious hockey stick antagonists, have mounted quite a challenge tothe model, though their endeavor has been almost entirely misdirected as the authors have never attestedto the infallibility of their product. However, the attention given to them in the mainstream media hassuffocated more important hockey stick-related revelations, such as the models moderate acceptance bythe highly reputable National Academy of Sciences. To this day, Mann et al makes no attempt to disguisethe uncertainties inherent in the hockey stick model and maintains their conclusion that both the pastdecade and past year [1998] are likely the warmest for the Northern Hemisphere this millennium all while
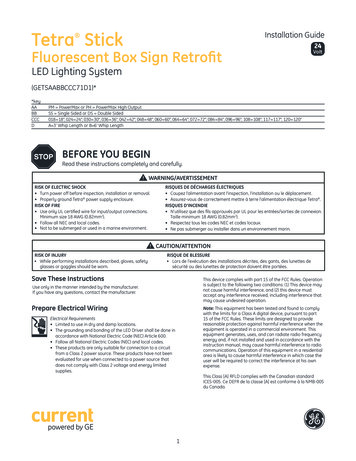
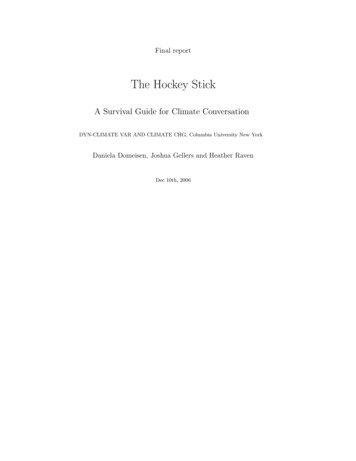
4HOCKEY STICK MODEL SKEPTICAL VIEW (HEATHER RAVEN)4working to continuously refine the methods of their research (MBH98; authors emphasis).4Hockey Stick Model Skeptical View (Heather Raven)Even though the ’hockey stick’ model developed by Mann et al. (1999) has been used and referencedby well-renowned organizations such as the Intergovernmental Panel on Climate Change (IPCC, ThirdAssessment Report, 2001) and the National Academy of Sciences (NAS), there are a few significant errorsin the production of the model and its use. The general public with little or no information on climatechange could look at this graph as an indisputable indication that the climate is warming rapidly andthat it has never happened before, at least not in the past thousand years, at this unprecedented rate.They also might point their fingers at anthropogenic causes for the warming, yet this is not what thegraph is telling us.The hockey stick model is simply showing us how much the Northern Hemisphere (NH) temperaturesdepart from the 1961-1990 AD average (i.e. temperature anomalies in the NH). It is important toremember that this graph and the resultant anomalies are deviations from only a 30-year record oftemperatures rather than a long-term record of what is ’average’ for the NH. The anomalies in thehockey stick from 1900 to 2000 AD seem to be experiencing an even greater positive deviation fromaverage which is not seen in an earlier time period in the graph; this positive deviation happens toroughly correspond to the time when instrumental records were available for use in this graph, the priortime periods reconstructed using proxy data.Proxy data is gathered from tree rings, corals, ice cores, and historical records (Mann et al., 1999).Difficulties arise when using proxy data since there are limits to each method: ice cores can only betaken from a small fraction of the global surface, corals may not be reliable for use on long timescalesdue to changing temperature and salinity of ocean waters, and large samples of trees from many sites areneeded to analyze tree rings for a change in climate (Jones and Mann, 2004). The use of proxy data from1900 to 1998 AD seems to correspond with the instrumental record, but the proxy data from any earliertimeframe contains a large amount of error, error that could put past temperature deviations possibly onpar with the anomalies experienced in the NH today. Prior to 1600 AD, the error can be seen to increaseeven further as proxy reconstructions become more uncertain. Mann even admitted that uncertaintiesprevent decisive conclusions for data collected prior to 1400 AD (Nature, Corr., 2006), hence the largeerror in the ’stick’ of the hockey stick graph.Uncertainties arise from the use of ’insufficient data and flawed statistical analysis’ (McKitrick andMcIntyre, as referenced in Nature, News) of the proxy data temperature and climate reconstructions.Wegman’s (statistician, Wegman Report) analysis concludes that Mann et al. (1999) cannot claim thatthe 1990’s were the hottest decade in the past millenium, given their methods of analysis (suppression oflow-frequency variation, excluding large regional warm events that could have affected overall anomalyresults) [Figure 2]. Wegman also points out that the results by Mann et al. (1999) are not whollyindependently verified since they were peer-reviewed within the paleoclimate community [a statisticianwould have been a good choice for reviewing the work by Mann et al. (1999)]. Indeed, Mann himselfconcedes that higher resolution data is needed before ’more confident conclusions can be reached’ abouttheir study’s results (Mann et al., 1999), ultimately decreasing the error in the past proxy reconstructionsand statistical methods.A skeptic’s point of view is easy to find in the literature, especially given the topic of the hockeystick model, a model peppered with political, scientific, and societal implications for the future; however,maintaining an objective view of the hockey stick, its benefits and flaws, will be valuable in all conversations related to climate change and specifically, regional/global warming. The hockey stick is not a’global’ model, nor is it quite representative of the Southern Hemisphere (SH) [Figure 3, model outputsof SH and Globe in form of ’hockey stick’] but it can be used as a tool for understanding how temperatureanomalies are changing in the NH. It has been redeveloped to include projections of future anomaliesin temperature [Figure 4] but these projections contain great amounts of error and predict a warmingsomewhere between 1 C to 5.7 C. The future of the hockey stick model, whether the positive anomalytrend will grow to unprecedented values, will be further contested as improved data is used for the modeland human impacts on climate are resolved.
4quite representative of the Southern Hemisphere (SH) [Figure 2, model outputs of SH andGlobe in form of ‘hockey stick’] but it can be used as a tool for understanding howtemperature anomalies are changing in the NH. It has been redeveloped to includeprojections of future anomalies in temperature [Figure 3] but these projections containgreat amounts of error and predict a warming somewhere between 1 ºC to 5.7 ºC. TheHOCKEY STICKMODELVIEWRAVEN)future ofthe hockeySKEPTICALstick model, whetherthe(HEATHERpositive anomalytrend will grow tounprecedented values, will be further contested as improved data is used for the modeland human impacts on climate are resolved.5Figure 1. In this figure from Jones and Mann, 2004, they show regional temperaturedata fromaboutto 2000.Notetheyhow showregionalchange variesgreatly fromtheFigure 2: In this anomalyfigure lydata fromNorthern Hemisphere average anomaly (instrumental data). Jones and Mann state thatabout 1660 to 2000. Note how regional change varies greatly from the Northern Hemisphere averagethere is “limited agreement between the NH and the European regions” and that the NHanomaly (instrumentaldata).Jonesfromanda singleMannregion.stateHowever,that thereis et’limitedagreementthe NHdata cannotbe inferredMannal. (2003a)[referencedbetweeninand the EuropeanJonesregions’and thatdata cannotbe inferredfroma singleregion.and Mann,2004]thethenNHtry “tentativeextensions”of the NHmeanusing datathat However, Mannthey acknowledgeprovidesa “highlyuncertain”of NH temperaturechange.et al. (2003a) [referencedin Jonesand Mann,2004]then estimatetry ’tentativeextensions’of the NH mean usingdata that they acknowledge provides a ’highly uncertain’ estimate of NH temperature change.Figure 2. Jones and Mann, 2004, show the average of temperature anomalies (proxy and
on the hockey stick, a diagram shown within the report, specifically in the ’Summary for Policymakers’, where it was the cause for much discussion. From the last IPCC report and the news, the public still believed that scientists were not too sure about climate change, but then the hockey stick was published. The hockey stick is a diagram representing global warming for the last thousand .