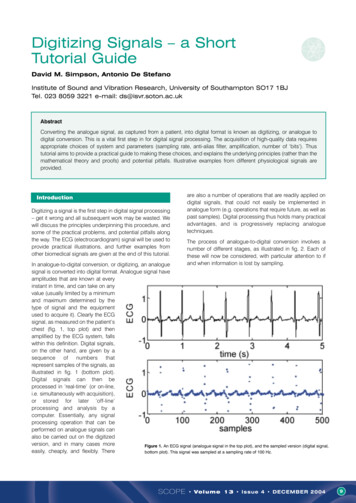
Transcription
CANDLESTICKSIGNALSThis book is given for reference. So readers may or may not read it.
: The History of Japanese Candlesticks :Throughout Candlestick Analysis you are going to find many war-like references. Between 1500 and 1600the territories of today's Japan were at constant war. Each daimyo (feudal lord) was in constant contentionto take over their neighbor. This one hundred year period is known as Sengoku Jidai or the "Age of Countryat War". This was a definite period of turmoil. It slowly came to order in the early 1600's through threedynamic generals - Nobunaga Oda, Hideyoshi Toyotomi, and Leyasu Tokugawa. Their combined leadershipprowess has become legendary folklore in Japan's history. Their achievements are described as: "Nobunagapiled the rice, Hideyoshi kneaded the dough, and Tokugawa ate the cake." All the contributions from thesegreat generals unified Japan into one nation. Tokugawa's family ruled the country from 1615 to 1867. Thisbecome known as the Tokugawa Shogunate Era.While the Candlestick methodology was being developed, a military environment persisted in Japan.Understandably, the Candlestick technique employs extensive military terminology for its explanations.Investing is correlated to battle. It requires the same tactical abilities to win. The investor has to preparefor winning trades as a general prepares for battle. A strategy is required, the psychology of coming eventshave to be thought through. Competition comes into play. Aggressive maneuvers and strategic withdrawalsare required to eventually win the war - to achieve financial success.As stability settled over the Japanese culture during the early 17th centuy, new opportunities becameapparent also. The centralized government lead by Tokugawa diminished the feudal system. Local marketsbegan to expand to a national scale. The demise of local markets created the growth of technical analysisin Japan.Osaka became regarded as Japan's capital during the Toyotomi reign. Its location near the sea made it acommercial center. Land travel was slow and dangerous, not to mention costly. It became a naturallocation for the development of the national depot system, assembling and disbursing supplies and marketproducts. It rapidly evolved into Japan's largest city of finance and commerce. Osaka, the "Kitchen ofJapan" with its vast system of warehouses, eventually established an atmosphere of price stability byreducing regional imbalances of supply. Osaka became the profit center of all Japan, completely alteringthe normal social standards. In all other cities the quest for profits was despised. Japan was composed offour classes, the Soldier, the Farmer, the Artisan, and the Merchant. It was not until the 1700's that themerchants broke down the social barrier. "Mokarimakka" which means " are you making a profit?" is stillthe common greeting in Osaka today.Under Hideyoshi's reign, a man named Yodoya Keian become a successful war merchant. He hadexceptional abilities to transport, distribute and set the price of rice. His reputation become so well known,his front yard become the first rice exchange. Unfortunately, he became very wealthy. Unfortunate becausethe Bakufu (the military government lead by the Shogun) relieved him of all his fortune. This was donebased upon the charge that he was living a life of luxury beyond his social rank. This was during a period inthe mid 1600's when the Bakufu was becoming very leary of the merchant class. A number of merchantstried to corner the rice market. They were punished by having their children executed. They were exiledand their wealth was confiscated.The Dojima Rice Exchange, the institutionalized market that developed in Yodoya's front yard, wasestablished in the late 1600's. Merchants were now capable of grading the rice, and negotiated setting themarket price. After 1710, actual rice trading expanding into issuance and negotiating for rice warehousereceipts. These become known as rice coupons, and were the first forms of futures. The Osaka ricebrokerage became the foundation for the city's wealth. 1,300 rice dealers occupied the Exchange. Due tothe debasing of coinage, rice became the medium of exchange. A daimyo in need of money could send hissurplus rice to Osaka and get a receipt from a warehouse. This receipt (coupon) could then be sold. As withmany daimyo, cashflow problems could be eliminated through this method. Sometimes many future yearsof crops were mortgaged to take care of current expenses.With the rice coupon becoming an actively traded entity, the Dojima Rice exchange became the world'sfirst futures exchange. Rice coupons were also called "empty rice" coupons, rice that was not in physicalpossession. Rice futures trading became so established in the Japanese marketplace, that in 1749, 110,000bales (rice traded in bales) were freely traded while there were only 30,000 bales in existence throughoutJapan.It was during this time period that Candlestick trading became more refined. Candlestick analysis had beendeveloped over the years simply due to the tracking of rice price movements. However, in the mid 1700'sthey were really fully utilized. "The god of the markets" Homna came into the picture. Munehisa Homna,the youngest son of the Homna family, inherited the family's business due to his extraordinary tradingsavvy. This at a time when the Japanese culture, as well as many other cultures, thought it common thatthe eldest son should inherit the family business. The trading firm was moved from their city, Sakata, toEdo (Tokyo). Homna's research into historic price moves and weather conditions established more concreteinterpretations into what became known as Candlesticks. His research and findings, known as "SakataRules" became the framework for Japanese investment philosophy.
After dominating the Osaka rice markets, Homna eventually went on to amass greater fortunes in theTokyo exchanges. It was said that he had over one hundred winning trades in a row. His abilities becamelegendary and were the basis of Candlestick analysis.Japanese Candlestick analysis was never a hidden or secretive trading system. In was successfully used inJapan for hundreds of years. It has been only recently, about 25 years ago, that it first made its way intothe U.S. trading community. Until then, there just wasn't any interest from Western cultures to investigatethe Candlestick Technique. Even then, it was not noticed all that much. The perception has been that it wasdifficult to learn and very time consuming. That may have been true until recently. The first booksintroducing it into the U.S. trading arena would describe how to make wooden boxes that were backlit.Then the chart graphs could be better viewed. Fortunately, the advent of computers and computerprogramming has taken Candlestick analysis ahead by leaps and bounds.Until recently, the investment community knew about Candlesticks, they just didn't know how to use themeffectively. Interest has been increasing dramatically now that the roaring markets have collapsed.Investors, new and old, are now trying to investigate methods that protect them from the severe lossesthat occurred from March 2000 until now.Hundreds of years of analysis and interpretation can be much more easily extracted through computerprogramming. Huge fortunes were amassed with simple charting techniques. The same will be true with allthe benefits that computer software provides the investor today.
: GLOSSARY OF CANDLE STICK SIGNALS :BULLISH SIGNALS Abandoned BabyBelt HoldBreakawayConcealing Baby SwallowDoji StarDragonfly DojiEngulfingGraveStone DojiHammerHaramiHarami CrossHoming PigeionInverted HammerKickingLadder BottomMat HoldMatching LowMeeting LinesMorning Doji StarMorning StarPiercing LineRising Three MethodsSeparating LinesSide By Side White LinesStick SandwichThree Inside UpThree Line StrikeThree Outside UpThree Stars in The SouthThree White SoldiersTri StarUnique Three RiverBottomUpside Gap ThreeMethodsUpside Tasuki GapBEARISH SIGNALS Abandoned BabyAdvance BlockBelt HoldBreakawayDark Cloud CoverDeliberationDownside Gap ThreeMethodsDownside Tasuki GapDoji StarDragonfly DojiEngulfingEvening Doji StarEvening StarFalling Three MethodsGravestone DojiHanging ManHaramiHarami CrossIdentical Three CrowsIn NeckKickingMeeting LinesOn NeckSeparating LinesShooting StarSide By Side White LinesThree Black CrowsThree Inside DownThree Line StrikeThree Outside DownThrustingTri StarTwo CrowsUpside Gap Two Crows
: GRAPHICAL REPRESENTATION OF BULLISH INDICATORS :Abandoned BabyBelt HoldBreakawayConcealing BabySwallowDoji StarDragonfly DojiHammerHaramiHarami CrossHoming PigeonInvertedHammerKickingMatching LowMeeting LinesLadder BottomMat HoldMorning Doji StarMorning StarPiercing LinesRising ThreeMethodsSeparating LinesSide By SideWhite LinesStickSandwichThree Inside UpThree Line StrikeThree OutsideUpThree LineStrikeThree Outside Up
Three Stars inThe SouthUpside Gap ThreeMethodsThree WhiteSoldiersTri StarUnique ThreeRiver BottomUpside TasukiGap
EXPLANATIONS OF BULLISH SIGNALS:: Abandoned Baby Bullish :PATTERN : REVERSALTREND : BULLISHRELIABILITY : HighHow to Identify it : First day is usually a long black daySecond day is a doji that gaps in the direction of the previous trendThe third day is a white day, gapping in the opposite direction, with no overlappingshadowsWhat it Means :In a downtrend, the market bolsters the bearish trend with a long black day and gaps openon the second day. However, the second day trades within a small range and closes at ornear its open. This scenario definitely shows the potential for a rally, as many positionshave been changed. Confirmation of the trend reversal is given by the white third day, andis well defined by the upward gap.: Belt Hold Bullish :PATTERN : ReversalTREND : BullishRELIABILITY : LowHow to Identify it : A white body occurs in a downtrend with no lower shadowWhat it Means :In a downtrend, a white body occurs with an open that is also the low for the day. This maysignify a rally for the bulls.
: Breakaway Bullish :PATTERN : ReversalTREND : BullishRELIABILITY : ModerateHow to Identify it : The first day is a long black dayThe second day is a black day that gaps below the first dayThe third and fourth days continue to in the direction of the second with lowerconsecutive closesThe fifth day is a long white day that closes into the gap between the first andsecond daysWhat it Means :A downtrend sees prices bottoming out and leveling off. The result is a long white daywhich does not close the gap into the body of the first day. This suggests a short termreversal.: Concealing Baby Swallow Bullish:PATTERN : ReversalTREND : BullishRELIABILITY : HighHow to Identify it : The first two days are Black Marubozu daysThe third day is black day that gaps downward, but trades into the body of thesecond dayThe fourth day is a Black Marubozu day that engulfs the third dayWhat it Means :In a strong downtrend, highlighted by two consecutive Black Marubozu days, a gappingblack day trades into the body of the previous day. The last day, another Black Marubozu,shows investors selling off, as it closes at a new low. This provides an opening for theshorts to cover their positions. A bullish reversal should ensue.
: Doji Star Bullish:PATTERN : ReversalTREND : BullishRELIABILITY : ModerateHow to Identify it : First day is a long black daySecond day is a doji that gaps in the direction of the previous trendThe shadows of the doji should not be longWhat it Means :In a downtrend, the market bolsters the bears with a long black day and gaps open on thesecond day. However, the second day trades within a small range and closes at or near itsopen. This scenario generally shows the potential for a rally, as many positions have beenchanged. Confirmation of the trend reversal would be a higher open on the next tradingday.: Hammer / Dragonfly Doji Bullish:PATTERN : ReversalTREND : BullishRELIABILITY : Low / ModerateHow to Identify it : Small real body at the upper end of the trading rangeLower shadow at least twice as long as the real bodyNo (or almost no) upper shadowWhat it Means :There is a sharp sell off after the market opens during a downtrend. However, by the end ofthe trading day, the market closes at or near its high for the day. This signifies a weakeningof the previous bearish sentiment, especially if the real body is white (the close is higherthan the open price). Since the certainty for a Hammer indicator is low, the trend reversalcan be confirmed by a higher open and an even higher close on the next trading day. If theopen and the close are identical, the indicator is considered a Dragonfly Doji. The DragonflyDoji has a higher reliability associated with it than a Hammer.
: Engulfing Bullish:PATTERN : ReversalTREND : BullishRELIABILITY : ModerateHow to Identify it : A long black day occursThe second day is a white that completely engulfs the real body of the first dayWhat it Means :Occurring in a downtrend, the Engulfing depicts an opening at a new low, followed by ahigh buy-in that closes at or above the previous day's open. This signifies that thedowntrend has lost momentum and the bulls may be gaining strength. The Engulfingindicator is also the first two days of the Three Outside patterns.: Inverted Hammer / Gravestone Doji Bullish:PATTERN : ReversalTREND : BullishRELIABILITY : Low / ModerateHow to Identify it : Small real body at the lower end of the trading rangeUpper shadow usually no more than twice as long as the real bodyNo (or almost no) lower shadowWhat it Means :As the market opens below the close of the previous day, the bulls rally briefly, but notenough to close above the previous day's close. As this leaves shorts in a losing position,the Inverted Hammer presents the potential fo
It was during this time period that Candlestick trading became more refined. Candlestick analysis had been developed over the years simply due to the tracking of rice price movements. However, in the mid 1700's they were really fully utilized. "The god of the markets" Homna came into the picture. Munehisa Homna, the youngest son of the Homna family, inherited the family's business due to his .