Transcription
The Heart CentreCardiac Monitoring: ECGInterpretation and Analysis1
Table of ContentsThe Heart’s Conduction System .1Action Potentials, Depolarization, RepolarizationRefractory PeriodsConduction SystemSA NodeAV NodeBundle of HisBundle BranchesPurkinje FibresWaveforms and the Cardiac Cycle 7P WavePRIQRS ComplexST SegmentT WaveQT IntervalU WaveSystematic Rhythm Interpretation 14Overview of Basic Rhythms 18Paced Rhythms 39Pacing parametersPacing modesPacing ComplicationsReferences 462
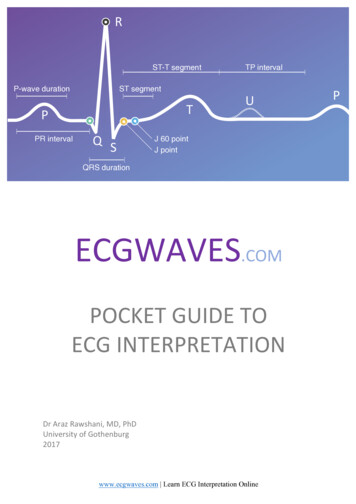
Read pages 1-20 in ECGs Made Easy, Anatomy and Physiology, for a review ofbasic cardiac structure and function prior to beginning this course as a solidunderstanding is needed to be successful.The Heart’s Conduction SystemCardiac cells have four primary characteristics:automaticity –the ability of the pacemaker cells to generate their own electricalimpulses spontaneouslyexcitability - the ability of the cells to respond to an electrical impulseconductivity – the ability of cells to conduct an electrical impulsecontractility – the ability of cells to cause muscle contractionThere are two kinds of cardiac cells – myocardial cells and pacemaker cells.Myocardial cells, or “worker” cells, are found in the muscular layer of the walls ofthe atria and ventricles. These cells are permeated by contractile filaments whichwhen stimulated electrically produce muscle contraction. The primary job ofmyocardial cells is muscle contraction and relaxation.The heart is a pump driven by electrical signals generated by all the cardiac musclecells but certain groups of cells are given the responsibility of “running the show”.These are called the pacemaker cells and they can set the pace of the heartrhythm. The pacemaker cells generate the electrical signal that gets sent in turn toevery other cell in the heart and ultimately leads to cardiac muscle contraction.They are able to generate this signal without any external force or stimulation; aunique ability of cardiac cells that is called automaticity.Electrical conduction system ofthe heart3
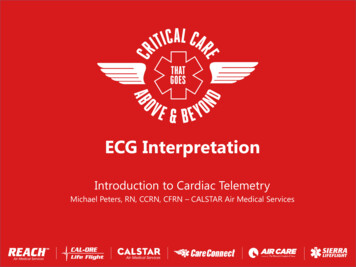
Action Potential, Depolarization and RepolarizationAn Action potential is a five phase cycle that reflects the difference in theconcentration of ions across the cell membrane at any given time. Cardiac cells arefilled with ions (electrically charged molecules). Potassium (K ) is the main ioninside cells and sodium (Na ) is the main ion outside cells. Calcium, bicarbonate,and chloride are also present but we will focus on K and Na .A membrane separates the inside of the cells from the outside of the cell. Ions areconstantly moving across this membrane through membrane channels. Thedifference in the concentration of the ions will determine the cell’s electrical charge.In the resting cell there are more negative ions inside the cell than outside. Thisresting state is called polarized. During this time no electrical activity is occurringand a straight line (isoelectric line) is recorded on the ECG.Once a cell is stimulated the cell membrane’s permeabilitychanges. K begins to leave the cell and Na begins to enterthe cell resulting in the cell becoming more positive insidethan outside. This state (more positive inside than outside)is called depolarized and a waveform is recorded on the ECG.Depolarization of one cell acts as a stimulus to adjacent cellscausing them to depolarize. When positive and negative ionscome together, energy is released, in this case an electricalimpulse. This impulse causes channels to open in the next cellmembrane and then the next and so on.Key Point:Depolarization andmuscle contractionare not the same.Depolarization is anelectrical event thatresults in musclecontraction, which is amechanical event.After depolarization the cells begin to recover, returning to their resting state. Aspecial channel on the cell membrane, called the sodium-potassium pump, activelytransports K into the cell and Na out of the cell. Once again the cells are morenegative inside and more positive outside and the cells are said to be repolarized.DepolarizationPropagation of the electrical impulses from cell to cell produces an electric currentthat can be detected by electrodes placed on the skin. This current is recorded aswaves or deflections onto graph paper, called an ECG.4
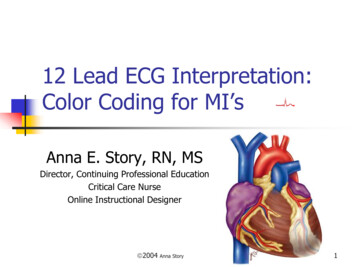
Heart’s electrical impulserepresented on ECG paperRefractory PeriodsA refractory period is the time cells need to recovery after being discharged beforethey are able to respond to another impulse. This is important because during theabsolute refractory period, myocardial cells will not respond to a stimulus nomatter how strong it is. During the relative refractory period, some cells haverepolarized and can be stimulated to respond by a strong stimulus. This is thevulnerable period of repolarization as a strong stimulus may usurp the primarypacemaker and take over pacemaker control. For example, if a prematureventricular contraction (PVC) occurred during this period, it may take over control ofthe heart in the form or ventricular tachycardia, a lethal arrhythmia. On the ECGthis period begins at the peak of the T wave and ends at the end of the T wave.Refractory periods5
Conduction SystemThe heart has specialized pathways to the atria and ventricles that conductselectricity to enable the heart to contract in a coordinated manner. Two main groupsof pacemaker cells transmit the signal to large areas of the heart. The systemconsists of the sinoatrial node (SAnode), the interatrial tract (akaBachman’s bundle), the internodaltracts, the atrioventricular node (AVnode), the bundle of His, the rightbundle branch, the left bundlebranch, and the Purkinje fibres.SA NodeThe SA node is located in the upperposterior part of the right atrium. It hasspecialized pacemaker cells thatintrinsically discharge impulses between60-100 bpm, though is capable ofdischarging up to 180 bpm. It is theprimary pacemaker of the heart. Asthe impulse leaves the SA node itspreads from cell to cell across the atrial muscle. As the impulse spreads itstimulates the right atrium, the interatrial septum and travels along Bachman’sbundle to stimulate the left atrium. This results in contraction of both atria.The SA node’s blood supply comes from either the right coronary artery (60% ofpeople) or the circumflex artery (40% of people).AV NodeThe AV node is made up of specialized conducting cells located in the floor of theright atrium (the AV node itself has no pacemaker cells). Its blood supply is via theright coronary artery in 85-90% of people.Conduction from the SA node spreads to the AV node via three internodal pathwayswhich merge with the AV node. As the impulse enters the AV node conduction isslowed before the impulse reaches the ventricles. The delay allows both atrialchambers to contract and empty blood into the ventricles (atrial kick) before thenext ventricular contraction. Without the delay the atria and ventricles wouldcontract at about the same time. The AV node also blocks some of the impulsesfrom being conducted to the ventricles when the atrial rate is rapid.Bundle of HisThe bundle of His, also called the AV bundle, is located in the upper portion of theinterventricular septum and connects the AV node with the bundle branches. Thebundle of His has pacemaker cells that have an intrinsic rate of 40 to 60 bpm andserves as the back up pacemaker when the SA node fails. Its blood supply isreceived from the left anterior descending and posterior descending arteries. The AV6
node and the bundle of His are called the AV junction. The His-Purkinje systemrefers to the bundle of His, bundle branches, and the Purkinje fibres.Bundle BranchesAfter the impulse moves through the bundle of His it proceeds through to thebundle branches. The right bundle branch conducts the electrical impulse to theright ventricle and the left bundle branch conducts to the left ventricle. The leftbundle is made up of two smaller branches called fascicles that conduct theelectrical signal to the anterior and posterior walls of the ventricle.Purkinje FibresBoth the right and left branches divide into a network of conduction fibres called thePurkinje fibres that spread through the interventricular septum into the papillarymuscle and down to the apex of the heart. The fibres then become part of themuscle cells of the ventricles. The intrinsic rate of the Purkinje fibres pacemakercells is 20 to 40 bpm. The electrical impulse moves from the endocardium to themyocardium to the epicardium and the ventricles contract in a twisting motion thatwrings blood out of the ventricles and into arteries.7
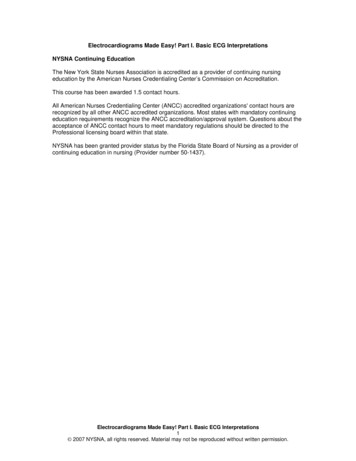
Waveforms and the Cardiac CycleECG PaperThe ECG is a graphical representation of the heart’s electrical activity. ECG paper ismade up of small boxes and large boxes measured in millimeters. Time (seconds) ison the horizontal axis and voltage (millivolts) is on the vertical axis. A small box is 1mm by 1 mm or 0.04 seconds. A large box is made up of 16 small boxes. The ECGpaper records at a speed of 25 mm/sec.Key Point:Learning ECG is likelearning a newlanguage. First youmust identify thewords and lettersbefore you put themall together.A cardiac cycle, or one heartbeat, is represented on the ECG as one PQRSTsequence.IsoelectriclineBetween cycles the ECG recorder returns to the isoelectric line, the flat line in theECG during which electrical activity is absent. Any waveform deflecting above the8
isoelectric line is considered positive and below the line is negative. A waveformthat deflects both above and below the isoelectric line is called biphasic.This is the prototypical ECG waveform.It contains all the letters and everythingis perfect and easy to identify. Don’t getuse to this as you will almost neverencounter this in a real patient.P WaveThe first deflection in the cycle is the P wave. The first part of the P waverepresents depolarization of the right atrium and the second part of the P waverepresents left atrial depolarization. As both atriadepolarize at roughly the same time we see a singlewaveform on the ECG.Normal P waves are smooth and rounded,upright in lead II, between 0.5 and 2.5 mm high,and 0.12 sec or less in width, and one P wave toevery QRS complex.Not all P waves are created equal however.Abnormal P waves can occur when the impulse hasto travel through an enlarged atria causing abnormaldepolarization of the atria and abnormal P waves. See examples below. P wavesmay also originate from a location other than the SA node - atria or AV junction.These P waves are called ectopic and may be positive or negative, and small,pointed, flat, wavy, or saw tooth in appearance. P waves originating from the AVjunction are always negative (inverted) and may precede, following or be hidden inthe QRS complex.Various P wavemorphologies9
PR Interval (PRI)The PRI is the time from the beginning of atrial depolarization to the beginning ofventricular depolarization, or the spread of the impulse from the SA node throughthe atria, through the AV node, bundle of His, bundle branches and Purkinje fibres.It includes the P wave and the short isoelectric line that follows it. The PRI varieswith heart rate – as heart rate increases the PRI shortens and vise versa.An abnormal PRI can result when there are delays in conduction through the atria,AV node, or bundle of His resulting in a PRI greater than 0.20 sec. A shorter thannormal PRI, less than 0.12 sec may occur if the impulse originates in an ectopicpacemaker close to the AV node or bundle of His, or travels down an abnormalconduction pathway (accessory pathway) that bypasses the AV node anddepolarizes the ventricles earlier than usual. Wolff-Parkinson-White is an example ofsuch a condition.The PRI is measured from the point where the P wave leaves the isoelectric line tothe beginning of the QRS complex. The duration of a normal PRI is 0.12 to 0.20sec or 0.04 sec X 5 squares.QRS ComplexThe QRS complex represents depolarization of the left and right ventricles and ismade up of the Q wave, R wave and S wave. Ventricular depolarization normallytriggers contraction of the ventricles.The QRS complex is much larger than the P wave as ventricular depolarizationinvolves a greater muscle mass than that of the atria. Remember, the QRSrepresents depolarization of both ventricles, however because the left ventricle hasa greater muscle mass than the right ventricle, we generally don’t see the deflectionfrom the right ventricle as it is hidden by the larger left ventricle.A QRS complex normally follows each P wave. Many variations exist in theconfiguration of the QRS complex and not every QRS complex contains a Q wave, Rwave or S wave. The shape indicates what path the electrical signal took throughthe ventricles. Whatever the variation, it is still called the QRS complex. The Q waveis always a negative deflection. The large triangular upright waveform is the R waveand is the first positive deflection following the P wave. The S wave is the negativewaveform following the R wave.10
Various QRSmorphologiesAbnormal QRS complexes may be a result of an impulse originating in an ectopicpacemaker. For example, if the impulse originates in the Purkinje fibres or theventricular myocardium the QRS is greater than 0.11 sec (often 0.16 sec or more).Right ventricular enlargement produces an abnormally tall R wave and leftventricular enlargement produces an abnormally deep S wave. Other variations inQRS morphology may be caused by a block in the bundle branches, prematurebeats, conduction along an accessory pathway, or from an ectopic site in theventricles.The QRS is measured from the point where thecomplex begins to deviate from the baseline andends where the last wave of the complex beginsto level out or distinctly changes direction. Thefirst downward deflection is the ‘Q wave’. The firstupright deflection is the ‘R wave’ and thedownward deflection after the ‘R wave’ is calledthe ‘S wave’. See image below whichdemonstrates the separate and distinct waves ofthe QRS which may help you determine where tostart and end your measuring. The normalduration of the QRS complex is less than0.11 sec or 3 boxes.11
ST SegmentThe ST segment represents earlyventricular repolarization and isnormally at the isoelectric line on theECG. It begins at the point where theQRS complex and the ST segmentmeet. This point is also referred to asthe J point. The ST segment may beabove (elevated) or below (depressed)the isoelectric line. To determine ifelevation or depression exists look atthe ST segment 0.06 sec (1.5 boxes)after the J point. Elevation or depression of 1 mm (one box) or more isconsidered abnormal.Myocardial ischemia, injury and infarction are causes of ST segment deviation.T WaveThe T wave represents ventricular repolarization. The normal T wave begins as thedeflection gradually slopes upward from the ST segment and ends when thewaveform returns to baseline. Normal T waves are rounded and slightlyasymmetrical, positive in lead II and less than 5 mm high. The T wave alwaysfollows the QRS complex. Abnormal T waves can be tall, peaked, flattened, low,biphasic or inverted. Common causes include MI, ischemia, pericarditis,hyperkalemia, bundle branch block and ventricular enlargement.12
Various T wave morphologiesQT IntervalThe QT interval is the period from the beginning of the QRS complex to the end ofthe T wave and represents total ventricular activity (depolarization torepolarization). The length of the QT varies according to age, gender and heart rate.A normal QT should be half the R-R interval when the rhythm is regular. Aprolonged QT indicates a delay in ventricular repolarization which can allow moretime for an ectopic focus to take control and put the ventricles at risk for ventriculardysrhythmias. Common causes include electrolyte imbalances, medications, MI,long QT syndrome.U WaveThe U wave is a small waveform that follows the T wave and representsrepolarization of the Purkinje fibres. It may or may not be present. Normal Uwaves are small, round, asymmetric and about 10% of the height of the Twave.13
R-R and P-P IntervalsThe distance from one R wave to the next R wave (and P wave to P wave) is used todetermine rhythm rate and regularity. To determine ventricular regularity,measure the distance from one R wave to the next consecutive R wave andcompare this to the other R-R intervals. Regular rhythms will have R-R intervalsthat measure the same. To determine atrial regularity, do the same thing with theP-P interval.ArtifactDistortion of the ECG tracing by non-cardiac electrical activity is called artifact.Artifact can be caused by loose electrodes, broken cables/wires, muscle tremors, orpatient movements. As it can mimic dysrhythmias it is essential to evaluate thepatient.14
Systematic Rhythm InterpretationA consistent systematic approach to rhythm analysis is important in order not tomiss something important. Use the following steps:1.Calculate the rate. Although the atrial and ventricular rates are normally thesame, they can differ in some dysrhythmias and it is important to calculateeach individually. A rate of 100 bpm or more is called a tachycardia and a rateof 60 bpm or less is called a bradycardia.There are several methods to calculate the rate. The small box method is timeconsuming but is the most accurate.Method 1: Large BoxFor regular rhythms, the rate can be determined by counting the number oflarge boxes between two R waves and then dividing that number into 300.Method 2: Small BoxTo calculate the ventricular rate count the number of small boxes between twoconsecutive R waves and divide into 1500. To calculate the atrial rate count thenumber of small boxes between two consecutive P waves and divide into 1500.If the rhythm is irregular, give a range.Method 3: RulerUsing a commercially developed ruler place the “0” mark on a complex and thethird QRS (or P for atrial rate) complex from here is the rate.15
RRUsing the small box method, the rate for the above strip would be 20 smallboxes divided into 1500 for a ventricular/atrial rate of 75 bpm.2. Assess regularity of both atriaand ventricles by measuring theP-P and R-R. A regular rhythmwill have P-P and R-R intervalsequal. If there is a slightvariation between the intervals(not all exactly the same butnot more than 0.04 secdifference) the rhythm istermed essentially regular. If the differenceis more than 0.04 seconds the rhythm isconsidered irregular. Irregular rhythms canalso be regularly irregular if there is arepeated pattern of irregularity.3. Examine the P waves. A normal P wave issmooth and round and there is one P waveassociated with one QRS complex.4. Measure the PRI. Measure from the point where the P wave leaves thebaseline to the beginning of the QRS complex. A normal PRI is 0.12 to 0.20 sec.Determine if the PRIs are all the same or if they are different. If they are thesame they are said to be constant. If it gets longer it is said to lengthen, and ifit varies in duration and has no pattern it is said to be variable. Of course, ifthere is no P wave there will be no PRI.This above PRI is 4 ½ boxes or 0.16 sec long, within normal limits and constantfor this strip.16
5.Measure the QRS. Begin measuring at the point where the first wave (Q or Rwave) of the complex begins to deviate from the baseline and end where thelast wave begins to level out (may be at, above, or below the baseline). Thenormal duration of the QRS is less than 0.11 sec. If it is greater than this it isconsidered wide. Note that a paced ventricle will always have a wide QRS dueto artificial electrical stimulation that occurs with pacing.The above QRS is 1 ½ boxes or 0.06 sec6.Examine the ST segment for elevation or depression. Our current system isnot programmed for ST segment measuring however if new ST changes arenoted in more than one lead, it should be noted.7.Interpret and document the rhythm based on the above information.When documenting the interpretation specify the site of origin. For example,sinus bradycardia or junctional bradycardia.Example: The above strip is regular, rate is 75 bpm, P waves are smooth andround and there is a P wave for every QRS complex, PRI is 0.16 sec, QRS is0.08 sec, ST is isoelectric. We would interpret this strip as sinus rhythm.17
Overview of the Basic RhythmsSinus RhythmsNormal Sinus Rhythm (RSR) The name given to a normal heart rhythm.Sinus node is the pacemakerEach beat is conducted normally through to the ventricles.Regularity: R-R intervals are constant - rhythm is regular.Rate: atrial and ventricular rates are equal; heart rate is between 60-100 bpm.P Wave: are uniform; one P wave in front of every QRS complex.PRI: measures between 0.12 and 0 .20 sec; constant from beat to beatQRS: measures less than 0.11 sec.Sinus Bradycardia (RSB) Sinus node is the pacemaker, firing regularly at a rate of less than 60 bpm Each impulse is conducted normally through to the ventricles.Regularity: R-R intervals are constant - the rhythm is regularRate: atrial and ventricular rates are equal; heart rate is less than 60 bpmP wave: uniform P wave, one for every QRS complexPRI: measures between 0.12 and 0.20 sec; constant from beat to beatQRS: measures less than 0.11 sec18
Sinus Tachycardia (RST) Sinus node is the pacemaker. Firing regularly at a rate greater than 100 times per minute. Each impulse is conducted normally through to the ventricles.Regularity: R-R intervals are constant - rhythm is regular.Rate: atrial and ventricular rates are equal: heart rate is greater than 100 bpm(usually between 100 and 160 beats per minute.)P wave: uniform P wave in front of every QRS complex.PRI: measures between 0 .12 and 0.20 sec; constant from beat to beatQRS: measures less than 0.11 sec.Sinus Arrhythmia Sinus node is the pacemaker, but impulses are initiated in an irregularpattern. Rate increases as the patient breathes in and decreases as the patientbreathes out. Each beat is conducted normally through to the ventricles.Regularity: R-R intervals varyRate: atrial and ventricular rates are equal; heart rate is usually in a normal range(60-100 bpm) but can be slowerP wave: uniform P wave in front of every QRS complexPRI: measures between 0.12 and 0.20 sec: constant from beat to beatQRS: measures less than 0.11 sec19
Sinoatrial Block Pacemaker cells within the SA node initiate an impulse but it is blocked as itexits the SA node. Appears on the ECG as a single missed beat (a P wave, QRS complex, and Twave are missing).Regularity: Irregular due to the pause(s) caused by the SA block – the pause isthe same as (or an exact multiple of) the distance between two other P-P intervalsRate: Usually normal but varies because of the pauseP wave: uniform P waves; when present, one precedes each QRS complex.PRI: measures 0.12-0.20 sec; constant from beat to beatQRS: measures 0.11 sec or less unless an intraventricular conduction delay exists.Sinus Arrest Disorder of automaticity. Pacemaker cells of the SA node fail to initiate an impulse to one or morebeats. A lower pacemaker site (the AV junction or ventricles) should assumeresponsibility for pacing the heart. If they do not, the PQRST complexes willbe absent. Pause will not be a multiple of the P-P intervals as in SA Block.Regularity: Irregular – the pause is of undetermined length (more than one PQRSTcomplex is missing) and is not the same as other P-P intervals.Rate: Usually normal but varies because of the pause.P wave: uniform P waves; when present, one precedes each QRS complex.PRI: measures 0.12-0.20 sec; constant from beat to beatQRS: measures 0.11 sec or less unless an intraventricular conduction delay exists.20
Atrial RhythmsAn atrial rhythm originates somewhere in the atrial tissue. The pacemaker in thisrhythm can be a single irritable focus in the atria or it can be multiple irritable foci.You may see a P wave if the atria depolarize in an organized fashion. If the P wavedoes not originate in the SA Node it will look different - may be inverted, peaked orjagged.If the atria are fibrillating, you will not see a P wave but will see a wavy baselinebetween irregular QRS complexes.Once the impulse reaches the AV node, conduction will follow the normal pathwayand you will see a normal looking QRS and T wave.It is important to remember that when atrial conduction does not occur normally,15-30% of cardiac output (atrial kick) is lost. This may have clinical implications inpatients who have myocardial dysfunction and are already compromised.Premature Atrial Complex (PAC) Pacemaker is an irritable focus within the atria which fires prematurely andproduces a single ectopic beat.Conduction through to the ventricles is normal.Regularity: single premature ectopic beat it will interrupt the regularity of theunderlying rhythm.Rate: overall heart rate will depend on the rate of the underlying rhythmP wave: P wave of the premature beat may have a different morphology than the Pwaves of the rest of the strip. The ectopic beat will have a P wave, but it can beflattened, notched, or otherwise unusual. It may be hidden within the T wave of thepreceding complex.PRI: measures between 0.12 and 0.20 sec, but can be prolonged; PRI of theectopic will probably be different from the PRI of the other complexes.QRS: measures less than 0.11 sec21
Multiformed Atrial Rhythm (or Wandering Atrial Pacemaker) Pacemaker site wanders between the sinus node, the atria, and the AVjunction.Although each beat originates from a different focus, the rate usually remainswithin a normal range. However it can be slower.Conduction through to the ventricles is normal.Regularity: R-R intervals vary slightly as the pacemaker site changes; rhythm canbe slightly irregular.Rate: atrial and ventricular rates are equal; heart rate is usually within a normalrange (60-100 bpm) but can be slower. If the rate is greater than 100 bpm, therhythm is termed multifocal atrial tachycardia.P wave: morphology of the P wave changes as the pace-maker site changes. Thereis one P wave in front of every QRS complex, although some may be difficult to seedepending on the pacemaker site.PRI: measurement will vary slightly as the pacemaker site changes. All PRI shouldbe less than 0.20 sec: some may be less than 0.12 sec.QRS: measures less than 0.11 secAtrial Tachycardia Pacemaker is a single irritable site within the atrium which fires repetitively ata very rapid rate.Conduction through to the ventricles is normal.22
Regularity: R-R intervals are constant - rhythm is regularRate: atrial and ventricular rates are equal; heart rate is usually 150-250 bpmP wave: one P wave in front of every QRS complex. The configuration of the Pwave will be different than that of sinus P waves - may be flattened, notched orhidden in the T waves of the preceding beats.PRI: measures between 0.12 and 0.20 sec; constant across the strip. The PRI maybe difficult to measure if the P wave is obscured by the T wave.QRS: measures less than 0.11 secAtrial Flutter A single irritable focus within the atria issues an impulse that is conducted in arapid, repetitive fashion at a rate of up to 300 bpm.AV node blocks some of the impulses from being conducted through to theventricles protect the ventricles from receiving too many impulses.Regularity: atrial rhythm is regular; ventricular regular or irregular depending onAV conduction and blockade.Rate: Atrial rate is usually between 250 and 350 bpm. Ventricular rate will dependon the ratio of impulses conducted through to the ventricles.23
P wave: No identifiable P waves; saw tooth flutter waves are present.PRI: not measured.QRS: measures less than 0.11 sec; may be wide if flutter waves are buried in theQRS complex.Atrial Fibrillation (A-Fib) altered automaticitymultitude of foci initiate impulses causing the atria to depolarize repeatedly ata rate of 400-600 bpmrapid impulses cause atria to quiver or fibrillate resulting in ineffectivecontractionAV node blocks most of the impulses, allowing only a limited number throughto the ventricles.Regularity: atrial rhythm is not measurable; ventricular rhythm is grosslyirregular, having no pattern to its irregularity.Rate: atrial rate cannot be measured because it is so chaotic but usually 400-600bpm. The ventricular rate is irregular and significantly slower because the AV nodeblocks most of the impulses. If the ventricular rate is below 100 beats per minutethe rhythm is said to be “controlled”; if it is over 100 beats per minute, it isconsidered to have a “rapid ventricular response” or uncontrolled.P wave: atria are not depolarizing in an effective way and are fibrillating; no Pwave is produced. All atrial activity is depicted as “fibrillatory” waves, or grosslychaotic undulations of the baseline.PRI: no P waves no PRIQRS: measures less than 0.11 sec unless an intraventricular conduction delayexists.Junctional DysrhythmiasAs studied with the previous rhythms, the SA node is normally the hearts primarypacemaker. The AV junction will assume responsibility of the heart as a protectivemechanism. Rhythms that originate from the AV junction are called JunctionalDysrhythmias.When the pacemaker is the AV Junction, the atria may or may not be depolarized.If they are depolarized, the electrical activity will have to travel backwards24
(retrograde) to activate the atria. This will result in an inverted P wave that maybe seen after the QRS. You may not see a p wave at all if the atria are notactivated.Once conduction leaves the AV Junction and travels toward the ventricle,conduction follows the normal path. For this reason, you will see a normal lookingQRS and T wave. Because of the loss of atrial synchrony in these rhythms atrialkick is lost (remember 15 - 30% of cardiac output). This can have significantclinical effect.The AV junction may pace the heart if:-the SA node fails to discharge (sinus arrest)-an impulse fr
ECG Paper The ECG is a graphical representation of the heart’s electrical activity. ECG paper is made up of small boxes and large boxes measured in millimeters. Time (seconds) is on the horizontal axis and voltage (millivolts) is on the vertical axis. A small box is 1 mm by 1 mm or 0.04 seconds. A large box is mad