Transcription
Child Maltreatment29252018AOFTIYERNGthR EPORU.S. Department of Health & Human ServicesAdministration for Children and FamiliesAdministration on Children, Youth and FamiliesChildren’s Bureau
This report was prepared by the Children’s Bureau (Administration on Children, Youth andFamilies, Administration for Children and Families) of the U.S. Department of Health andHuman Services.Public Domain NoticeMaterial contained in this publication is in the public domain and may be reproduced, fullyor partially, without permission of the federal government.Electronic AccessThis report is available on the Children’s Bureau website ns and More InformationIf you have questions or require additional information about this report, please contact theChild Welfare Information Gateway at info@childwelfare.gov or 1–800–394–3366. If youhave questions about a specific state’s data or policies, contact information is provided foreach state in Appendix D, State Commentary.Data SetsRestricted use files of the NCANDS data are archived at the National Data Archive on ChildAbuse and Neglect (NDACAN) at Cornell University. Researchers who are interested inthese data for statistical analyses may contact NDACAN by phone at 607–255–7799, byemail at ndacan@cornell.edu, or NDACANsupport@cornell.edu. NDACAN serves as therepository for the NCANDS data sets, but is not the author of the Child Maltreatment report.Recommended CitationU.S. Department of Health & Human Services, Administration for Children and Families,Administration on Children, Youth and Families, Children’s Bureau. (2020). ChildMaltreatment 2018. Available from y/statistics-research/child-maltreatment.Federal ContactElaine Voces Stedt, MSWDirectorOffice on Child Abuse and Neglect/Children’s Bureau/ACYF/ACF/HHSMary E. Switzer Building330 C Street SWWashington, DC 20201elaine.stedt@acf.hhs.gov
Child Maltreatment2018
DEPARTMENT OF HEALTH & HUMAN SERVICESADMINISTRATION FOR CHILDREN AND FAMILIESAdministration on Children, Youth and Families330 C Street, SW, Washington, D.C. 20201Letter from the Associate Commissioner:Child Maltreatment 2018 is the 29th edition of the annual Child Maltreatment reportseries. States provide the data for this report through the National Child Abuse andNeglect Data System (NCANDS). NCANDS was established in 1988 as a voluntary,national data collection and analysis program to make available state child abuseand neglect information. Data have been collected every year since 1991 and arecollected from child welfare agencies in the 50 states, the Commonwealth of PuertoRico, and the District of Columbia. Key findings in this report include: The national rounded number of children who received a child protective servicesinvestigation response or alternative response increased 8.4 percent from 2014(3,261,000) to 2018 (3,534,000).The number and rate of victims have fluctuated during the past 5 years. Comparingthe national rounded number of victims from 2014 (675,000) to the national roundednumber of victims in 2018 (678,000) shows an increase of 0.4 percent.The 2018 data show more than four-fifths (84.5%) of victims suffer a single typeof maltreatment. Sixty percent (60.8) are neglected only, 10.7 percent are physically abused only, and 7.0 percent are sexually abused only. More than 15 percent(15.5%) are victims of two or more maltreatment types.For 2018, an estimated 1,770 children died of abuse and neglect at a rate of 2.39per 100,000 children in the national population.1The Child Maltreatment report series is an important resource relied upon by thousandsof researchers, practitioners, and advocates throughout the world. The report is availablefrom our website at y/statisticsresearch/child-maltreatment.NCANDS would not be possible without the time, effort, and dedication of state andlocal child welfare, information technology, and related agency personnel workingtogether on behalf of children and families. We gratefully acknowledge the effortsof all involved to make resources like this report possible and will continue to doeverything we can to promote the safety and well-being of our nation’s children.Sincerely,/s/Jerry MilnerAssociate CommissionerChildren’s Bureau1If fewer than 52 states reported data, the national estimate of child fatalities is calculated by multiplying thenational fatality rate by the child population of all 52 states and dividing by 100,000. The estimate is rounded tothe nearest 10. For 2018, 51 states reported data.Child Maltreatment 2018Letterii
AcknowledgementsThe Administration on Children, Youth and Families (ACYF) strives to ensure thewell-being of our Nation’s children through many programs and activities. One suchactivity is the National Child Abuse and Neglect Data System (NCANDS) of theChildren’s Bureau.National and state statistics about child maltreatment are derived from the datacollected by child protective services agencies and reported to NCANDS. The dataare analyzed, disseminated, and released in an annual report. Child Maltreatment2018 marks the 29th edition of this report. The administration hopes that the reportcontinues to serve as a valuable resource for policymakers, child welfare practitioners, researchers, and other concerned citizens.The 2018 national statistics were based upon receiving case-level and aggregate datafrom the 50 states, the Commonwealth of Puerto Rico, and the District of Columbia.ACYF wishes to thank the many people who made this publication possible. TheChildren’s Bureau has been fortunate to collaborate with informed and committedstate personnel who work hard to provide comprehensive data, which reflect the workof their agencies.ACYF gratefully acknowledges the priorities that were set by state and local agencies to submit these data to the Children’s Bureau, and thanks the caseworkers andsupervisors who contribute to and use their state’s information system. The time andeffort dedicated by these and other individuals are the foundation of this successfulfederal-state partnership.Child Maltreatment 2018Acknowledgementsiii
ContentsLetter from the AssociAte r 1: IntroductionBackground of NCANDSNew Reporting to NCANDSAnnual Data Collection ProcessNCANDS as a ResourceStructure of the Report112234chApter 2: ReportsScreeningReport SourcesCPS Response TimeCPS Workforce and CaseloadExhibit and Table Notes6689910chApter 3: ChildrenAlternative ResponseUnique and Duplicate CountsChildren Who Received an Investigation or Alternative ResponseChildren Who Received an Investigation or Alternative Response by DispositionNumber of Child VictimsChild Victim DemographicsMaltreatment TypesRisk FactorsPerpetrator RelationshipExhibit and Table Notes1617171818192021212222chApter 4: FatalitiesNumber of Child FatalitiesChild Fatality DemographicsMaltreatment TypesRisk FactorsPerpetrator RelationshipPrior CPS ContactExhibit and Table Notes4546464848484949Child Maltreatment 2018Contentsiv
chApter 5: PerpetratorsNumber of PerpetratorsPerpetrator DemographicsPerpetrator RelationshipExhibit and Table Notes5656565758chApter 6: ServicesPrevention ServicesPostresponse ServicesHistory of Receiving ServicesPart C of the Individuals with Disabilities Education Act (IDEA)Exhibit and Table Notes686870717272chApter 7: Special Focus8686868787888989Sex TraffickingReporting Sex Trafficking Data to NCANDSNumber and Demographics of Victims of Sex TraffickingVictims of Sex Trafficking by Relationship to Their PerpetratorsInfants with Prenatal Substance ExposureReporting Infants with Prenatal Substance Exposure Data to NCANDSNumber of Infants with Prenatal Substance ExposureScreened-in Infants with Prenatal Substance Exposure Who Received an Investigationor Alternative Response by DispositionScreened-in Infants with Prenatal Substance Exposure Who Have a Plan of Safe CareScreened-in Infants with Prenatal Substance Exposure Who Have a Referral toAppropriate ServicesExhibit and Table Notes90909191Appendix A: CAPTA Data Items103Appendix B: Glossary105Appendix c: State Characteristics122Appendix d: State Commentary130Child Maltreatment 2018Contentsv
ExhibitsExhibit S–1 Summary of Child Maltreatment Rates per 1,000 Children, 2014–2018Exhibit S–2 Statistics at a Glance, 2018Exhibit 2–A Screened-in Referral Rates, 2014–2018Exhibit 2–B Screened-out Referral Rates, 2014–2018Exhibit 2–C Total Referral Rates, 2014–2018Exhibit 2–D Report Sources, 2018Exhibit 3–A Child Disposition Rates, 2014–2018Exhibit 3–B Children Who Received an Investigation or Alternative Responseby Disposition, 2018Exhibit 3–C Child Victimization Rates, 2014–2018Exhibit 3–D Victims by Age, 2018Exhibit 4–A Child Fatality Rates per 100,000 Children, 2014–2018Exhibit 4–B Child Fatalities by Age, 2018Exhibit 4–C Child Fatalities by Sex, 2018Exhibit 4–D Child Fatalities by Race and Ethnicity, 2018Exhibit 4–E Maltreatment Types of Child Fatalities, 2018Exhibit 4–F Child Fatalities with Selected Caregiver Risk Factors, 2018Exhibit 5–A Perpetrators by Age, 2018Exhibit 5–B Perpetrators by Race or Ethnicity, 2018Exhibit 7–A Victims of Sex Trafficking by Sex, 2018Exhibit 7–B Victims of Sex Trafficking by Relationship Category to TheirPerpetrators, 2018Exhibit 7–C Screened-in Infants with Prenatal Substance Exposure Who Receivedan Investigation or Alternative Response by Disposition, 1Table 2–1 Screened-in and Screened-out Referrals, 2018Table 2–2 Average Response Time in Hours, 2014–2018Table 2–3 Child Protective Services Workforce, 2018Table 2–4 Child Protective Services Caseload, 2018Table 3–1 Children Who Received an Investigation or Alternative Response, 2014–2018Table 3–2 Children Who Received an Investigation or Alternative Response byDisposition, 2018Table 3–3 Child Victims, 2014–2018Table 3–4 First-time Victims, 2014–2018Table 3–5 Victims by Age, 2018Table 3–6 Victims by Sex, 2018Table 3–7 Victims by Race or Ethnicity, 2018Table 3–8 Maltreatment Types of Victims, 2018Table 3–9 Victims with an Alcohol Abuse Caregiver Risk Factor, 2016–2018Table 3–10 Victims with a Drug Abuse Caregiver Risk Factor, 2016–2018Table 3–11 Victims by Relationship to Their Perpetrators, 2018Table 4–1 Child Fatalities by Submission Type, 2018Table 4–2 Child Fatalities, 2014–2018Table 4–3 Child Fatalities by Age, 2018Table 4–4 Child Fatalities by Relationship to Their Perpetrators, 20182729313337384042434451525353ContentsviChild Maltreatment 20181213141525
Table 4–5 Child Fatalities Who Received Family Preservation Services Within thePrevious 5 Years, 2018Table 4–6 Child Fatalities Who Were Reunited with Their Families Within thePrevious 5 Years, 2018Table 5–1 Perpetrators, 2014–2018Table 5–2 Perpetrators by Age, 2018Table 5–3 Perpetrators by Sex, 2018Table 5–4 Perpetrators by Race or Ethnicity, 2018Table 5–5 Perpetrators by Relationship to Their Victims, 2018Table 6–1 Children who Received Prevention Services by Funding Source, 2018Table 6–2 Children who Received Postresponse Services, 2018Table 6–3 Average Number of Days to Initiation of Services, 2018Table 6–4 Children who Received Foster Care Postresponse Services and Whohad a Removal Date on or After the Report Date, 2018Table 6–5 Victims with Court Action, 2018Table 6–6 Victims with Court-Appointed Representatives, 2018Table 6–7 Victims Who Received Family Preservation Services Within thePrevious 5 Years, 2018Table 6–8 Victims Who Were Reunited with Their Families Within thePrevious 5 Years, 2018Table 6–9 IDEA: Victims Who Were Eligible and Victims Who Were Referred toPart C Agencies, 2018Table 7–1 Victims of Sex Trafficking by Sex, 2018Table 7–2 Victims of Sex Trafficking by Sex and Age, 2018Table 7–3 Victims of Sex Trafficking by Race or Ethnicity, 2018Table 7–4 Victims of Sex Trafficking by Relationship to Their Perpetrators, 2018Table 7–5 Infants with Prenatal Substance Exposure by Submission Type, 2018Table 7–6 Screened-in Infants with Prenatal Substance Exposure Percent, 2018Table 7–7 Screened-in Infants with Prenatal Substance Exposure Who Receivedan Investigation or Alternative Response by Disposition, 2018Table 7–8 Screened-in Infants with Prenatal Substance Exposure Who Have a Planof Safe Care, 2018Table 7–9 Screened-in Infants with Prenatal Substance Exposure Who Have aReferral to Appropriate Services, 2018Table C–1 State Administrative Structure, Level of Evidence, and Data FilesSubmitted, 2018Table C–2 Child Population, 2014–2018Table C–3 Child Population Demographics, 2018Table C–4 Adult Population by Age Group, 2018Child Maltreatment 96979899100101124125126129vii
SummaryOverviewAll 50 states, the District of Columbia, and the U.S. Territories have child abuseand neglect reporting laws that mandate certain professionals and institutions refersuspected maltreatment to a child protective services (CPS) agency.Each state has its own definitions of child abuse and neglect that are based onstandards set by federal law. Federal legislation provides a foundation for states byidentifying a set of acts or behaviors that define child abuse and neglect. The ChildAbuse Prevention and Treatment Act (CAPTA), (P.L. 100–294), as amended by theCAPTA Reauthorization Act of 2010 (P.L. 111–320), retained the existing definition ofchild abuse and neglect as, at a minimum:Any recent act or failure to act on the part of a parent or caretaker which resultsin death, serious physical or emotional harm, sexual abuse or exploitation [ ]; oran act or failure to act, which presents an imminent risk of serious harm.The following pages provide a summary of key information from this report. Theinformation is provided in a question and answer format as the Children’s Bureau isanticipating the most common questions for each chapter of the report. Please referto the individual chapters for detailed information about each topic and the relevantdata. Definitions of terms also are provided in Appendix B, Glossary.What is the National Child Abuse and Neglect Data System (NCANDS)?NCANDS is a federally sponsored effort that collects and analyzes annual data onchild abuse and neglect. The 1988 CAPTA amendments directed the U.S. Departmentof Health and Human Services to establish a national data collection and analysisprogram. The data are collected and analyzed by the Children’s Bureau in theAdministration on Children, Youth and Families, the Administration for Children andFamilies (ACF) within the U.S. Department of Health and Human Services (HHS).The data are submitted voluntarily by the 50 states, the District of Columbia, and theCommonwealth of Puerto Rico. The first report from NCANDS was based on data for1990. This report for federal fiscal year (FFY) 2018 data is the 29th issuance of thisannual publication. (See chapter 1.)Child Maltreatment 2018Summaryviii
How are the data used?NCANDS data are used for the Child Maltreatment report series. In addition, the dataare a critical source of information for many publications, reports, and activities of thefederal government and other groups. For example, NCANDS data are used in theannual publication, Child Welfare Outcomes: Report to Congress. More informationabout these reports and programs are available on the Children’s Bureau website athttps://www.acf.hhs.gov/cb. (See chapter 1.)What data are collected?Once an allegation (called a referral) of abuse and neglect is received by a CPSagency, it is either screened in for a response by CPS or it is screened out. Ascreened-in referral is called a report. CPS agencies respond to all reports. In moststates, the majority of reports receive investigations, which determines if a child wasmaltreated or is at-risk of maltreatment and establishes whether an intervention isneeded. Some reports receive alternative responses, which focus primarily uponthe needs of the family and do not determine if a child was maltreated or is at-risk ofmaltreatment.NCANDS collects case-level data on all children who received a CPS agencyresponse in the form of an investigation response or an alternative response.Case-level data (meaning individual child record data) include information about thecharacteristics of screened-in referrals (reports) of abuse and neglect that are madeto CPS agencies, the children involved, the types of maltreatment they suffered, thedispositions of the CPS responses, the risk factors of the child and the caregivers,the services that are provided, and the perpetrators. (See chapter 1.)Where are the data available?The Child Maltreatment reports are available on the Children’s Bureau website ogy/statistics-research/childmaltreatment. If you have questions or require additional information about this report,please contact the Child Welfare Information Gateway at info@childwelfare.gov or1–800–394–3366. Restricted use files of NCANDS data are archived at the NationalData Archive on Child Abuse and Neglect (NDACAN) at Cornell University.Researchers who are interested in using these data for statistical analyses may contact NDACAN by phone at 607–255–7799 or by email at ndacan@cornell.edu. (Seechapter 1.)How many allegations of maltreatment were reported and receivedan investigation response or alternative response?During FFY 2018, CPS agencies received a national estimate of 4.3 million totalreferrals alleging abuse and neglect involving approximately 7.8 million children.For FFY 2018, 52 states screened in 2.4 million referrals for a CPS response. Thenational rate of screened-in referrals (reports) is 32.5 per 1,000 children in thenational population. Among the 46 states that report both screened-in and screenedout referrals, 56.0 percent of referrals are screened in and 44.0 percent are screenedout. (See chapter 2.)Child Maltreatment 2018Summaryix
Who reported child maltreatment?For 2018, professionals submitted 67.3 percent of reports alleging child abuse andneglect. The term professional means that the person has contact with the allegedchild maltreatment victim as part of his or her job. This term includes teachers, policeofficers, lawyers, and social services staff. The highest percentages of reports arefrom education personnel (20.5%), legal and law enforcement personnel (18.7%), andsocial services personnel (10.7%).Nonprofessionals—including friends, neighbors, and relatives—submitted fewer thanone-fifth of reports (16.6%). Unclassified sources submitted the remaining reports(16.1%). Unclassified includes anonymous, “other,” and unknown report sources.States use the code “other” for any report source that does not have an NCANDSdesignated code. See Appendix D, State Commentary, for additional informationprovided by the states as to what is included in “other.” (See chapter 2.)Who were the child victims?For FFY 2018, there are nationally 678,000 (rounded) victims of child abuse andneglect. The victim rate is 9.2 victims per 1,000 children in the population. (See chapter 3.) Victim demographics include: Children in their first year of life have the highest rate of victimization at 26.7 per1,000 children of the same age in the national population. The victimization rate for girls is 9.6 per 1,000 girls in the population, which ishigher than boys at 8.7 per 1,000 boys in the population. American Indian or Alaska Native children have the highest rate of victimization at15.2 per 1,000 children in the population of the same race or ethnicity; and AfricanAmerican children have the second highest rate at 14.0 per 1,000 children of thesame race or ethnicity.What were the most common types of maltreatment?The victim maltreatment types are analyzed differently for this report than in prioreditions to count victims and maltreatment types uniquely (in prior editions, a duplicate count was used). If a victim has two or more maltreatment types, the victim iscounted once in the multiple maltreatment category. The FFY 2018 data show 84.5percent of victims suffered from a single maltreatment type and the remaining 15.5percent have two or more maltreatment types. Three-fifths (60.8%) of victims areneglected only. (See chapter 3.)How many children died from abuse or neglect?Child fatalities are the most tragic consequence of maltreatment. For FFY 2018, anational estimate of 1,770 children died from abuse and neglect at a rate of 2.39 per100,000 children in the population. (See chapter 4.) The child fatality demographicsshow: The youngest children are the most vulnerable to maltreatment, with 46.6 percentof child fatalities younger than 1 year old and died at a rate of 22.77 per 100,000children in the population of the same age. Boys have a higher child fatality rate than girls; 2.87 per 100,000 boys in thepopulation, compared with 2.19 per 100,000 girls in the population.Child Maltreatment 2018Summaryx
The rate of African-American child fatalities (5.48 per 100,000 African-Americanchildren) is 2.8 times greater than the rate of White children (1.94 per 100,000White children) and 3.4 times greater than the rate of Hispanic children (1.63 per100,000 Hispanic children).Who abused and neglected children?A perpetrator is the person who is responsible for the abuse or neglect of a child.Fifty-two states reported 546,365 perpetrators. (See chapter 5.) The analyses ofcase level data show: More than four-fifths (83.3%) of perpetrators are between the ages of 18 and 44years old. More than one-half (53.8%) of perpetrators are female and 45.3 percent of perpetrators are male. The three largest percentages of perpetrators are White (49.6%), African-American(20.6%), and Hispanic (19.3%). The majority (77.5%) of perpetrators are a parent to their victim.Who received services?CPS agencies provide services to children and their families, both in their homesand in foster care. Reasons for providing services may include (1) preventing futureinstances of child maltreatment and (2) remedying conditions that brought the children and their family to the attention of the agency. (See chapter 6.) During 2018: Forty-seven states reported approximately 2.0 million children received preventionservices. Approximately 1.3 million children (duplicate count) received postresponse services from a CPS agency. Two-thirds (60.7%) of victims (duplicate count) and one third (29.0%) of nonvictims(duplicate count) received postresponse services.What is the Special Focus chapter?The purpose of this chapter is to highlight analyses of specific subsets of children.These analyses may otherwise have been spread throughout the report in differentchapters, which can make it more difficult for readers to see the whole analyticalpicture. The analyses included in this chapter for FFY 2018 focus on the new dataelements for sex trafficking and infants with prenatal substance exposure. (Seechapter 7.)How many victims of sex trafficking are there?The Justice for Victims of Trafficking Act of 2015 includes an amendment to CAPTAto collect and report the number of children determined to be victims of sex trafficking. This is the first year for which states are reporting the new maltreatment type ofsex trafficking. For FFY 2018, 27 states report 741 unique victims of sex trafficking.(See chapter 7.)Child Maltreatment 2018Summaryxi
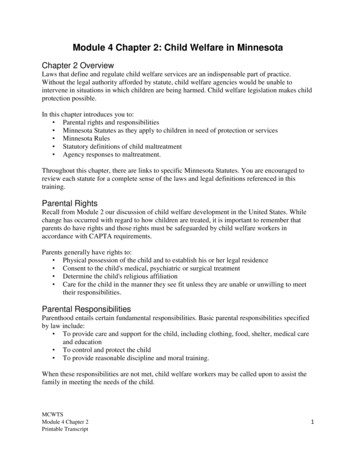
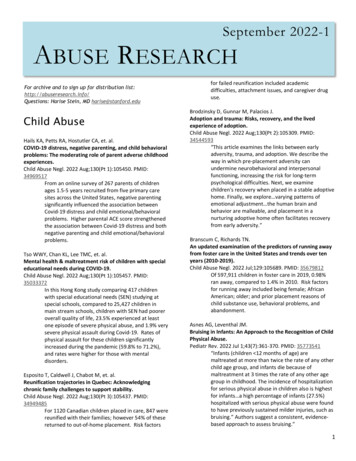
How many infants with prenatal substance exposure are there?The Comprehensive Addiction and Recovery Act (CARA) of 2016 includes anamendment to CAPTA to collect and report the number of infants with prenatalsubstance exposure (IPSE), IPSE with a plan of safe care, and IPSE with a referralto appropriate services. FFY 2018 data show 27,709 children in 45 states referred toCPS agencies as IPSE. (See chapter 7.)A summary of national rates per 1,000 children is provided below (S–1) and a onepage chart of key statistics from the annual report is on the following page (S–2).Exhibit S–1 Summary Child Maltreatment Rates per 1,000 Children, 2014–2018Child Maltreatment 2018Summaryxii
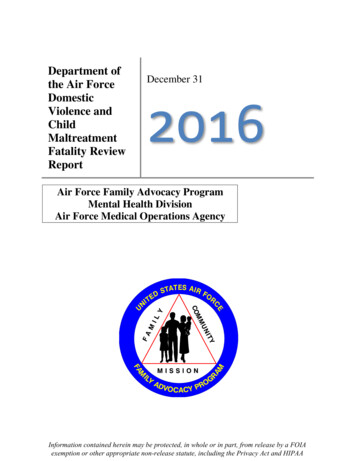
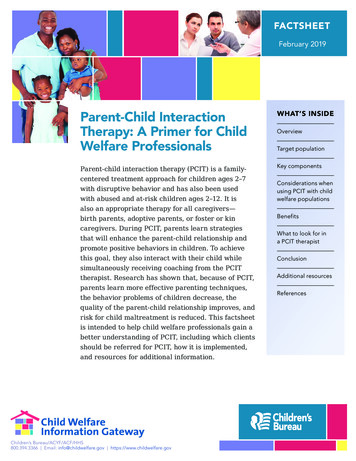
Exhibit S–2 Statistics at a Glance, 2018Referrals4.3 million* REFERRALSalleging maltreatment to CPS involving7.8 million CHILDREN*156.0% referrals SCREENED IN22.4 million REPORTS received a disposition (finding)678,000 VICTIMS Includes 1,770 Fatalities*Services44.0% referrals SCREENED OUT2Submitted by67.3% professionals16.6% nonprofessionals16.1% unclassified3.5 million CHILDREN receivedeither an investigation or alternative responseChildrenReports(become reports)2,822,000 NONVICTIMS 3, 4391,661 VICTIMS5received postresponse services951,678 NONVICTIMS4, 5received postresponse services146,706 VICTIMSreceived foster care services60,354 NONVICTIMS4, 6received foster care services(on or after the report date)(on or after the report date)* Indicates a nationally estimated number. indicates a rounded number. Please refer to therelevant chapter notes for information about thresholds, exclusions, and how the estimates arecalculated.1 The average number of children included in a referral was (1.8).2 For the states that reported both screened-in and screened-out referrals.3 The estimated number of unique nonvictims was calculated by subtracting the unique countof victims from the unique count of children.4 Includes children who received an alternative response.5 Based on data from 50 states.6 Based on data from 49 states.Child Maltreatment 2018Summaryxiii
IntroductionCHAPTER 1Child abuse and neglect is one of the Nation’s most serious concerns. This important issueis addressed in many ways by the Children’s Bureau in the Administration on Children,Youth and Families, the Administration for Children and Families (ACF) within the U.S.Department of Health and Human Services (HHS). The Children’s Bureau strives to ensurethe safety, permanency, and well-being of all children by working with state, tribal, and localagencies to develop programs to prevent child abuse and neglect. To achieve our goals, weparticipate in a variety of projects, including: Providing guidance on federal law, policy, and program regulations. Funding essential services, helping states and tribes operate every aspect of their childwelfare systems. Supporting innovation through competitive, peer-reviewed grants for research and pro gram development. Offering training and technical assistance to improve child welfare service delivery.Monitoring child welfare services to help states and tribes achieve positive outcomes forchildren and families. Sharing research to help child welfare professionals improve their services.Child Maltreatment 2018 presents national data about child abuse and neglect known tochild protective services (CPS) agencies in the United States during federal fiscal year (FFY)2018. The data are collected and analyzed through the National Child Abuse and NeglectData System (NCANDS), which is an initiative of the Children’s Bureau. Because NCANDScontains all screened-in referrals to CPS agencies that receive a disposition and those thatreceive an alternative response, these data represent the universe of known child maltreatment cases for FFY 2018.Background of NCANDSThe Child Abuse Prevention and Treatment Act (CAPTA) was amended in 1988 (P.L. 100–294) to direct the Secretary of HHS to establish a national data collection and analysis program, which would make available state child abuse and neglect reporting information. HHSresponded by establishing NCANDS as a voluntary national reporting system. During 1992,HHS produced its first NCANDS report based on data from 1990. The Child Maltreatmentreport series evolved from that initial report and is now in its 29th edition. During 1996,CAPTA was amended to require all states that receive funds from the Basic State Grantprogram to work with the Secretary of HHS to provide specific data, to the maximum extentpracticable, about children who had been maltreated. Subsequent CAPTA amendments addedChild Maltreatment 2018chApter 1: Introduction1
data elements and readers are encouraged to review Appendix A, CAPTA Data Items, mostof which are reported by states to NCANDS.A successful federal-state partnership is the core component of NCANDS. Each state designates one person to be the NCANDS state contact. The state contacts from all 52 states (unlessotherwise noted, the term “states” includes the District of Columbia and the Commonwealth ofPuerto Rico) work with the Children’s Bureau and the NCANDS Technical Team to uphold thehigh-quality standards associated with NCANDS data. Webinars, technical bulletins, virtualmeetings, email, listserv discussions, and phone conferences are used regularly to facilitateinformation sharing and provision of technical assistance.NCANDS has the objective to collect nationally standardized case-level and aggregatedata and to make these data useful for policy decision-makers, child welfare researchers,and practitioners. The NCANDS Technical Team developed a general data standardization(mapping) procedure whereby all states systematically define the rules for extracting the datafrom the states’ child welfare information system into the standard NCANDS data format.Team members provide one-on-one technical assistance to states to assist with data mapping,construction, extraction, and data submission and validation.New Reporting to NCANDSFFY 2018 is the first year states are reporting data from two enacted laws that amendedCAPTA: The Justice for Victims of Trafficking Act of 2015 (P.L. 114–22)—includes a CAPTAamendment that requires each state to report, to the extent practicable, the number ofchildren determined to be victims of sex trafficking. The Comprehensive Addiction and Recovery Act of 2016 (P.L. 114–198)—includes aCAPTA amendment that requires states to report, to the extent practicable, the numberof infants identified by he
Elaine Voces Stedt, MSW Director Ofice on Child Abuse and Neglect/ Children's Bureau/ACYF/ACF/HHS Mary E. Switzer Building 330 C Street SW Washington, DC 20201 . elaine.stedt@acf.hhs.gov . Child Maltreatment 2018 . Child Maltreatment 2018 Letter ii