Transcription
Electrocardiograms Made Easy! Part I. Basic ECG InterpretationsNYSNA Continuing EducationThe New York State Nurses Association is accredited as a provider of continuing nursingeducation by the American Nurses Credentialing Center’s Commission on Accreditation.This course has been awarded 1.5 contact hours.All American Nurses Credentialing Center (ANCC) accredited organizations' contact hours arerecognized by all other ANCC accredited organizations. Most states with mandatory continuingeducation requirements recognize the ANCC accreditation/approval system. Questions about theacceptance of ANCC contact hours to meet mandatory regulations should be directed to theProfessional licensing board within that state.NYSNA has been granted provider status by the Florida State Board of Nursing as a provider ofcontinuing education in nursing (Provider number 50-1437).Electrocardiograms Made Easy! Part I. Basic ECG Interpretations1 2007 NYSNA, all rights reserved. Material may not be reproduced without written permission.
How to Take This CoursePlease take a look at the steps below; these will help you to progress through the coursematerial, complete the course examination and receive your certificate of completion.1. REVIEW THE OBJECTIVESThe objectives provide an overview of the entire course and identify what information willbe focused on. Objectives are stated in terms of what you, the learner, will know or beable to do upon successful completion of the course. They let you know what you shouldexpect to learn by taking a particular course and can help focus your study.2. STUDY EACH SECTION IN ORDERKeep your learning "programmed" by reviewing the materials in order. This will help youunderstand the sections that follow.3. COMPLETE THE COURSE EXAMAfter studying the course, click on the "Course Exam" option located on the coursenavigation toolbar. Answer each question by clicking on the button corresponding to thecorrect answer. All questions must be answered before the test can be graded; there isonly one correct answer per question. You may refer back to the course material byminimizing the course exam window.4. GRADE THE TESTNext, click on "Submit Test." You will know immediately whether you passed or failed. Ifyou do not successfully complete the exam on the first attempt, you may take the examagain. If you do not pass the exam on your second attempt, you will need to purchase thecourse again.5. FILL OUT THE EVALUATION FORMUpon passing the course exam you will be prompted to complete a course evaluation.You will have access to the certificate of completion after you complete the evaluation.At this point, you should print the certificate and keep it for your records.Electrocardiograms Made Easy! Part I. Basic ECG Interpretations2 2007 NYSNA, all rights reserved. Material may not be reproduced without written permission.
IntroductionElectrocardiograms Made Easy! is a series of three courses comprised of: Basic ECGInterpretations, Interpreting Abnormal Atrial Rhythms, and Interpreting Ventricular Dysrhythmias.The aim of Part I. Basic ECG Interpretations (the first course in the series) is to advance thelearners’ understanding of the electrocardiogram and develop their skills at reading a basicelectrocardiogram rhythm strip. In a cardiac emergency being able to identify the precipitatingevent is half the battle, a battle in which “time is muscle.”As the song by Cruel Sea states, “the heart is a muscle and it pumps blood, like a big old blacksteam train.” If its function were as simplistic as this, then there would be no need to read on.However this is not the case and there have been a lot of advances in the way we think aboutand assess the functioning of the heart. If you listen to an orthopaedic surgeon, the heart’s mainpurpose is to pump antibiotics around the body. Depending on your position in the healthcareenvironment, your idea of the heart’s function may be similar. But for nurses, the heart and itsassociated problems is one of the most common ailments afflicting those for whom we care.Cardiovascular disease is composed of heart disease and cerebro-vascular accidents (strokes).Respectively, they are the leading and third leading cause of death in the United States.Together they account for the death of 950,000 Americans each year (Centers for DiseaseControl and Prevention [CDC], 2005). More broadly, 61 million Americans (almost one in four)suffer from some form of cardiovascular disease (CDC, 2005). With tightening purse strings, theimpact of cardiovascular diseases on healthcare resources is astounding. The Center forDisease Control and Prevention (CDC) estimates that in 2003 the cost of cardiovascular diseaseto the economy was 351 billion (CDC, 2005). So what does this mean to you?As active participants in health care you will undoubtedly come in contact with the one in fourAmericans who have cardiovascular disease. This contact may be in any setting: from anemergency department, surgical ward, rehabilitation, or your own family home. So it is importantto be familiar with and understand the basics of one of the easiest, most cost-effective, noninvasive tests performed to assess cardiac function: the electrocardiogram (ECG). It is importantto be able to interpret electrocardiograms in order for the skilled registered nurse to initiate timelyinterventions.This course will discuss the basics of the electrocardiogram, introduce an easy to remembermethod for rhythm analysis and build confidence in undertaking and interpreting the basic rhythmstrip. There is an emphasis on not letting the reader be “bogged down” with technical jargon andinstead focus on identifying what is “normal” in an electrocardiogram rhythm.Content Outline BackgroundElectrical PhysiologyRecording Electrical Impulses (The technical stuff)o The “How To” Perform an ECGUnderstanding Wave MorphologyThe Significance of Wave RecordingInterpreting a Basic Rhythm StripSummary and Practice ExamplesElectrocardiograms Made Easy! Part I. Basic ECG Interpretations3 2007 NYSNA, all rights reserved. Material may not be reproduced without written permission.
Course ObjectivesUpon the completion of this course the learner will be able to: Identify current electrode placement for performance of a 12 lead electrocardiogram.Identify the five characteristics used to determine a cardiac rhythm.Recognize the characteristics of normal sinus rhythm.Electrocardiograms Made Easy! Part I. Basic ECG Interpretations4 2007 NYSNA, all rights reserved. Material may not be reproduced without written permission.
About the AuthorDavid Pickham, MN, RN, began his nursing education at the University of Newcastle in NewSouth Wales, Australia. He has since worked as a registered nurse focusing on emergencymedicine in Australia, Canada, and the United States. He has a master’s of nursing in advancedpractice and currently is a doctoral candidate at the University of California. His interests liespecifically in the field of electrocardiography (also known as ECG or EKG) which led him tocreate courses on Electrocardiograms Made Easy!Electrocardiograms Made Easy! Part I. Basic ECG Interpretations5 2007 NYSNA, all rights reserved. Material may not be reproduced without written permission.
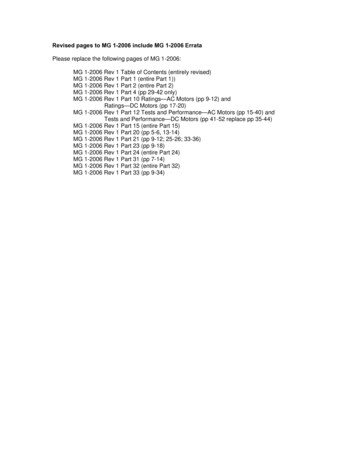
BackgroundWillem Einthoven, a Dutch physiologist, was responsible for developing the technique ofrecording the electrical activity of the heart (Bullock, Boyle, & Wang, 2001). Later winning aNobel Prize for his efforts, the electrocardiogram (ECG) has since become the mainstay in theinitial assessment of cardiac function. Importantly the ECG will not measure the heart’smechanical action; instead the ECG records the electrical activity responsible for cardiac function.Understanding the relationship between the mechanical/electrical systems within the heart willhelp conceptualize the ECG.Figure 1. “An early ECG” Courtesy of: Stichting Einthoven/Einthoven Foundation, the NetherlandsElectrocardiograms Made Easy! Part I. Basic ECG Interpretations6 2007 NYSNA, all rights reserved. Material may not be reproduced without written permission.
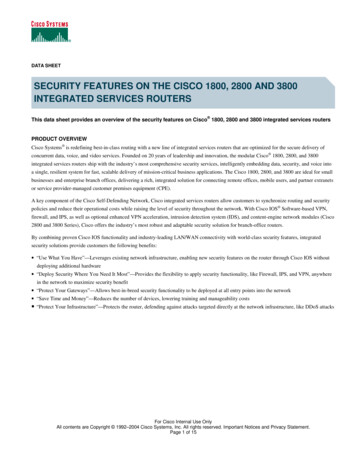
Electrical PhysiologyCardiac cells are physiologically unique within the body. These cells have the capability to initiateelectrical activity (automaticity), respond to electrical activity (excitability), relay an impulse(conductivity), and react physically to a stimulus (contractility). The importance of thesecharacteristics in cardiac functioning will be evident throughout.For the heart to perform a beat, a signal must be sent through the heart telling its muscle to work(contract). This “signal” originates in the right atrium in a specialized group of cells termed the SAnode (sino-atrial node). The SA node propagates a signal approximately 60-100 times perminute (Newberry, 2003). This signal or impulse moves from the SA node to the atria and AVnode (atrio-ventricular node) through “signal highways” in the atria (intra-atrial tracts). During thistime atrial contraction occurs. Once at the AV node the signal is delayed or “held-up” for afraction of time, before it is allowed to progress. This slight delay allows the atria to finishcontraction before ventricular involvement.After a small delay the impulse travels from the AV node to the ventricles through anotherspecialized highway located in the septum of the ventricles. This highway is called the Bundle ofHis. The Bundle of His branches into the left and right bundle branches, and each delivers theimpulse to their respective ventricles. Once in either ventricle these branches continue to formsmaller branches (much like a river stream) called Purkinje fibers. These smaller branches(Purkinje) deliver the impulse to the rest of the ventricle muscle whereby contraction occurs. Thedelivery of an impulse occurs simultaneously down the left and right ventricle. Refer to Figure 2for a visual illustration.Figure 2. “Conduction System Pathway” Courtesy of: University of OtagoElectrocardiograms Made Easy! Part I. Basic ECG Interpretations7 2007 NYSNA, all rights reserved. Material may not be reproduced without written permission.
In Summary:Electrocardiograms Made Easy! Part I. Basic ECG Interpretations8 2007 NYSNA, all rights reserved. Material may not be reproduced without written permission.
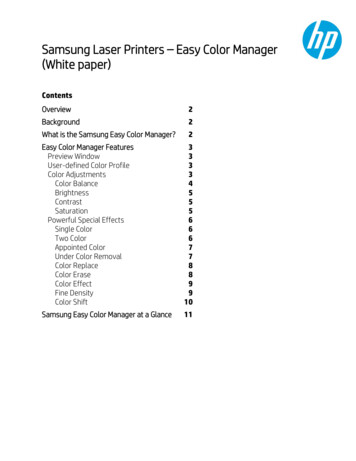
Recording Electrical Impulses (The technical stuff)In earlier periods an ECG was performed by placing a patient’s arms and legs into wired bucketsfilled with an electrolyte solution (Lilly, 2002) and recording the voltage difference (See Figure 1“An early ECG” in the Background section). We have since advanced on this methodconsiderably. Today we perform an ECG by placing ten electrodes in a pre-determined patternon the patient’s skin. These electrodes are then used by a galvanometer (a fancy soundingdevice used to measure low voltage currents) to record the voltage difference between any twoelectrodes. With a goal of decreasing the learner’s anxiety of ECG performance andinterpretation, the exact science behind action potentials and measurement will not be discussed.Knowledge of this is not pertinent to interpreting the basic ECG.The “How To” Perform an ECGDon’t be misled by the term 12 lead ECG. As stated above, an ECG requires the placement often leads (or electrodes). Simply stated, the galvanometer uses the ten leads to make twelvedifferent recordings. Depending on the type of ECG needed, the leads are placed in a specificlocation. The following is the basic locations for a 12 lead ECG: 4 limb leadso Right Arm (RA), Left Arm (LA)o Right Leg (RL), Left Leg (LL) 6 precordial (chest) leads (see Figure 3)o V1 - 4th intercostals space, right sternal bordero V2 - 4th intercostals space, left sternal bordero V3 - In between V2 and V4 (5th intercostals border)o V4 - 5th intercostals space, midclavicular lineo V5 - 5th intercostals space, anterior axillary lineo V6 - 5th intercostals space, midaxillary lineFigure 3. “Chest Lead Location” Courtesy of: EMS Solutions (http://ems-safety.com)Note: Each lead is recording a snapshot of the electrical activity within the heart at a given time,from its perspective.Electrocardiograms Made Easy! Part I. Basic ECG Interpretations9 2007 NYSNA, all rights reserved. Material may not be reproduced without written permission.
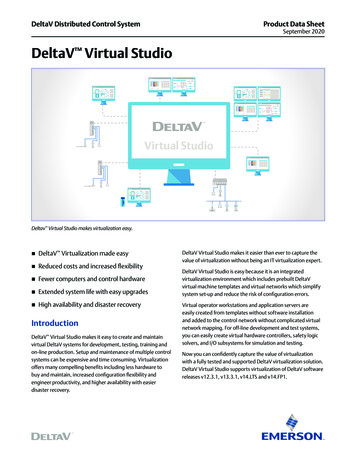
Not So Difficult Right? Now, Understanding What Has HappenedBy now you have a basic understanding of the electrical system of the heart and the technique forperforming an ECG.Depending on the brand of ECG that your organization uses, your printout page will basicallyhave a lot of differing lines each with a separate heading. Each one of these lines represents adifferent view of the cardiac function. At this stage we are ONLY interested with the line that saysII (lead 2). Often this is printed on the bottom of the page and again on the left hand side.When we look at wave morphology (Figure 4) we can see three distinctive waves or deflections.Revert back to the electrical physiology skills and we will review these in context. Note thelabeling of these three deflections as the P wave, QRS complex, and the T wave. Don’t worryabout anything else at this stage, it isn’t important.What do these represent? Thinking back, the SA node produces an impulse that travels throughintra-atrial pathways to the AV node, causing atrial contraction. This is shown by the P wave(referred to as depolarization of the atria). If you notice it moves from a straight line (baseline) toa small wave and then back to baseline. The return to baseline represents the small delayexperienced at the AV node. After the impulse is received from the atria, the atria can relax andregroup. During this time the impulse travels to the ventricles via the Bundle of His and thePurkinje fibers. This action contracts the strong ventricles and is represented by the larger QRScomplex (group of waves deemed Q, R, and S), representing the time the depolarization takes tospread through the ventricles (don’t worry about the individual letters at this stage, just keep inmind QRS ventricular depolarization). After a small delay, regrouping of the ventricles(repolarization) is represented by the T wave. The wave is much bigger when the ventriclescontract, as the ventricles are markedly larger then the atria.Figure 4. “Basic ECG Morphology” Courtesy of: University of Utah School of MedicineIn the normal cardiac cycle the P wave must be followed closely by the QRS complex andlikewise each QRS complex must be preceded by a P wave. As we now know, this will mean thatthe stimulus for a heartbeat has originated in the atria (P wave) and then excited the ventriclesElectrocardiograms Made Easy! Part I. Basic ECG Interpretations10 2007 NYSNA, all rights reserved. Material may not be reproduced without written permission.
(QRS wave). Think of the mechanics of a normal heartbeat: the atria will contract and then theventricles.Question: I now know what these waves and intervals represent, but why do the waves lookdifferent in each lead?Don’t worry, it all means the same thing but is represented differently depending on each leads’viewpoint. Imagine if you will that you and two friends are watching a float drive by and you areall in different viewing positions. Each person will have a unique view, one viewing side-on, oneviewing head-on, and another viewing the other side. No two views look the same despite seeingthe same event. This is what is occurring on an ECG. Look at Figure 5 which represents theprecordial (chest) leads. See how the waveform is recorded in the differing views. Don’t getcaught up on this! Accept that each lead has a different view of the same event and move on.Figure 5. “Precordial lead waveforms” Used with permission from eMedicine.com, Inc., 2007Do you have a thirst for knowledge?In the resting state the myocardial cell surface has a positive charge compared to the negativecharge inside the cell, hence the ECG reading is baseline as both equal and opposite chargescancel each other out. When initially stimulated, the area outside the cell will shift to negative andshift inside to positive. This shift causes an electrical force (depolarization wave) that can berecorded as it travels throughout conducting cells of the heart, changing the surface charge andcontracting. The different leads record this wave dissimilarly depending on their location andelectrode charge.Electrocardiograms Made Easy! Part I. Basic ECG Interpretations11 2007 NYSNA, all rights reserved. Material may not be reproduced without written permission.
The Significance of Wave RecordingWe have performed an ECG and recorded the electrical characteristics of the heartbeat. Is thereanything else we can learn from this wave morphology? YES. But first we need to understandwhy we use the paper we use.ECG paper is special, as its use allows us to calculate the time in various sequences of thecardiac cycle. We know (as it is recorded on the top of the paper) that ECG paper advances25mm/second (that’s five large boxes each second). Deducting from that, one large box(comprised of five smaller boxes) is equal to one fifth of a second or 0.20 seconds. STAY WITHME ON THIS. There are five smaller boxes in one big box, therefore equaling one fifth of 0.20seconds, or 0.04 seconds. See Figure 6.Figure 6. “Grid sizing”RECAP:Large box 0.20 seconds. Small box 0.04 seconds.Who cares? We do, read on!!If you look again at Figure 4, you will notice there are brackets between the wave deflections.These brackets are intervals that can be timed and compared to normal cardiac functioning.Labeled, these brackets are the PR interval, QRS interval, and the QT interval. Each intervalrepresents a mechanical function and has a set time for what is considered “normal functioning,”beyond these times functioning may be considered abnormal. At this stage in the ECG learning,just be able to understand what is considered normal (you will need to learn these distances).See Figure 7. PR interval (Onset of P wave to onset of QRS).o Time between onset of atrial depolarization and ventricular depolarization.o 0.12-0.20 seconds (3-5 small boxes). QRS interval (Beginning to end of the QRS).o Duration of ventricular depolarization.o Less then 0.12 seconds (3 small boxes).Electrocardiograms Made Easy! Part I. Basic ECG Interpretations12 2007 NYSNA, all rights reserved. Material may not be reproduced without written permission.
QT interval (Beginning of QRS to end of T wave).o Beginning of ventricular depolarization to end of ventricular repolarization.o Generally no more then 0.40 seconds (10 small boxes).Figure 7. “Intervals relative to pathway”Courtesy of: Stichting Einthoven/Einthoven Foundation, the NetherlandsElectrocardiograms Made Easy! Part I. Basic ECG Interpretations13 2007 NYSNA, all rights reserved. Material may not be reproduced without written permission.
Interpreting a Basic Rhythm StripSo far we have covered the history behind the ECG, basic electrophysiology, lead placement,and the significance of ECG paper, waveform and intervals as well as their association to themechanical aspects of cardiac function. Now it is time to move on to determining the basics ofECG reading.It is easy to cheat while reading ECG’s. We are all aware that the computer gives us a nice readout of the characteristics of the ECG. Up in the top left corner it will spell out everything it canabout the ECG. So why do we need to bother to read it?Like all computers, the ECG is dumb! That’s right I said it. It has been known to be wrong. Yousee an ECG is just one element of a larger clinical picture. Therefore an ECG needs to beinterpreted in context with the patient’s condition. Don’t be lazy and depend on the ECG forinformation about the patient’s cardiac function. There are five simple characteristics we need toidentify to successfully read a rhythm strip. Let’s go through them one by one.1. RateThe first step in reading an ECG is to determine the rate. Like all things in life there is more thenone method. Remember back to the wave morphology where the QRS represents ventriculardepolarization. This is the period when blood is ejected out of the ventricles into the pulmonaryand systemic systems. Calculating the number of times this ejection occurs per minute is theheart rate.The first method involves counting these heartbeats off the ECG paper. To achieve this, countand mark six seconds on the paper (five large boxes 1 second, therefore 6 seconds 30 largeboxes). Now count the number of QRS complexes in six seconds and multiply by ten (6 secondsx 10 1 minute). See Figure 8.Figure 8.Done! You can now correctly determine the rate from an ECG. Congratulations. Do you want toknow a more efficient way?The second method is much quicker. Look at the paper and try to align the R point of the QRS,with a darker line. Now count off each large box with fixed numbers, until you reach the nextQRS complex. These numbers are (hint: memorizes these) 300 for the 1st box, 2nd 150, 3rd 100,4th 75, 5th 60, 6th 50, 7th 43, and so on. This will give you an approximate heart rate. If there arefour boxes between the two R waves (QRS complexes) this means the heart rate is 75beats/minute. Look at Figure 9 and see if you can figure the rate.Electrocardiograms Made Easy! Part I. Basic ECG Interpretations14 2007 NYSNA, all rights reserved. Material may not be reproduced without written permission.
Figure 9.That’s right around 100 beats/minute (remember it’s an approximate).2. RhythmNow that we can figure out the rate, what we want to check next is whether the heartbeats areregular or irregular. This is important as it can help us identify certain dysrhythmias later on. Toassess whether the heart is beating regularly or irregularly we need to “map out” the R and Pwaves. There are two ways that this can be done. One way is to count the number of boxesbetween one R wave and the next. Then compare this distance to the next and adjacent Rwaves. Once the consistency of the R wave is established, map out the P waves. Are thedistances between R waves equal? What about the P waves?WANT THE EASY WAY OUT?Grab a pen and paper. Place this on top of the ECG readout leaving exposed the R waves. Nowmake a line corresponding with an R wave, repeat these 3 times. See Figure 10a.Figure 10a.Now move the paper along the rhythm strip comparing the R distances. See Figure 10b.Figure 10b.Electrocardiograms Made Easy! Part I. Basic ECG Interpretations15 2007 NYSNA, all rights reserved. Material may not be reproduced without written permission.
Do the same for the P wave. See Figures 10c and 10d.Figure 10c.Figure 10d.See how the distances between the R waves and the distances between the P waves map outwith each other. We can now call this rhythm “regular.” At this stage of the game we are onlyconcerned with the rhythm’s rate and whether it is regular or irregular. What is the rhythm rate inFigure 10d? Go back if you need to.If you answered 75 you are correct, well done. Now we know that the rhythm is regular with arate of 75 beats per minute. Too easy!3. & 4. Now Let’s Examine the P WaveAt this stage it is important to identify the presence of a P wave. If it is present we then check ifthe PR interval is within normal limits (look at Figure 11 for a guide). Can you identify thedistance of the PR interval in Figure 12 in the following section?Figure 11.If you said around four small boxes, then once again you are right.Now importantly, compare the PR interval in each beat. Use themapping technique to determine the rhythm regularity. Is thisdistance that we have identified the same in each beat? If so, westate that the PR interval is fixed. If it wasn’t we say that the PRinterval is varied.Electrocardiograms Made Easy! Part I. Basic ECG Interpretations16 2007 NYSNA, all rights reserved. Material may not be reproduced without written permission.
5. The QRSNow that you have the rate, we know it is regular and you have the presence of a P wavewith a fixed PR interval. It is time to see if the QRS is within normal limits. Do you rememberthe normal limits? Below is a summary. (You need to remember these!)CharacteristicPR intervalQRS complexQT intervalNormal limits0.12-0.20 seconds (3-5 small boxes)0.04-0.12 seconds (1-3 small boxes)Less than 0.40 seconds (10 small boxes)When considering the QRS complex we know that it should be three small boxes or less,from beginning to end (use Figure 13 as a guide). Look at Figure 12 below and see if youcan count it.Figure 12.Figure 13.If the QRS complex measures three boxes(0.12 seconds) or less, we term this narrow.If it is greater than three boxes we label thiswide. The significance of this will be evidentlater on, for now just be able to identifywhether the QRS is narrow or wide. Is theQRS in Figure 12 narrow or wide?If you said narrow then you’re doing well, remember ECG’s take practice and you’ll get it, but fornow just keep up.Electrocardiograms Made Easy! Part I. Basic ECG Interpretations17 2007 NYSNA, all rights reserved. Material may not be reproduced without written permission.
Sum it All Up Maestro!Every time you are given a rhythm to interpret, go through these important five questions. Thesewill help identify the rhythm.By now you can confidently establish these five steps by yourself.1.2.3.4.5.What is the determined rate?Is the rhythm regular or irregular?Is the P wave present?Is the PR interval fixed or varied?Is the QRS wide or narrow?If you can look at a rhythm and answer these questions you will identify whether the ECG isnormal or abnormal, that is the battle. If you are confident about what a normal ECG looks like,then you will easily and quickly recognize an abnormal ECG.Remember, if the ECG consists of a regular rhythm rate between 60 and 100 (sinus) and you canidentify upright P waves that have a fixed PR interval, followed closely by a narrow QRS complex,then you are looking at an ECG that is consistent with normal cardiac function. You havesuccessfully identified the first rhythm, Normal Sinus Rhythm. If, however, any of these differedfrom normal wave morphology then you have identified a dysrhythmia. For interpretation ofdysrhythmias please refer to these two additional courses, Electrocardiograms Made Easy!Part II. Interpreting Abnormal Atrial Rhythms and Electrocardiograms Made Easy! Part IIIInterpreting Ventricular Dysrhythmias. Before then however, work through these fiveexamples.Example 1.Rate:Regular or Irregular:P present: Y or NPR Fixed or varied QRS Narrow or wide:What is the rhythm?Electrocardiograms Made Easy! Part I. Basic ECG Interpretations18 2007 NYSNA, all rights reserved. Material may not be reproduced without written permission.
Example 2.Rate:Regular or Irregular:P present: Y or NPR Fixed or varied QRS Narrow or wide:What is the rhythm?Example 3.Rate:Regular or Irregular:P present: Y or NPR Fixed or varied QRS Narrow or wide:What is the rhythm?Example 4.Rate:Regular or Irregular:P present: Y or NPR Fixed or varied QRS Narrow or wide:What is the rhythm?Electrocardiograms Made Easy! Part I. Basic ECG Interpretations19 2007 NYSNA, all rights reserved. Material may not be reproduced without written permission.
Example 5.Rate:Regular or Irregular:P present: Y or NPR Fixed or varied QRS Narrow or wide:What is the rhythm?Please turn to page 21 for the answers to these practice examples.Hopefully you were able to answer the five questions, and correctly identified these strips asnormal sinus rhythm. Now that you can identify a normal ECG, you’re ready to take the nextcourse in this series: Electrocardiograms Made Easy! Part II. Interpreting Abnormal AtrialRhythms. Here you will be introduced to abnormal ECG’s, where you will learn how to identifyand interpret many common dysrhythmias.Electrocardiograms Made Easy! Part I. Basic ECG Interpretations20 2007 NYSNA, all rights reserved. Material may not be reproduced without written permission.
Answers to Practice ExamplesExample 1:Rate: 52Regular or irregular: RegularP present: YesPR fixed or varied: FixedQRS narrow or wide: NarrowRhythm: Normal sinus rhythm (NSR)Example 2:Rate: 75Regular or irregular: RegularP present: YesPR fixed or varied: VariedQRS narrow or wide: NarrowRhythm: Normal sinus rhythm (NSR)Example 3:Rate: 64Regular or irregular: RegularP present: YesPR fixed or varied: FixedQRS narrow or wide: NarrowRhythm: Normal sinus rhythm (NSR)Example 4:Rate: 90Regular or irregular: RegularP present: YesPR fixed or varied: FixedQRS narrow or wide: NarrowRhythm: Normal sinus rhythm (NSR)Example 5:Rate: 64Regular or irregular: RegularP present: YesPR fixed or varied: FixedQRS narrow or wide: NarrowRhythm: Normal sinus rhythm (NSR)Electrocardiograms Made Easy! Part I. Basic ECG Interpretations21 2007 NYSNA, all rights reserved. Material may not be reproduced without written permission.
References12 Lead ECG. (2007). Retrieved December 17, 2007, from http://www.ems-safety.com/12-leadekg.htmBullock, J., Boyle, J., & Wang, M. B. (2001). Physiology (4th ed.). Philadelphia, PA: LippincottWilliams & Wilkins.Centers for Disease Control. (2005). Preventing heart disease and stroke. Retrieved December17, 2007, from /prevention/cvh.htmElectrocardiogram (ECG). (n.d.). Retrieved December 17, 2007, am ecg/article em.htmEmergency Nurses Association, & Newberry, L. (Ed.). (2002). Sheehy’s emergency nursing:Principles and practice (5th ed.). St. Louis, MO: Elsevier Health Sciences Division.Lilly, L. S. (Ed.). (2003). Pathophysiology of heart disease. A collaboration project of medicalstudents and faculty (3rd ed.). Philadelphia, PA: Lippincott Williams & Wilkins.The Einthoven Foundation. (n.d.). The Einthoven Foundation Cardiology Information Portal.Retrieved December 17, 2007, from http://www.eint
Don’t be misled by the term 12 lead ECG. As stated above, an ECG requires the placement of ten leads (or electrodes). Simply stated, the galvanometer uses the ten leads to make twelve different recordings. Depending on the type of ECG needed, the leads are placed in a specific location. The following is the basic locations for a 12 lead ECG:File Size: 789KB