Transcription
Microsoft Excel 2016Basic Authoring andTesting GuideSection 508 Accessibility GuidanceAccessible Electronic Document Communityof Practice (AED COP)October 2018
ContentsContents . 1Microsoft Excel 2016 Basic Authoring and Testing Guide . 2Document Formatting . 21. Is the file name descriptive, and is the file in .xlsx format? . 2Text Formatting. 32. Are built-in features used to organize content? . 33. Are link names descriptive? . 3Object Formatting . 54. Is vital information in headers, footers, and watermarks duplicated in the worksheet? . 55. Did you use built-in features to create data tables? . 66. Do images and other objects have alternative text . 8Color Formatting . 97. Are colors and other visual characteristics that convey information (such as size, shape, andlocation) also described in text? . 98. Is the contrast ratio between text and background sufficient? . 9Miscellaneous . 129. Are descriptions of embedded audio, video and multimedia files accurate? . 1210. Did you exclude flashing objects? . 12Index of Figures . 13Index of Tables . 13Microsoft Excel 2016 Basic Authoring and Testing GuidePage 1
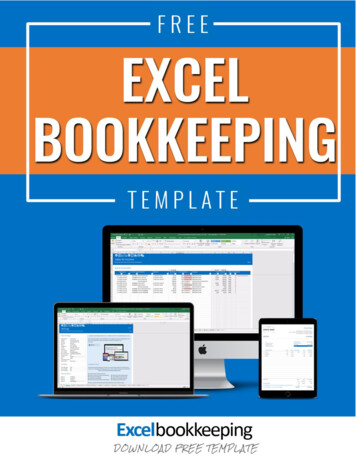
Microsoft Excel 2016Basic Authoring and Testing GuideDocument Formatting1.Is the file name descriptive, and is the file in .xlsx format?How to testInstruction: Look at the filename in Windows Explorer or the title bar in MS Excel. An exampleof a descriptive filename is “FundingBudget.xlsx.” The file must be in the “*.xlsx” format foraccessibility testing to be possible.NOTE: If the document extension is not displayed, open your documents folder in WindowsExplorer, select “View” check “File name extensions.”Figure 1: The Save As dialog windowTest A: Is the file name descriptive and does it identify the document or its purpose? If not, thedocument fails this test.Test B: Is the file in “Excel Workbook (.xlsx)” format? If not, the document fails this test.How to author for accessibilityA descriptive file name identifying the document or its purpose helps everyone (including peoplewith disabilities) locate, open, and switch between documents. In addition, the document mustbe in a “.xlsx” format because these authoring and testing instructions will only work if the file isin the “.xlsx” file format.Select “File tab Save As” Save as type: “Excel Workbook (*.xlsx)”Save the document with a descriptive file name.Microsoft Excel 2016 Basic Authoring and Testing GuidePage 2
Text Formatting2.Are built-in features used to organize content?How to testTest A: Does each sheet have a visual and/or logical reading order, left to right then top tobottom? If not, it fails this test.Test B: Can the sheet be navigated using the up, down, right or left arrow keys, and does itmatch the visual/logical reading order? If not, it fails this test.How to author for accessibilityTo create a worksheet with logical reading order content: Start all worksheets in cell A1Do not span content over multiple rows or columns.Figure 2: Example of Excel Worksheet with logical reading order3.Are link names descriptive?How to testInstruction: Find hyperlinks within a worksheetTest: Do links have meaningful names that describe their destination, function, and/or purposeOR are these determinable within context? If not, the document fails this test.Uniquely Named Link:www.section508.govLink Determinable within context:Get My Section 508 Questions AnsweredAn unclear link name with no context:click hereMicrosoft Excel 2016 Basic Authoring and Testing GuidePage 3
How to author for accessibilityAssistive technology users rely on meaningful names to determine the destination, function, orpurpose of links. For example, multiple “click here” links are confusing to assistive technologyusers because the name for each link is the same, while the destinations may be different.Figure 3: Insert Hyperlink configuration windowNaming and creating links: To edit the name of a link, select the cell containing the hyperlink. Edit the text in theFormula Bar.To create a hyperlink, select the cell for the hyperlink and either use the Hyperlink buttonon the "Insert" ribbon menu or “Ctrl K” to open the Insert Hyperlink configurationwindow. Specify the Text to display and the Address for the link and its destination.Microsoft Excel 2016 Basic Authoring and Testing GuidePage 4
Object Formatting4. Is vital information in headers, footers, and watermarksduplicated in the worksheet?How to testInstruction: Look for vital information in headers, footers, and watermarks (e.g. Respond byX date, CONFIDENTIAL, or Do Not Distribute). Note: Watermarks in Excel are floating objects,and cannot be made accessible.Test: Is the vital information duplicated in the first cell of the worksheet? If not, the documentfails this test.Figure 4: Example of vital information repeated in cell A1 of the worksheetHow to author for accessibilityAssistive technology does not automatically read information in headers, footers, andwatermarks, so you need to duplicate any vital information in cell A1.Microsoft Excel 2016 Basic Authoring and Testing GuidePage 5
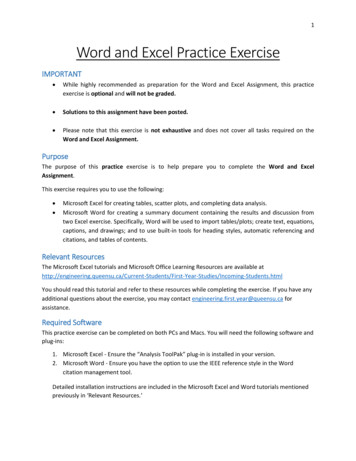
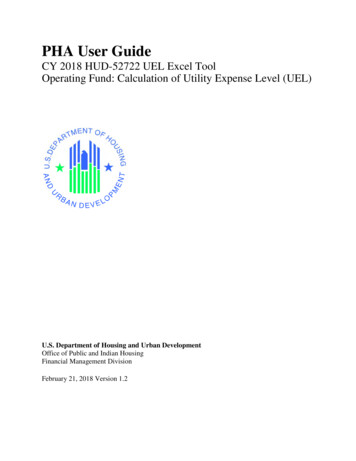
5.Did you use built-in features to create data tables?How to testInstruction 1: Select a table (“Home Editing Find & Select Go To”). Select any table listed inthe “Go To” options window. Note: Images of tables will never be listed in the “Go To” optionswindow.Test A: Does a “Table Name” display under the “Table Tools Design Properties” group? If not,the document fails this testFigure 5: Table Properties group displaying Table NameInstruction 2: Place your cursor on the first row and/or column of a table cell and see if theworksheet has identified the header row and/or column.Test B: Are “Header Row” and/or “First Column” in the “Table Style Options” group checked? Ifnot, the document fails this test.Figure 6: Header Row and First Column checked in the Table Style Options groupMicrosoft Excel 2016 Basic Authoring and Testing GuidePage 6
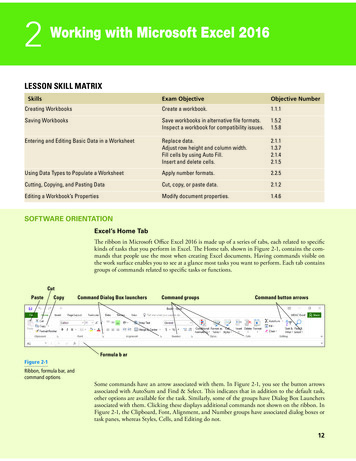
Instruction 3: Select a table. If the Ribbon shows “Picture Tools” tab, instead of the “TableTools” tab, then the table is an image.Test C: Is the worksheet free of pictures of tables? If not, the document fails this test.Figure 7: Image of data table showing “Picture Tools Format” tab when selectedHow to author for accessibilityAssistive technology users need to be able to identify column headers in data tables tounderstand the association between table cells and their respective headers.To create an accessible data table you Select “Insert Table.”1. In the create table pane, choose the range of cells for your data table.2. Check the “My table has headers” checkbox in the create table pane.3. Choose any cell and name your table “Table Tools Design Table Name.”4. Choose the first cell in the header column and/or row, and update the column and/or rowheadings with descriptive names.Microsoft Excel 2016 Basic Authoring and Testing GuidePage 7
How to testFigure 8: Image of data table showing “Picture Tools Format” tab when selected6. Do images and other objects have alternative textHow to testInstruction 1: Examine cells surrounding a non-text element for text describing the object or itspurpose/meaning.Test A: Does the image/object/shape/chart or other non-text element have descriptive text or isthere an appendix for all non-text elements? If not, the document fails this test.How to author for accessibilityIn Excel images, objects, shapes, charts and other non-text elements cannot beanchored/embedded in a cell. Screen reader users cannot access the alt-text of floatingelements. Therefore, you must add descriptive text to images and other objects by addinginformation in a cell near the object, or list the non-text elements and their descriptions in aseparate appendix.Microsoft Excel 2016 Basic Authoring and Testing GuidePage 8
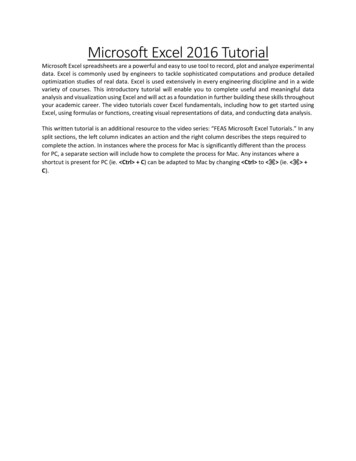
Color Formatting7.Are colors and other visual characteristics that conveyinformation (such as size, shape, and location) also describedin text?How to testUsing only color or other visual characteristics to convey meaning will not provide comparableaccess to people who are blind, have low vision, or are colorblind.Instruction: Find where you have used color and/or other visual characteristics to conveymeaning such as green, yellow, red, etc.Test: Is there text that conveys the meaning of the color or other visual characteristics? If not,the document fails this test.How to author for accessibilityThe following layout tables describe the progress for three projects using colors to symbolize thecurrent project status. Adding text in addition to the color provides comparable information tousers of assistive technology and people who are colorblind.Use text to duplicate the meaning of the color or visual characteristics (such as size, shape, andlocation).Table 1: Examples of a project status table using only color and color with textProject8.StatusProjectStatusProject AProject AOn TimeProject BProject BAt RiskProject CProject CLateIs the contrast ratio between text and background sufficient?NOTE: If the document text is black on white background (or close to it), you do not need toperform this test. This test requires the Colour Contrast Analyser (an external application).How to testExecute the Colour Contrast Analyser. Select “Download” (the application can be executedwithout downloading it onto your computer). Open the Colour Contrast Analyser. Drag the“Foreground eyedropper” icon over a sample of your text or image of text. Drag the “Backgroundeyedropper” icon over a sample of your background color.Microsoft Excel 2016 Basic Authoring and Testing GuidePage 9
Test: Have you formatted with the correct color contrast ratio? If not, the document fails thistest.Figure 9: Examples of pass and fail results with the Colour Contrast AnalyserMicrosoft Excel 2016 Basic Authoring and Testing GuidePage 10
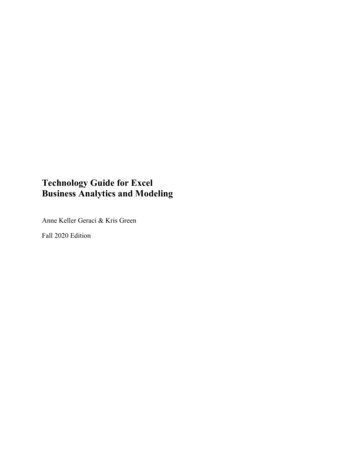
How to author for accessibilityPeople who are colorblind or have low vision will have comparable access if there is sufficientcontrast between the text and the background. The contrast standards are:Table 2: Table with contrast ratios for types and sizes of textType or Size of TextContrast RatioStandard text (12 pt regular)Large Text (14 pt bold or 184.5:1pt regular)Incidental text, text overlaid on images, and logotypes3:1Excluded from requirementCreate content with text or images of text that use color or shading with sufficient color contrast.If the contrast ratio does not pass, then adjust your foreground or background until it does pass.Table 3: Examples of good and insufficient color contrast ratiosGood Color ContrastInsufficient Color ContrastWhite text onblack backgroundratio 21:0:1Dark gray text onblack backgroundratio 3.0:1Dark green texton yellow backgroundratio 7.6:1Orange text onyellow backgroundratio: 2.1:1Light blue text ondark blue backgroundratio: 10.5:1Red text ondark blue backgroundratio: 1.1:1white text onred backgroundratio: 6.5:1Dark green text onred backgroundratio: 1.3:1Microsoft Excel 2016 Basic Authoring and Testing GuidePage 11
Miscellaneous9.Are descriptions of embedded audio, video and multimedia filesaccurate?How to testNOTE: If the document does not contain audio, video, or multimedia files, you do not need toperform this test.Instruction: Activate the audio-only, video-only, or multimedia file.Test A: Is there an accurate and complete text transcript for multimedia files, text descriptionfor audio files, and synchronized caption and/or audio description for video files? If not, thedocument fails this test.How to author for accessibilityIf you embed an audio-only, video-only, or multimedia file that contains meaningful informationinto your MS Excel Workbook, you must also provide additional information so that individualswith disabilities have comparable access to the information. Audio-onlyo Accurate and complete transcriptVideo-onlyo Accurate and complete text descriptionMultimedia (audio and video)o Accurate and complete synchronized captions and audio descriptions10. Did you exclude flashing objects?How to testTest: Is the document free of all flashing objects? If not, the document fails this test.How to author for accessibilityCreate your content without using flashing objects. Flashing objects can cause seizures andshould never be used.Microsoft Excel 2016 Basic Authoring and Testing GuidePage 12
Index of FiguresFigure 1: The Save As dialog window .2Figure 2: Example of Excel Worksheet with logical reading order .3Figure 3: Insert Hyperlink configuration window .4Figure 4: Example of vital information repeated in cell A1 of the worksheet.5Figure 5: Table Properties group displaying Table Name .6Figure 6: Header Row and First Column checked in the Table Style Options group.6Figure 7: Image of data table showing “Picture Tools Format” tab when selected .7Figure 8: Image of data table showing “Picture Tools Format” tab when selected .8Figure 9: Examples of pass and fail results with the Colour Contrast Analyser . 10Index of TablesTable 1: Examples of a project status table using only color and color with text .9Table 2: Table with contrast ratios for types and sizes of text . 11Table 3: Examples of good and insufficient color contrast ratios . 11Microsoft Excel 2016 Basic Authoring and Testing GuidePage 13
Microsoft Excel 2016 Basic Authoring and Testing Guide Page 12 . Miscellaneous 9. Are descriptions of embedded audio, video and multimedia files accurate? How to test NOTE: If the document does not contain audio, video, or multimedia files, you do not need to perform this test. Instructio