Transcription
Mohammed, A. S., Ugwuowo, F. I., Patrice, T. S., Muhammad, H.GENERALIZED TRANSMUTED EXPONENTIAL-EXPONENTIALRT&A, No 2 (68)Volume 17, June 2022Generalized Transmuted Exponential-ExponentialDistribution and its ApplicationsA. S. MOHAMMED1,2* , F. I. UGWUOWO2γ , T. S. PATRICE3 , H. MUHAMMAD4 1 Departmentof Statistics, Ahmadu Bello University, Zaria2 Department of Statistics, University of Nigeria, Nsukkaγ Email: fidelis.ugwuowo@unn.edu.ng3 Department of Mathematics, University of Yaounde I, CameroonEmail: patricetakam@gmail.com4 Division of Agriculture, Ahmadu Bello University, ZariaEmail: hamzamuhammad@abu.edu.ng*Corresponding author: Email: mohammedas@abu.edu.ngAbstractModeling of datasets requires knowledge of their appropriate distributional assumptions. In thisresearch, we generalized the transmuted exponential-exponential distribution, and it was observed thatthe addition of the shape parameter to the model proved to be helpful in improving the flexibility of themodel. Different characteristics, as well as structural properties of the model, were investigated andpresented in an explicit form. The probability density function of the order statistics and numericalresults for some descriptive statistics were obtained. A 95% confidence interval and interval widths,together with biases and mean square errors (MSEs) of the mean estimates, were equally evaluated usingthe Monte-Carlo simulation approach. To validate the flexibility of the model, we used real datasets andthe generalized transmuted exponential-exponential distribution (GTE-ED) outperformed the competingdistributions.Keywords: Transmuted Exponential-Exponential distribution, descriptive statistics, Order statistics, Confidence Interval1.IntroductionThe procedure of parameter(s) induction to a parent distribution has fascinated the attention ofnumerous researchers in the recent years [1]. The addition of one or more shape parameter(s) to agiven baseline model strengthens the distribution, especially when studying its tail characteristics.The parameter induction method has proved useful for boosting the fitness of a proposed model[2].In statistics, the modelling of datasets requires knowledge of appropriate distributional assumptions about the datasets. In theory, the tractability of a probability distribution can behelpful since it is easier to manipulate when modelling a dataset. The concept of generalizingdistributions was proposed by [3] which concern basically with raising the distribution functionof the baseline distribution say A(y) to the power of an arbitrary parameter c 0 which give riseto a new model or distribution of the form B(y) ( A(y))c f or c 0. The parameter (c) plays animportant role in adding skewness to the function A(y). In the early 1990s, generalized modelswere found to be useful in numerous areas of statistics and medical sciences due to their abilityto model different forms of data. These distributions were proposed by statisticians from variousfields. The concept of generating generalized distributions was used by [4] to developed a new492
Mohammed, A. S., Ugwuowo, F. I., Patrice, T. S., Muhammad, H.GENERALIZED TRANSMUTED EXPONENTIAL-EXPONENTIALRT&A, No 2 (68)Volume 17, June 2022Weibull distribution named the exponentiated Weibull distribution. Furthermore, [5] studied thegeneral characteristics of the exponentiated Weibull distribution. A new two-parameter modelcalled exponentiated exponential distribution which outperformed other competing distributionin the study when applied to a real dataset was studied by [6]. Notable authors like [7], [8]and [9] applied the same methodology and developed the exponentiated type distributions, andexponentiated generalized inverse Gaussian distribution respectively. The properties of exponentiated transmuted generalized Rayleigh distribution was proposed and studied by [10] and [11]studied the exponentiated generalized class of distributions. Consequently, the properties andMLEs of generalized odd generalized exponential- exponential distribution was presented in anexplicit form by [12]. The properties and applications of the transmuted exponential-exponentialdistribution (TE-ED) which has two scale parameters and a transmuted parameter. In practice, tofind the distribution that captures the sensitive part of a given dataset, there are many possibilitieswas studied by [13]. We can either estimate non-parametrically the density function as well as thedistribution function and compare them with the existing distributions to see which one is closestto the empirical distribution. However, in some situations for which we are obliged to considersome characteristics such as hazard rate, many of the existing distributions cannot adequatelymodel a dataset with non-monotone hazard rates, and as such, these distributions are limited inapplications.The current kinds of literature in mathematical statistics as highlighted by [14] pay more attentionto proposing more flexible distributions but give less concern to the hazard function of thedistributions. It is critical to generate distributions with varying failure rates because the hazardrate function guides model selection [11]. Furthermore, many of the existing exponential extendeddistributions cannot adequately describe some of the existing datasets, particularly the ones withmonotone and non-monotone hazard rates. For example, exponentiated exponential, transmutedexponential-exponential, and Weibull exponential distribution, among others. This has openedthe room for more research that can account for monotone and non-monotone hazard rate data.In this research, we are motivated by the above-mentioned rationale to develop a newexponential extended distribution called the generalized transmuted exponential-exponentialdistribution (GTE-ED). As compared to the existing exponential extended distributions, theGTE-ED is more flexible and can model both monotone and non-monotone hazard rate data.Table 1: Hazard rates behaviour for GTE-E and the competing imodalYesNoNoNoFrom table 1, we can deduce that GTE-ED has more advantages over the competing distributions in the study and, as such, it will be more robust in analysing data with different hazardrates.2.The Generalized Transmuted Exponential-Exponential DistributionConsider the density function a(y; λ, θ, α) λα (1 θ ) e αλy 2λθαe 2αλy and distribution function A(y; λ, θ, α) 1 e λαy 1 θe λαy of the transmuted exponential-exponential distribution with scale parameter α, λ 0, transmuted parameter 1 θ 1 and y 0 (Mohammedand Ugwuowo 2021). The cumulative distribution function and density of generalized transmutedexponential distribution (GTE-ED) are respectively derived from the following functions:B(y) ( A(y))c f or c 0493(1)
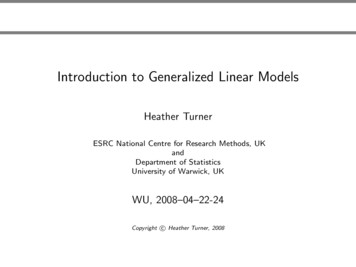
RT&A, No 2 (68)Volume 17, June 2022Mohammed, A. S., Ugwuowo, F. I., Patrice, T. S., Muhammad, H.GENERALIZED TRANSMUTED EXPONENTIAL-EXPONENTIALand,b(y) ca(y) ( A(y))c 1(2)The GTE-ED is then defined as;B(y) h 1 e λαy 1 θe λαy ic(3)and by taking the differential of B(y), we have;hi h ic 1b(y) c λα (1 θ ) e α λy 2λθαe 2α λy1 e λ α y 1 θe λ α y(4)where, y 0, α, λ, c 0 and 1 θ 1.Equation (4) can be written in the following contracted form; b(y) me λ α( f g 1)y (1 θ ) 2θ e αλy where, m c λ α ( 1) ff ,g 0 c 1f c 1g(5) Figure 1 displays some possible shapes of density and distribution function of the GTE-EDfor chosen values of the parameters a α, b λ, d θ and c. Moreover, the density changes inshape when the parameters take different values.Figure 1: density and distribution function of GTE-ED3.Statistical Properties of the modelHere, some statistical properties of GTE-ED including survival and hazard functions, quantilefunction, moments, moment generating function, limiting behaviour, and order statistics areconsidered and presented in an explicit form.3.1.Survival and Hazard functionIf Y has GTE E(α, λ, c, θ ) model, then the survival and hazard function are respectively given as;494
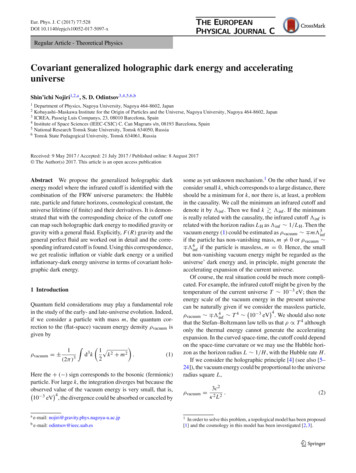
RT&A, No 2 (68)Volume 17, June 2022Mohammed, A. S., Ugwuowo, F. I., Patrice, T. S., Muhammad, H.GENERALIZED TRANSMUTED EXPONENTIAL-EXPONENTIALThe survival function is defined mathematically as;S( x ) 1 B(y)S(y) 1 1 e λαy 1 θe λαy c(6)The hazard function is defined mathematically as;h(y) b(y)1 B ( y ) c 1c λα (1 θ ) e αλy 2λθαe 2αλy1 e λαy 1 θe λαyhih(y) c1 1 e λαy 1 θe λαy(7)Figures 3 and 4 displays some possible shapes of hazard and survival function (hf) of the GTE-EDfor chosen values of the parameters a α, b λ, d θ and c. The hf can take the shape of eitherincreasing, decreasing, and unimodal as the parameter keep changing.Figure 2: Hazard function of GTE-EDFigure 3: Survival function of GTE-ED495
RT&A, No 2 (68)Volume 17, June 2022Mohammed, A. S., Ugwuowo, F. I., Patrice, T. S., Muhammad, H.GENERALIZED TRANSMUTED EXPONENTIAL-EXPONENTIALLimiting behaviour of the distributionIn this section, the asymptotic behaviour of the model is investigated by taking the limitas y 0 and y of the distribution function.1 e λαylim B(y) limy 0y 01 θe λαy c 0and,1 e λαylim B(y) limy y 1 θe λαy c 1The results show that the GTE-ED is a valid distribution since lim B(y) 0 and lim B(y) 1.y 0y The r th moments and moment generating function3.2.If Y has GTEE(α, λ, c, θ ) then, the r th moments is given as;() c Γ (r 1) 2θ(1 θ )f c 1c 1rE (y ) ( 1) fg(λ α)r f ,g 0( f g 1 ) r 1 ( f g 2 ) r 1(8)By using (8) the first two moments about the origin are obtained which can pave way infinding the variance and the coefficient of variation.When r 1,E (y) c(λ α) f ( 1)f ,g 0 c 1f c 1g (1 θ )( f g 1)2 2θ( f g 2)2 When r 2, (1 θ )2θE 2 c 2 ( 1) f cf 1 cg 1 (λ α) f ,g 0( f g 1)3( f g 2)3 (1 θ )f c 12θc 1Let, A1 ( 1) f g( f g 1)2( f g 2)2f ,g 0 (1 θ )f c 12θc 1A2 ( 1) f g( f g 1)3( f g 2)3f ,g 0y2 Therefore, E (y) cA(λ α) 1 and E y2 2cA2( λ α )2If Y has GTE E(α, λ, c, θ ) then, the variance and the coefficient of variation of GTE-ED arerespectively given as;rVar (y) 2c( λ α )2A2 cA(λ α) 1and C V 2c( λ α )2A2 (λcα) A1c A(λ α) 1Moment Generating FunctionIf Y has GTE E(α, λ, c, θ ) distribution then, the moment generating function (MGF) is givenas; Ky ( t ) c λ α f ,g 0( 1) f c 1f c 1g 2θ(1 θ ) λ α ( f g 1) t λ α ( f g 2) t496 (9)
RT&A, No 2 (68)Volume 17, June 2022Mohammed, A. S., Ugwuowo, F. I., Patrice, T. S., Muhammad, H.GENERALIZED TRANSMUTED EXPONENTIAL-EXPONENTIALThe r th moments about the mean3.3.If Y has GTE E(α, λ, c, θ ) distribution then, the r th moments about the mean is given; r f h ( 1)f ,g 0 h 0 E ( y µ )r c c 1f c 1g rh(1 θ ) Γ (r h 1)(( f g 1))r h 1 (λ α)r h µh 2 θ Γ (r h 1)(( f g 2))r h 1 (λ α)r hIf µ 0 , the result will give us the moment about the origin. 2 θ Γ (r 1)(1 θ ) Γ (r 1)E(yr ) c ( 1) f cf 1 cg 1r 1r 1r (( f g 1))f ,g 0(λ α)(( f g 2)) (10) ( λ α )rIn order to find the skewness and kurtosis, we have to find the expressions for r 1,2,3 and 4.The expressions are given below;If r 1, 1f h ( 1)E(y µ) c f ,g 0 h 0c 1f (1 θ ) Γ (2 h )(( f g 1))2 h (λ α)1 hc 1g 1h µh 2 θ Γ (2 h )(( f g 2))2 h (λ α)1 h If r 2, 2f h ( 1)f ,g 0 h 0E ( y µ )2 c c 1f (1 θ ) Γ (3 h )(( f g 1))3 h (λ α)2 hc 1g 1h µh 2 θ Γ (3 h )(( f g 2))3 h (λ α)2 h If r 3, 3E(y µ)3 c ( 1) f hf ,g 0 h 0 c 1f (1 θ ) Γ (4 h )(( f g 1))4 h (λ α)3 hIf r 4, 4f h ( 1)f ,g 0 h 0E ( y µ )4 c c 1f (1 θ ) Γ (5 h )(( f g 1))5 h (λ α)4 h c 1g c 1g 1h µh 2 θ Γ (4 h )(( f g 2))4 h (λ α)3 h 1h µh 2 θ Γ (5 h )(( f g 2))5 h (λ α)4 h The coefficient of skewness are kurtosis of the GTE-ED are respectively given as;CS E ( y µ )33( E ( y µ )2 ) 2c 3f h ( 1) f ,g 0 h 0CS c 2f h ( 1)f ,g 0 h 0 c 1fc 1f (cg 1 )(1h )µh(c 1g)(1h)µh 2 θ Γ (4 h )(1 θ ) Γ (4 h ) (( f g 1))4 h (λ α)3 h(( f g 2))4 h (λ α)3 h2 θ Γ (3 h )(1 θ ) Γ (3 h ) (( f g 1))3 h (λ α)2 h(( f g 2))3 h (λ α)2 handCK E ( y µ )4( E ( y µ )2 )2497 ! 32
RT&A, No 2 (68)Volume 17, June 2022Mohammed, A. S., Ugwuowo, F. I., Patrice, T. S., Muhammad, H.GENERALIZED TRANSMUTED EXPONENTIAL-EXPONENTIALc 4f h ( 1) f ,g 0 h 0CK c 2f h ( 1)f ,g 0 h 0 c 1fc 1f (cg 1 )(1h )µh(c 1g)(1h)µh 2 θ Γ (5 h )(1 θ ) Γ (5 h ) (( f g 1))5 h (λ α)4 h(( f g 2))5 h (λ α)4 h2 θ Γ (3 h )(1 θ ) Γ (3 h ) (( f g 1))3 h (λ α)2 h(( f g 2))3 h (λ α)2 h !2Table 2: Some selected measures of Y GTE E for some chosen values of the c and α 2, λ 0.3, θ 0.5. Thestandard errors (SEs) in bracket, where τ1 and τ2 stands for the mean deviation about mean and the meandeviation about the median11.2704(0.1022)21.9317(0.1168)Parameter n42.7374(0.1284)53.0223(0.1315)Table 3: Some selected measures of Y GTE E for some chosen values of the c and α 2, λ 0.3, θ 0.5 Thestandard errors (SEs) in bracket, where τ1 and τ2 stands for the mean deviation about mean and the meandeviation about the median12.1051(0.1317)23.0448(0.1414)Parameter an49844.0886(0.1468)54.4381(0.1479)
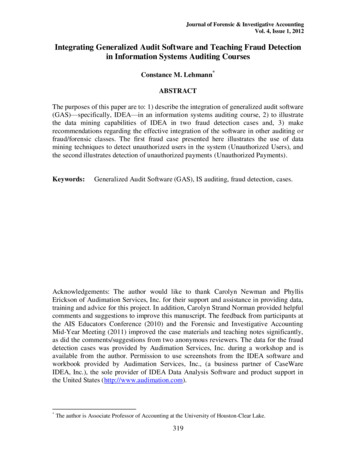
RT&A, No 2 (68)Volume 17, June 2022Mohammed, A. S., Ugwuowo, F. I., Patrice, T. S., Muhammad, H.GENERALIZED TRANSMUTED EXPONENTIAL-EXPONENTIALFrom tables 2 and 3, it can be deduced that as the value of the parameter (c) increases, themean, variance, mean deviation about mean and the mean deviation about the median alsoincreases. While the skewness and kurtosis decrease.3.4.The Quantile function of the modelThe quantile function can be defined mathematically as; Q(u) In f {y : u F (y)} forwhich 0 u 1. Since the function F (y) is continuous and monotonically increasing, then wehave Y F 1 (u).Corollary 1. The quantile function of the GTE-ED is given as; Q(u) 1ln αλθ 1 q 1(1 θ )2 4 θ u c ,2θ0 u 1(11)Note that, when u 0.5 (11) gives the median.The effect of the shape and Transmuted parameter were examined on the skewness andkurtosis and it was evaluated by using the relationship of Bowley (BS) and Moors (MK). Figures(a) and (b) shows the plot of Bowley (BS) and Moors (MK) for GTE-ED for fixed parameters (α andλ) respectively. The plot for the skewness shows a steady decrease as the parameter (c)increaseswhile for parameter θ shows a steady increase to a minimum point before decreasing as itsvalue increases. Again, the Kurtosis shows a steady decrease to a certain point and decreasesas the parameter (c) increases while for parameter θ, shows a steady decrease as its value increases.Sk B Q( 43 ) 2Q( 12 ) Q( 14 )Q(3414) Q( )and Ku M Q( 87 ) Q( 85 ) Q( 83 ) Q( 81 )Q( 68 ) Q( 82 )Figure 4: 3D diagram for Skewness and kurtosis499
RT&A, No 2 (68)Volume 17, June 2022Mohammed, A. S., Ugwuowo, F. I., Patrice, T. S., Muhammad, H.GENERALIZED TRANSMUTED EXPONENTIAL-EXPONENTIAL3.5.Order Statistics of the GTE-EDThe general form of the density of the hth order statistics for a given random samples y1 , y2 , ., ynfrom the distribution function is obtained as; bn,h (y) (h 1)n!b(y) B(y)h 1 (1 B(y))n h .!(n h)!Therefore, by substituting the resulting density as well as the distribution function of the GTE-EDwe have; c 1 c λα (1 θ ) e αλy 2λθαe 2αλy1 e λαy 1 θe λαy c h 1 c n h 1 e λαy 1 θe λαy1 1 e λαy 1 θe λαyn!( h 1) ! ( n h ) !bn,h (y) (12)The distribution of the minimum and maximum order statistics for the GTE-ED are respectivelygiven as; c 1 bn,1 (y) n c λα (1 θ ) e αλy 2λθαe 2αλy1 e λαy 1 θe λαy c n 1 1 1 e λαy 1 θe λαyand, bn,n (y) n c λα (1 θ ) e αλy 2λθαe 2αλy c n 1 1 e λαy 1 θe λαy4.1 e λαy 1 θe λαy c 1 Estimation of the Parameters of GTE-EDIf the parameters of the GTE-ED are unknown, then the maximum likelihood estimates of theparameters are presented below, let y1 , y2 , ., yn be the random sample of size (n) from the GTE-ED,then the log-likelihood function of (4) is obtained as;nnll (Ψ) n log α n log λ n log c λα yi log 1 θ 2θe α λ yii 1i 1n αλyi (c 1) log 1 θe e α λ yi θe 2 α λ yi (13)i 1By differentiating the ll (Ψ) with respect to the parameters. The following results were obtained;nnyi e α λ yi α λ yi)i 1i 1 (1 θ 2θen λ y e α λ yi θ λ y e α λ yi 2 θ λ y e 2α λ yiiii (c 1) (1 θe α λ yi e α λ yi θe 2α λ yi )i 1nnyi e α λ yiδll (Ψ)nδλ λ α yi 2α θ (1 θ 2θe α λ yi )i 1i 1n α λ yi θ α y e α λ yi 2 θ α y e 2α λ yiii (c 1) α yi e(1 θe α λ yi e α λ yi θe 2α λ yi )i 1nnδll (Ψ)e α λ yi e 2α λ yi2e α λ yi 1δθ (1 θ 2θe α λ yi ) ( c 1) (1 θe α λ yi e α λ yi θe 2α λ yi )i 1i 1δll (Ψ)δαδll (Ψ)δc ncnα λ yi 2λθ n log 1 θe α λ y e α λ y θe 2α λ y i 1 TThe ML Estimator Φ α, λ, c , θof the parameter vector is gotten by finding the solutionof the set of nonlinear system of equations. The results will give the MLEs α, λ, c and θ . Weapplied an optimization technique to numerically maximize the log- likelihood (LL) functiongiven in (13).500
RT&A, No 2 (68)Volume 17, June 2022Mohammed, A. S., Ugwuowo, F. I., Patrice, T. S., Muhammad, H.GENERALIZED TRANSMUTED EXPONENTIAL-EXPONENTIAL5.Simulation Study5.1.The DesignHere, a simulation study is conducted to assess the performance of the maximum likelihoodestimation method as expressed above. So also, 10,000 random samples were generated fordifferent sizes, n 20, 50, 100, 200, 300, and 500 from GTE-ED. Furthermore, the estimates, Biases,MSEs, Confidence Interval (C. Is) at 95%, widths are evaluated. The steps are:i Choose the initial values of the parameters and the sample size say (n).ii Draw a random sample of size (n) from the GTE-ED using the quantile function given in(11).iii Evaluate the estimates of the parameters using the approach of maximum likelihood.iv Repeat steps i and ii for N 10,000 times to evaluate the bias, mean square error, 95% C.Iand the interval width of the given estimates.Table 4: Results for the MLEs, Biases and MSEs, 95% C. Is, and Widths of the GTE-ED for α 3, λ 2, c 0.5, θ 0.5CISamplen 20n 50n 100n 200n 300n 0.3395The bias and MSE are respectively calculated as;501
RT&A, No 2 (68)Volume 17, June 2022Mohammed, A. S., Ugwuowo, F. I., Patrice, T. S., Muhammad, H.GENERALIZED TRANSMUTED EXPONENTIAL-EXPONENTIAL B Ψj 1NN i 1 Ψ j Ψ j and MSE Ψ j 1Nmate of Ψ j for j 1, ., 4.N i 1 2Ψ j Ψ j where, Ψ j stands for the esti-Table 5: Results for the MLEs, Biases and MSEs, 95% C. Is, and Widths of the GTE-ED for α 0.3, λ 0.5, c 1, θ 0.7CISamplen 20n 50n 100n 200n 300n 7Interpretation of the results for tables 3 and 4:a . The difference between the true and the estimated values of the parameters are relativelysmall.b . As the sample size increases the estimates converge toward the true values of theparameters.c . The interval widths, biases and MSEs decrease with an increase in sample size.502
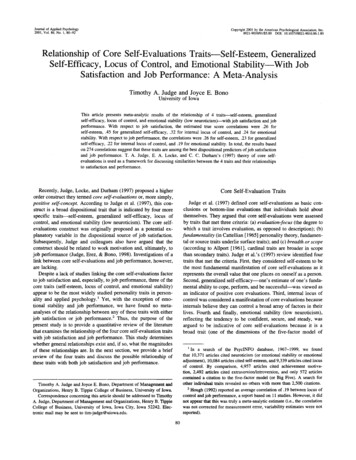
RT&A, No 2 (68)Volume 17, June 2022Mohammed, A. S., Ugwuowo, F. I., Patrice, T. S., Muhammad, H.GENERALIZED TRANSMUTED he first data is on the remission times (in months) of a randomly selected (128) bladder cancerpatients, which can be found in [15]. The second data was used by [16] and it represents thenumber of million revolutions before failure for each of the twenty-three ball bearings in the lifetests. These datasets are used in order to check the flexibility of the proposed distribution overthe competing distribution in the study.Table 6: Summary Statistics for the first Skewness3.2866Kurtosis18.4831Table 7: Summary Statistics for the second 73.40Skewness0.9419Kurtosis3.4889The CriteriaThe generalized transmuted exponential-exponential (GTE-ED), transmuted exponential-exponentialdistribution (TE-ED), exponentiated exponential distribution (EED) and exponential distribution(ED) are compared using some goodness-of-fit statistics, including Akaike Information Criterion (AIC), Cramer-von Mises Criterion (W), Anderson-Darling Criterion (AD) and KolmogorovSmirnov (KS). Furthermore, the model with the smallest values of these criteria indicates betterfit. The R software (AdequacyModel package) is employed to evaluate these statistics.Table 8: Estimated parameters for the first .10070.0922-θ0.79140.8898-c1.35061.2222-Table 9: Goodness-of-fit statistics for the first 5230.07250.07780.0844Tables 8 and 10 give the estimates of the parameters for the GTE-ED and the competing modelsin the study. The values of the computed goodness-of-fits statistics are given in tables 9 and11. It was observed that GTE-ED has the lowest values of these statistics among the competingdistributions in this study. Hence, the GTE-ED provides a better fit to the datasets.Figures 5 and 6 show that the GTE-ED fits both the datasets well compared to the competingdistributions.503
RT&A, No 2 (68)Volume 17, June 2022Mohammed, A. S., Ugwuowo, F. I., Patrice, T. S., Muhammad, H.GENERALIZED TRANSMUTED EXPONENTIAL-EXPONENTIALTable 10: Estimated parameters for the second .20950.2037-θ0.1407-0.9996-c5.81941.3535-Table 11: Goodness-of-fit statistics for the second e 5: Shows the estimated densities and ecdf for first dataFigure 6: Shows the estimated densities and ecdf for second data504KS0.10370.21720.22260.3072
Mohammed, A. S., Ugwuowo, F. I., Patrice, T. S., Muhammad, H.GENERALIZED TRANSMUTED EXPONENTIAL-EXPONENTIAL7.RT&A, No 2 (68)Volume 17, June 2022ConclusionThis research proposed an extension of the transmuted exponential-exponential distributionnamed the generalized transmuted exponential-exponential distribution. Expressions for some ofits statistical properties, including the moments, moment generating function, limiting behaviour,and quantile function, were explicitly derived. A simulation study was conducted, and numericalvalues for some of the descriptive statistics were obtained and presented. The method of themaximum likelihood is adopted in estimating the unknown parameters of GTE-ED. A 95%confidence interval and interval widths together with biases, mean square errors (MSEs) of themean estimates were equally presented on a table for different parameter values. An applicationto real datasets proved that the GTE-ED outperformed the competing distributions with lowervalues of the goodness-of-fit statistics used in this research.Disclosure statementOn behalf of The authors, I declare that no potential conflict of interest was reported.FundingNo funding was provided for the work.References[1] Tahir, M. H., & Cordeiro, G. M. (2016). Journal of Statistical Distributions and Applications, 3(1),1-35.[2] Bourguignon, M., Ghosh, I., & Cordeiro, G. M. (2016). General results for the transmutedfamily of distributions and new models. Journal of Probability and Statistics, Article ID 7208425,http://dx.doi.org/10.1155/2016/7208425[3] Gupta, R. C., Gupta, P. L., & Gupta, R. D. (1998). Modeling failure time data by Lehmanalternatives. Communications in Statistics-Theory and methods, 27(4), 887-904.[4] Mudholkar, G. S., Srivastava, D. K., & Freimer, M. (1995). The exponentiated Weibull family:A reanalysis of the bus-motor-failure data.[5] Mudholkar, G. S., & Hutson, A. D. (1996). The exponentiated Weibull family: some propertiesand a flood data application. Communications in Statistics-Theory and Methods, 25(12), 30593083.[6] Gupta, R. D., & Kundu, D. (1999). Theory and methods: Generalized exponential distributions. Australian and New Zealand Journal of Statistics, 41(2), 173-188.[7] Nadarajah, S., & Kotz, S. (2006). The exponentiated type distributions. Acta ApplicandaeMathematicae, 92(2), 97-111.[8] Silva, R. B., Barreto-Souza, W., & Cordeiro, G. M. (2010). A new distribution with decreasing,increasing and upside-down bathtub failure rate. Computational Statistics and Data Analysis,54(4), 935-944.[9] Lemonte, A. J., & Cordeiro, G. M. (2011). . The exponentiated generalized inverse Gaussiandistribution. Statistics and Probability Letters, 81(4), 506-517.[10] Afify, A. Z., Nofal, Z. M. & Ebraheim, A. E. D. (2015).Exponentiated transmuted generalizedRayleigh Distribution. Pakistan Journal of Statistics and Operation Research, 11(1), 115-134.[11] Cordeiro, G. M., Ortega, E. M., & da Cunha, D. C. (2013). The exponentiated generalizedclass of distributions. Journal of data science, 11(1), 1-27.[12] Abba, B., Mohammed, A. S., & Musa, A. G. (2020). On the properties and mles of generalizedodd generalized exponential- exponential distribution. Fudma Journal of Sciences,4(4), 155 165.[13] Mohammed, A. S., & Ugwuowo, F. I. (2021). The Transmuted Exponential-ExponentialDistribution with Application to Breast Cancer Data. Pakistan Journal of Statistics, 37(1), 1-18.[14] Mohammed, A. S., & Ugwuowo, F. I. (2021).On Transmuted Exponential-Topp Leon Distribution with Monotonic and Non-Monotonic Hazard Rates and its Applications. Reliability:Theory & Applications, 16(4 (65)), 197-209.505
Mohammed, A. S., Ugwuowo, F. I., Patrice, T. S., Muhammad, H.GENERALIZED TRANSMUTED EXPONENTIAL-EXPONENTIALRT&A, No 2 (68)Volume 17, June 2022[15] Lee, E. T. & Wang, J. W. (2003). Statistical methods for survival data analysis (3rd Edition),John Wiley and Sons, New York, USA, 535 Pages, ISBN 0-471-36997-7.[16] Lawless, J.F (1982) Statistical models and methods for lifetime data. John Wiley and Sons,New York, USA.506
1Department of Statistics, Ahmadu Bello University, Zaria 2Department of Statistics, University of Nigeria, Nsukka gEmail: fidelis.ugwuowo@unn.edu.ng 3Department of Mathematics, University of Yaounde I, Cameroon Email: patricetakam@gmail.com 4Division of Agriculture, Ahmadu Bello University, Zaria Email: hamzamuhammad@abu.edu.ng