Transcription
Technology Guide for ExcelBusiness Analytics and ModelingAnne Keller Geraci & Kris GreenFall 2020 Edition
(this page left blank intentionally)
ContentsChapter 1. Format of computer information in this guide5Chapter 2. Basic Computer Information62.1 Advice on computers and doing work electronically62.2 A Note About Naming Files and File extensions62.3 Folders and Organization72.4 Using the help system in Microsoft Office 201692.5 Copying and pasting between programs102.6 Saving your Excel data as .CSV (Comma-separated values)102.7 Activating the Data Analysis Toolpak11Chapter 3. Using Excel133.1 Excel desktop143.2 Excel cursor shapes163.3 Excel Errors173.4 Good Data Entry Practice183.5 Comments in Excel193.6 Managing Worksheets in Excel203.7 Sizing columns to make data fit203.8 Good spreadsheet organization213.9 Cell References in Excel223.10 Copying Formulas in Excel25Chapter 4 Computing Summary Statistics in Excel274.1 Computing mean & standard deviation in Excel274.3 Adding up a list of values274.4 Computing deviations in Excel274.6 Computing Medians & Modes in Excel284.8 Computing z-scores284.9 Computing Percentiles in Excel284.10 Using Descriptive Statistics – Data Analysis Toolpak28Chapter 5.Making and Using Pivot Tables315.1 What is a pivot table?315.2 Creating a pivot table315.3 Pivot Table – Show values as35
5.4 The Pivot Table Ribbon365.5 Grouping items in the table36Chapter 6 Sorting data39Chapter 7 Data Visualization417.1 Bar Graph437.2 Histograms497.3 Simple Boxplots (Box-and-Whisker Plots)537.4 Side-by-side Boxplots (Box-and-Whisker Plots)577.5 Scatter Plots637.6 Adding Trend Lines to a Scatter Plot647.766Logarithmic and Log-Log plotsChapter 8.Correlation & Regreession in Excel698.1 Correlation698.2 Simple Linear Regression708.3 Dummy variables with IF functions in Excel728.4 Multiple Regression73Chapter 9. Advanced Excel Functions769.1 Using an Excel VLOOKUP table769.2 Computing Values of Exponentials and Logarithms789.3 Setting up functions in Excel for shifting and Scaling79Chapter 10 Using SOLVER8010.1 Introduction to using SOLVER to minimize and maximize a function.8010.2 Setting up constraints in Excel8110.3 Adding constraints in Solver8310.4 Options in solver8510.5 Errors in Solver86
Chapter 1. Format of computer information in this guideThis technology guide is provided as a supplement to Business Analytics and Modeling, by KrisGreen – Fall 2020 Edition.This textbook contains two kinds of computer information to help you. Each will be formatted alittle differently, so here is a brief overview of each to help you.1. Basic information on using computers. One of the most important things you will need tolearn is how to use computers efficiently. Where will you store your data files? Howwill you retreive your half-completed assignment? How will you organize your files sothat you can find them again?2. Using Microsoft Excel. Chapters 3 through 10 contain information on using Excelefficiently to do various modeling activities. Since Excel is a visual environment, willpresent much of this information through screenshots like this:Your screen might look slightly different from this if you are using a different version ofExcel, however the procedures outlined here can be performed in ANY version of Excel.Remember that you can usually find out how to something with a quick Google or Youtubesearch such as “How to create a pivot table”.
Chapter 2. Basic Computer Information2.1 Advice on computers and doing work electronicallyThere is nothing so tragic as bad things happening to good students.Unknown InstructorIf you want to avoid being one of those good students to whom bad things happen, take heed ofthe following advice. It should become a mantra, repeated to yourself over and over until it is apart of your psyche:SAVE EARLY, SAVE OFTEN.Anytime you make a substantial change to your work like pasting a graphic in, typing a wholesentence or paragraph, adding a table, or reformatting, you should save your file. Save as soon aspossible after starting a file. There is also a keyboard shortcut for saving files: CTRL S. Use thisfrequently to avoid losing a substantial part of your work.2.2 A Note About Naming Files and File extensionsWhen you save your files (”Early and often”, remember) be sure to save them with a meaningfulname. If the file includes your solution to homework 2, then include ”homework 2” in the title.You may also want to save all the files for each course you are taking into a separate folder, namedfor the course. Finally, if the file is going to be sent electronically to your instructor (through emailor some course management system) it’s a good idea to make sure that your name appears on thefile in some way. After all, unless you are the only student in the class, the file name ”homework2” could belong to anyone. Your instructor may even establish guidelines for naming files in orderto make file management for the entire course easier on him/herself and the teaching assistants (ifany). Be sure to check whether your instructor has a preferred file-naming systemIt is also helpful when saving files to name them meaningfully. If you name the first Excelworkbook for every course you take ”File1” you will have a lot of files with the same name. Comeup with a naming convention that clearly helps you locate the files you want.Files with this extension . are typically used with this softare.DOC or .DOCXMicrosoft Word.XLS or .XLSXMicrosoft Excel.R or .RmdR Studio. (.Rmd is for R Markdown).CSVComma-Separated File (data)
2.3 Folders and OrganizationWhen saving your files, it also helps to have some sort of plan for organizing the files. In Windows,the way to do this is to use folders. These can be named anything you want, and you can have asmany folders inside a folder as you want. You can also put folders inside other folders. Just becareful: it’s easy to create such a complex nest of storage folders that you cannot remember whereyour files are.Option 1 – P:\\ Network Drive (limited to 250MB)One way of storing your files is on your P: drive. If you need to access your P: drive files fromsomewhere off-campus (or from your own computer), follow these instructions:
Option 2 – Google Drive (unlimited storage space)The other way of storing your files is on Google Drive. These files can be accessed using thisicon on the SJFC launchpad:For example, here’s how you might organize your Google Drive:The benefit of this method is that you can download and install a program called Drive (fromhttps://tools.google.com/dlpage/drive), which will automatically synchronize your Google Drivefiles to your personal computer.
2.4 Using the help system in Microsoft Office 2016The help system for Microsoft Office 2016 is fairly extensive. In Word or Excel (or Power Point),the help function is found near the top of the screen with the words “Tell me what you want to do”.You may need to get used to using the help features. Very often, your first try will not turn upanything, but always check the ”see also” line that appears with most help information. This willlink you to other information that is related to the topic you originally searched for.Within the information portion of the help window, most of the phrases and sentences arehyperlinked to allow you to navigate through the information to locate what you need.For example, using the ”Save As.” feature allows you to change the format of the file. To do this,use the pull-down menu below the file name to select a different file type.To open a file, you can either double-click the file icon in the browser or the Windows explorer,or you can open the file from within Excel. Simply open the file menu and choose ”Open”; thenbrowse through the folders on the computer to locate the file you want.
2.5 Copying and pasting between programsMicrosoft Office 2016 is designed so that you can select information in one program, copy it(using either the keyboard shortcut CTRL C or the menu command ”Edit/ Copy”) and then pasteit into another program. When you copy selections, they are placed in an area called the ”clipboard”. To take these selections from the clipboard and place them into a document (either anotherlocation in the same document, or in another document altogether) simply place the cursor whereyou want the information to go and either use the keyboard shortcut ”CTRL V” or the menu”Edit/ Paste” to paste the object in the location you have selected.When copying information from Excel to Word, consider using the “Paste Special – Bitmap”option, shown here, to paste a bitmap of your work into a document. This will ensure that yourinformation (in Word) looks exactly like it does in Excel – this may prevent excessive “clean-up”re-formatting of your information.2.6 Saving your Excel data as .CSV (Comma-separated values)In order to import your data into other software such as R or SAS, it is recommended that youSAVE your data in a format known as Comma-separated Values, or CSV. For example, thefollowing file has five variables (indicated by their names in the first line) and each data item isseparated from the next by a commaTo save your data in the CSV format, use the “File Save As” menu option and indicate CSV forthe filetype:NOTE: If you have mutiple Worksheets in your Excel file, uou will need to save each sorksheetto an individual CSV file.
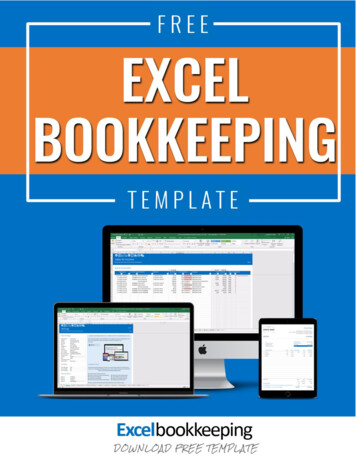
2.7 Activating the Data Analysis ToolpakTo enable the Data Analysis component within Excel:1. Click File2. Next, click on Options (your screen maylook like one of these images:
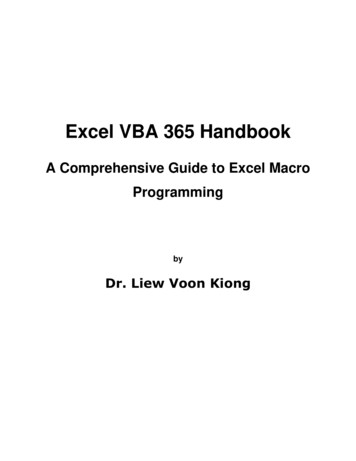
3. Click on the ‘Add-Ins’ tab, and then click on ‘Analysis ToolPak’.4. Next, click on Go.5. Lastly, check the box next to Analysis ToolPak and Analysis Tool Pak-VBA. Click onOK.The Data Analysis component within Microsoft Excel is now enabled and you will be able tocomplete the examples and exercises contained within this Learners Guide as needed.
Chapter 3. Using ExcelIn this chapter, we will present some information about using Excel with a brief set up of how aworksheet should be organized in order to perform proper data anlaysis and conversion to othersoftware packages such as R or SAS.One of the benefits of using Excel to do computations is the use of formulas. Any formulas in theformat below show the syntax of formulas to be typed into Excel. Formulas might refer to othercells within the worksheet, as in this example where we are adding cells B3 and C3, then dividingby the contents of cell D3: (B3 C3)/D3 or they might make use of built-in Excel functions, as in this example which will return the sumof the values found in cells B3, C3, D3, E3, and F3, or B3:F3 for short. SUM(B3:F3)Any formulas shown in this format, with specific cells or cell ranges in the formula, should betyped exactly as shown, assuming that your spreadsheet is set up as described in the informationor as shown in the accompanying screenshots and images.
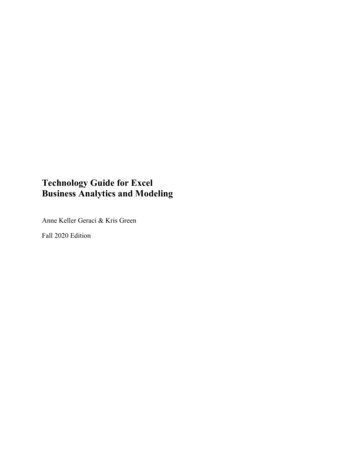
3.1 Excel desktopThis lesson will introduce you to the Excel desktop. To begin this lesson, start Microsoft Excel.The Microsoft Excel window appears and your screen will look similar to the one shown here.Starting at the top of the Excel desktop, you will see the following items: The program control bar: This displays the name of the current workbook andprovides buttons for minimizing, maximizing, and closing the program on the righthand side. The left-hand side has a quick button for saving the workbook (the diskicon), undo-ing and redo-ing actions (the looping arrows), and a pull-down menuto customize the interface. The extreme left of the program control bar has aMicrosoft Office icon; clicking this accesses features that let you save, open, orprint workbooks. Menu tabs: These tabs, labeled ”Home”, ”Insert”, ”Page Layout”, ”Formulas”,”Data”, ”Review”, ”View”, and ”Add-ins”, control the ribbon below. Unless youhave installed an Add-in (like StatPro) you may not see the last of these options. Ribbon: The ribbon (formerly the toolbar) has icons for most of the actions youmight need to perform in Excel. Selecting different menu tabs changes the icons onthe ribbon to the ones associated with that tab. Usually, these are grouped together.Hovering the cursor over any of the icons provides additional information about thetool. Formula Bar and Name Box: The formula bar has two regions. The left area (theName Box) allows you to select, view, or name cell ranges in the current worksheet.The right area (the Formula Bar) displays the formula entered into the current activecell, or allows you to type in a formula.
Workspace: The main area of the screen is a grid of cells into which you enterinformation, data, and formulas. Each of these cells has a name, identified by firstthe column (A, B, C, etc.) and then the row (1, 2, 3, etc.) So cell D6 is in the fourthcolumn (labeled D) and the sixth row. Worksheet Control: This area, just below the workspace, has tabs to select differentworksheets in the workbook. Status Bar: The status bar provides quick statistics for the region of data that iscurrently selected in the worksheet along the right side. Along the left side is whereyou will see error messages and notifications.
3.2 Excel cursor shapesThe pointer on the screen can take any of nine different shapes. The shape of the pointer is a clueto what actions will take place when you click the left mouse button.Shape of pointerAction when you left clickNormal arrowSelects the current itemFat plus signSelects the cell (either for entering data/formulasor for other purposes, like copying)Skinny plus signClick and drag to copy the formula(s) or the patternin the selected cell(s) to other cells on theworksheetI-beamEnter textShort down arrowSelects entire columns of dataShort right arrowSelects entire rows of dataDouble arrow (one line)Click and drag to change cell widths (left-rightarrows) or heights (up-down arrows)Four-headed arrowClick and drag to move cells or toolbars around
3.3 Excel ErrorsUnder certain circumstances, even the best formulas can appear to have freaked out once you getthem in your worksheet. You can tell right away that a formula’s gone haywire because instead ofthe nice calculated value you expected to see in the cell, you get a strange, incomprehensiblemessage in all uppercase letters beginning with the number sign (#) and ending with anexclamation point (!) or, in one case, a question mark (?). This weirdness is known, in the parlanceof spreadsheets, as an error value. Its purpose is to let you know that some element - either in theformula itself or in a cell referred to by the formula - is preventing Excel from returning theanticipated calculated value.Here is a list of some error values and their meanings:#DIV/0!Appears when the formula calls for division by a cell that either contains the value 0or, as is more often the case, is empty. Division by zero is a no-no according to our mathematicalrules (you can divide a pizza into 2 slices, but you cannot divide a pizza into zero slices).#NAME?Appears when the formula refers to a range name that doesn’t exist in the worksheet.This error value appears when you type the wrong range name or fail to enclose in quotation markssome text used in the formula, causing Excel to think that the text refers to a range name.#NULL!Appears most often when you insert a space (where you should havecomma) to separate cell references used as arguments for functions.used a#NUM!Appears when Excel encounters a problem with a number in the formula, such as thewrong type of argument in an Excel function or a calculation that produces a number too large ortoo small to be represented in the worksheet.#REF!Appears when Excel encounters an invalid cell reference, such as when you delete acell referred to in a formula or paste cells over the cells referred to in a formula.#VALUE!Appears when you use the wrong type of argument or operator in a function, orwhen you call for a mathematical operation that refers to cells that contain text entries.
3.4 Good Data Entry PracticeOrganize your spreadsheets so that the data is stored with the variables in columns andobservations are stored in rows. Make sure that each variable has a heading at the top of the columnof data to identify it. It’s a good idea to add comments to each variable name in order to explainthe coding and the units of the data. Make sure each observation has a unique identifier.It is also very important that each cell in the data contain information from only one variable. Forexample, if you are coding information about homes and you want to record data on the garage,you have two things to deal with: whether the garage is attached to the house or not, and the numberof cars that the garage can hold. You would not want to have the cells coded as ”Detached 2” and”Attached 1” and so forth. That is mixing two variables, type of garage and size of garage, into asingle variable. It would be better to either123456 create two variables, one for ”Type,” coded as ”attached” or ”detached” and aseparate variable for number of cars, as shown here: code a single variable (nominal categorical) to include the information, perhapsusing the codes belowattached, 1 car garageattached, 2 car garagedetached, 1 car garagedetached, 2 car garageother type of garageno garage
3.5 Comments in ExcelExcel allows you to add notes, called ”comments” to any cell. These comments are not part of thedata or formulas in the cell, and they do not normally appear in the worksheet. Instead, any cellwith an attached comment will have a small red triangle in the upper right corner. If you place themouse pointer over a commented cell, the comment will appear. Comments are used to includesuch information as the way in which a variable is coded, the units of numerical data, andreferences to the source of the data.Figure 1: Example of a Cell commentTo add a comment to a cell, right click on the cell. In about the middle of the context menu, theoption ”Add comment.” should appear. Select this option, and an editable comment box willappear. Type your comment in the box. When you are done, select another cell with the mouse.Your comment will be entered into the spreadsheet. To make changes to an existing comment,right click on the commented cell and select ”Edit comment.” To delete a comment from a cell,right click on the cell and select ”Delete comment.”
3.6 Managing Worksheets in ExcelAn Excel workbook (e.g. MYDATA.XLSX) can contain many different worksheets. By default,these are named ”Sheet1”, ”Sheet2”, etc. Worksheets are accessed by the tabs at the bottom ofthe screen, as shown here:To re-name a sheet: double-click on the name of the sheet and it the sheet name will behighlighted. Type in the new name for the sheet and hit ENTER. (You can also right click on thesheet name and select ”Rename” from the menu.)To add another worksheet to your workbook you may either use the ”Insert” menu, or right-clickon the worksheet tabs and select ”Add worksheet”. You can also click on the worksheet tab to theright of the last worksheet in the workbook. To change the order of the worksheets, click and dragone of the tabs to a new place in the list; you will see a small sheet icon and a down arrow showingyou where the sheet will be placed. It is also helpful to rename the worksheets with moremeaningful names than ”Sheet1” and ”Sheet2”. To do this, either3.7 Sizing columns to make data fitYou may also run into the problem that information you enter into cells in a spreadsheet might notfit. You have two options to get information to fit: You can either resize the columns or you canenter the text on multiple lines. To resize the columns, you can go to the column header and eitherclip-and-drag the width of the column to the desired size or you can double-click on it so that itautomatically resizes to be wide enough for the widest entry in that column.To enter information in multiple lines within a single cell in Excel, first type the information onthe first line and then hit ALT ENTER to move to the second line. You can use as many lines asyou want.
3.8 Good spreadsheet organizationWhen doing summary calculations in Excel, it is recommended that you leave a space between theraw data and the calculations. For example, in this worksheet we are computing the mean of theSalary data (in column A). Note that we left column A blank and make our calculations inColumn C and D.It is also acceptable to use a new worksheet for such calculations.
3.9 Cell References in ExcelExcel organizes information into sheets. Each worksheet is then organized by columns (labeledby letters) and rows (labeled by numbers). Thus, every cell (rectangle on the worksheet thatcontains information) has a name, called a cell reference. This cell reference is usually given theway you called out locations on the game Battleship: as a column and a row. For example, in theworksheet shown at the right, the word ”SALARY” is in cell A1. The mean of the salary data is incell D1. Such a reference is called a relative cell reference.There are other types of cell references (called absolute cell references) that you will learn aboutbelow. The other important thing to know about cell references is that you can easily refer to ablock of cells, as long as the block of cells forms some sort of rectangle. For example, to refer tothe salaries themselves on the worksheet above, you would refer to all the cells in the rectanglestarting in cell A2 and continuing through cell A11. In Excel notation, this entire range of cells isidentified by A2:A11.
Absolute Cell References in ExcelAbove, you learned how to refer to any cell or range of cells using the grid system in Excel. Ifthere is data in the cell in column D in row 2, this cell is referred to as D2. However, this type ofcell reference (a relative reference) will change if the formula is copied to another cell. Many times(as in the example below of computing deviations) a particular cell reference will need to beabsolute. This means that it will not change if the formula is copied. To make a cell referenceabsolute, place a dollar sign ( ) in front of both the column and row. Thus, an absolute referenceto cell D2 would look like D 2.As you may have guessed, you can have mixed references also, where either the column or row isabsolute. In general, if you don’t want part of the reference (either the row or column) to changeas you copy the formula, be sure to place a dollar sign in front of it.When you are typing a cell reference into a formula, you do not have to type the dollar signs toconvert them to absolute references. After you type a cell reference in a formula (say you typeA2), hit the F4 button along the top row of the keyboard. This converts the current cell referenceinto an absolute reference (so now you would have A 2). If you hit the F4 button again, it isconverted to a mixed reference with the row fixed (A 2), hitting it again will convert it to a mixedreference with the column fixed ( A2). Finally, hitting F4 a fourth time will cycle back to a relativereference (A2).Three dimensional cell references in ExcelIn addition to referring to cells by the column and row, Excel allows you to build formulas thatinclude references to cells on other worksheets in the current workbook. Suppose you are enteringa formula in ’Sheet 1’ of a workbook and there is a number in cell D4 of ’Sheet 2’ that you wantthe formula to look up. Simply typing D4 in the current formula will not work; Excel will simplylook up the value in cell D4 of the workbook containing the formula. To get around this, you mustuse a 3D cell reference. All this involves is including the name of the worksheet in single quotes,followed by the ”bang” or exclamation mark symbol (!) and then the normal cell reference. So, inour example, to get a formula in ’Sheet 1’ to use the value in cell D4 from ’Sheet 2’, you need totype the cell reference exactly in the form’Sheet 2’!D4
Naming Cell RangesThere is another way to refer to cell ranges (or individual cells) besides a cell reference. You cangive the cells or cell ranges their own names and then use these names in formulas forcomputations. The figure below shows the C05 Homes.xls data with the data in the Price variable(column M) selected. To give this range of cells a name, we simply click on the ”Name Box” tothe left of the formula bar and type a name; in this case, we’ll call the range of cells ”Price”. Note:there are no spaces allowed in the name box.Now, in any formula in the worksheet we can use ”Price” instead of the range M4:M278. Insteadof typing the formula AVERAGE(M4:M278), you could just type the formula AVERAGE(Price). Notice that such references are always absolute.This has the benefit of making all the formulas more readable. You can see a list of all the namedranges in the workbook by clicking on the downward pointing triangle next to the name box.
3.10 Copying Formulas in ExcelThere are three different ways to copy formulas in Excel from one cell to another cell or to agroup of cells (like a whole column): standard copy and paste commands, dragging the fill handle,or double-clicking the fill handle.Using Copy and Paste CommandsThis method is the most obvious. First select the cell with the formula you want to copy. Copythis using either CTRL C, the copy button on the toolbar, or the ”Edit/Copy” menu command.Now highlight the cell or cells where you want the formula to be placed and paste it in using eitherCTRL V, the paste button on the toolbar, or the ”Edit/Paste” menu command.Dragging the Fill HandleIf you want to copy the formula to the column of cells beneath it, or to the row of cells beside it,you can use the fill handle.The fill handle is a tiny square that appears in the lower right corner of a cell you have selected. Ifyou click on this fill handle and drag down (or right), then, when you release the mouse button,the formula from the first cell (or group of cells!) is copied to all the cells in the area youhighlighted by dragging. Be sure that you are clicking on the fill handle, though. You’ll know forcertain that you are on the fill handle because the cursor will change from a fat plus sign to a skinnyplus sign.Double-clicking the fill handleIn certain circumstances, you can double-click the fill handle and Excel will automatically copyand paste the formula all the way down the column until it reaches the end of the column to theleft of the one in which you are pasting the formula.
How the Fill Handle Works to Complete a sequence of numbersIn Excel, you may have used the fill handle to copy a formula down a column or across a row.Remember, the fill handle is the little dot in the lower right corner of the active cell or active cellregion. The fill handle can also be used to fill in patterns in a sequence of numbers that you enter.For example, suppose you want to generate a column of numbers 10, 20, 30, 40, on up to 300. Itwould be tedious to type these by hand. Excel can help! Start by typing 10 in cell A1, 20 in cellA2 and 30 in cell A3. Now highlight the cells (A1:A3).Click and drag the fill handle all the way down the column until the little floating box that followsthe cursor says ”300”. Release the mouse button and your list of numbers is filled in!
Chapter 4 Computing Summary Statistics in Excel4.1 Computing mean & standard deviation in ExcelExcel uses the function AVERAGE for the mean. To compute the mean of the data in cellsA2:A11, we enter the formula average(A2:A11)into any cell on the spreadsheet. If you later move or copy the cell containing this formula, thecell references will be changed since we used relative cell references. This means that the formulawill probably not point to the right cells anymore. Also remember that if you change any of thedata in cells A2:A11 the mean will be re-calculated instantly. If, however, you add data outsidethis range, you will need to change the formula.There are two different standard deviation functions to use in Excel, depending on whether thedata is from a sample or a population.To compute the standard deviation of a sample (this is the most commonly used version), use theformula stdev(range of cells)For the standard deviation of a population, use the formula stdevp(range of cells)4.3 Adding up a list of valuesIf you have a list of values, you can quickly add them together using the SUM command in Excel.For example, if your values to be added are in cells A2:A26, entering the command SUM(A2:A26)into cell B2 (or any other cell) will add the values together.4.4 Computing deviations in ExcelIn order to compute the deviations in Excel, we first need the mean of all the data. Let’s calculatethis with Excel by typing average(A2:A20) into cell F1.Now, we will create a new column for the deviations. In cell B1, type ”Deviation” so that thecolumn has a label. Now, in cell B2, we want to enter a formula to compute difference betweenthe first data point (in cell A2) and the average (an absolute reference to cell F1). Thus, we enterthe formula A2 - F 1Now we simply copy this formula (see below) down to the other cells, using the “Fill Handle”procedure described above.
4.6 Computing Medians & Modes in ExcelTo compute the median of the data in cells A2:A11, we enter the formula MEDIAN(A2:A11)into any cell on the spreadsheet. Remember, though, that if you later move or copy the cell, thecell references will be changed since we used relative cell references. Also remember that if youchange any of the data in cells A2:A11 the median will be re-calculated instantly. If, however, youadd data outside this range, you will need to change the formula.The mode is computed with the formula MODE(A2:A11)You may get the result #N/A if there is no mode. If there is more than one mode, Excel just guessesand gives one of them. The fact that there may be more than one mode, or no mode at all, is whythis statistic is rarely use
2.4 Using the help system in Microsoft Office 2016 9 2.5 Copying and pasting between programs 10 2.6 Saving your Excel data as .CSV (Comma-separated values) 10 2.7 Activating the Data Analysis Toolpak 11 Chapter 3. Using Excel 13 3.1 Excel desktop 14 3.2 Excel cursor shapes 16 3.3 Excel E